
| High-growth enterprises with 10 or more employees in the base year by turnover and employment, 2014 - 2017 | |||||
| 2014 | 2015 | 2016 | 2017 | ||
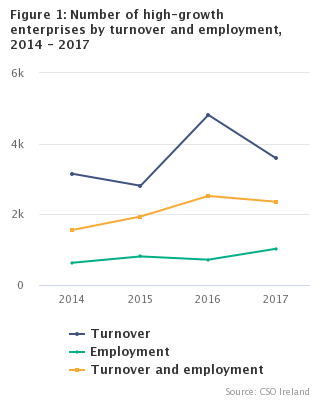
| High-growth enterprises | No. | 5,338 | 5,556 | 8,052 | 6,967 |
| Turnover | No. | 3,146 | 2,809 | 4,814 | 3,585 |
| Employment | No. | 631 | 809 | 717 | 1,026 |
| Turnover and employment | No. | 1,561 | 1,938 | 2,521 | 2,356 |
| Non-high-growth enterprises | No. | 9,833 | 9,674 | 7,567 | 9,510 |
| Enterprises active for at least three years1 | No. | 15,171 | 15,230 | 15,619 | 16,477 |
| Rate of high-growth enterprises | % | 35.2 | 36.5 | 51.6 | 42.3 |
| 1Enterprises that were active for at least three years from the reference year and with 10 or more employees in the base year | |||||
This new release details the existence and characteristics of high-growth enterprises in the Irish business economy. The release analyses enterprises active over a three-year period and who had 10 or more employees at the beginning of the period. Enterprises in the Structural Business Statistics series were linked across multiple years to measure their growth. Both turnover and employment are the criteria used to determine if firms were high-growth enterprises. This release gives a more detailed insight into the contribution of higher performing enterprises to the Irish economy.
A high-growth enterprise is any enterprise with an annualised growth rate of greater than 10% in turnover and/or employment over the three-year period. A very high-growth enterprise had growth greater than 20% per annum. This release also details the contribution of young high-growth enterprises, known as "gazelles", to the Irish business economy. A young enterprise is defined as an enterprise which is less than five years old.
The key facts from this release are:
| Turnover €bn | Gross value added €bn | Number of persons engaged | |
| 2014 | 178.598 | 39.834 | 307176 |
| 2015 | 289.582 | 89.794 | 347015 |
| 2016 | 341.815 | 98.648 | 466022 |
| 2017 | 321.508 | 103.087 | 448624 |
| Table 1 High-growth enterprises, persons engaged, turnover and gross value added, 2014 - 2017 | |||||
| 2014 | 2015 | 2016 | 2017 | ||
| High-growth enterprises | No. | 5,338 | 5,556 | 8,052 | 6,967 |
| Persons engaged | No. | 307,176 | 347,015 | 466,022 | 448,624 |
| Turnover | €m | 178,598 | 289,582 | 341,815 | 321,508 |
| Gross value added | €m | 39,834 | 89,794 | 98,648 | 103,087 |
| High-growth in employment | No. | 631 | 809 | 717 | 1,026 |
| Persons engaged | No. | 42,034 | 47,511 | 58,590 | 71,171 |
| Turnover | €m | 14,859 | 14,015 | 16,389 | 24,190 |
| Gross value added | €m | 4,025 | 3,641 | 3,777 | 4,512 |
| High-growth in turnover | No. | 3,146 | 2,809 | 4,814 | 3,585 |
| Persons engaged | No. | 137,026 | 138,887 | 207,344 | 181,221 |
| Turnover | €m | 99,114 | 106,098 | 143,117 | 138,161 |
| Gross value added | €m | 25,662 | 28,872 | 37,460 | 35,460 |
| High-growth in employment and turnover | No. | 1,561 | 1,938 | 2,521 | 2,356 |
| Persons engaged | No. | 128,116 | 160,617 | 200,088 | 196,232 |
| Turnover | €m | 64,625 | 169,470 | 182,309 | 159,157 |
| Gross value added | €m | 10,146 | 57,281 | 57,412 | 63,114 |
| Rate of high-growth enterprises | |
| Industry | 41.8 |
| Construction | 62.1 |
| Distribution | 41.3 |
| Services | 40.4 |
| Table 2 High-growth enterprises with 10 or more employees in the base year by sector, 2017 | ||||||
| Industry | Construction | Distribution | Services | Total | ||
| High-growth enterprises | No. | 903 | 658 | 2,241 | 3,165 | 6,967 |
| Persons engaged | No. | 96,052 | 29,562 | 96,136 | 226,874 | 448,624 |
| Turnover | €m | 155,140 | 6,607 | 74,507 | 85,255 | 321,508 |
| Gross value added | €m | 75,869 | 2,359 | 7,829 | 17,031 | 103,087 |
| Enterprises active for at least three years1 | No. | 2,159 | 1,060 | 5,430 | 7,828 | 16,477 |
| Rate of high-growth enterprises | % | 41.8 | 62.1 | 41.3 | 40.4 | 42.3 |
| 1Enterprises that were active for at least three years before the reference year and with 10 or more employees in the base year | ||||||
| Turnover | Gross value added | |
| Modern | 190.692 | 76.062 |
| Traditional | 130.816 | 27.025 |
| Total | 321.508 | 103.087 |
| Table 3 High-growth enterprises with 10 or more employees in the base year by modern and traditional sector, 2017 | ||||
| Modern | Traditional | Total | ||
| High-growth enterprises | No. | 539 | 6,428 | 6,967 |
| Persons engaged | No. | 82,540 | 366,084 | 448,624 |
| Turnover | €m | 190,692 | 130,816 | 321,508 |
| Gross value added | €m | 76,062 | 27,025 | 103,087 |
| Enterprises active for at least three years1 | No. | 1,211 | 15,266 | 16,477 |
| Rate of high-growth enterprises | % | 44.5 | 42.1 | 42.3 |
| 1Enterprises that were active for at least three years before the reference year and with 10 or more employees in the base year | ||||
| Rate of high-growth enterprises | |
| Micro (<10) | 9.3 |
| Small (10-49) | 44.1 |
| Medium (50-249) | 52.2 |
| SMEs (<250) | 42 |
| Large (250+) | 50.7 |
| Table 4 High-growth enterprises with 10 or more employees in the base year by size class, 2017 | |||||||
| Micro (<10) | Small (10-49) | Medium (50-249) | SMEs (>250) | Large (250+) | Total | ||
| High-growth enterprises | No. | 150 | 5,123 | 1,425 | 6,698 | 269 | 6,967 |
| Persons engaged | No. | 1,056 | 119,008 | 137,909 | 257,973 | 190,651 | 448,624 |
| Turnover | €m | 1,633 | 53,922 | 51,414 | 106,969 | 214,540 | 321,508 |
| Gross value added | €m | 244 | 7,910 | 11,054 | 19,208 | 83,879 | 103,087 |
| Enterprises active for at least three years | No. | 1,610 | 11,604 | 2,732 | 15,946 | 531 | 16,477 |
| Rate of high-growth enterprises | % | 9.3 | 44.1 | 52.2 | 42.0 | 50.7 | 42.3 |
| Table 5 High-growth enterprises with 10 or more employees in the base year by region (NUTS3), 2017 | |||||||||||
| Border | Dublin | Mid-East | Mid-West | Midlands | South-East | South-West | West | Outside the State1 | Total | ||
| High-growth enterprises | No. | 525 | 2,686 | 831 | 567 | 312 | 532 | 928 | 530 | 56 | 6,967 |
| Persons engaged | No. | 25,561 | 218,457 | 42,921 | 30,614 | 13,342 | 27,875 | 57,095 | 30,168 | 2,591 | 448,624 |
| Turnover | €m | 10,158 | 141,499 | 20,135 | 18,891 | 3,363 | 8,784 | 104,841 | 12,429 | 1,408 | 321,508 |
| Gross value added | €m | 1,868 | 24,713 | 7,535 | 7,122 | 774 | 2,531 | 54,677 | 3,524 | 343 | 103,087 |
| Enterprises active for at least three years | No. | 1,277 | 5,992 | 1,954 | 1,414 | 711 | 1,317 | 2,310 | 1,387 | 115 | 16,477 |
| Rate of high-growth enterprises | % | 41.1 | 44.8 | 42.5 | 40.1 | 43.9 | 40.4 | 40.2 | 38.2 | 48.7 | 42.3 |
| 1See Background Notes for information on enterprises Outside the State | |||||||||||
| Turnover | Gross value added | |
| Domestic | 90.215 | 20.917 |
| Foreign | 231.294 | 82.17 |
| Total | 321.508 | 103.087 |
| Table 6 High-growth enterprises with 10 or more employees in the base year by domestic and foreign ownership, 2017 | ||||
| Domestic | Foreign | Total | ||
| High-growth enterprises | No. | 6,171 | 796 | 6,967 |
| Persons engaged | No. | 306,718 | 141,906 | 448,624 |
| Turnover | €m | 90,215 | 231,294 | 321,508 |
| Gross value added | €m | 20,917 | 82,170 | 103,087 |
| Enterprises active for at least three years | No. | 14,566 | 1,911 | 16,477 |
| Rate of high-growth enterprises | % | 42.4 | 41.7 | 42.3 |
| High-growth (Gross value added €m) | Non-high-growth (Gross value added €m) | High-growth (Labour productivity €) | Non-high-growth (Labour productivity €) | |
| 2014 | 1066 | 598 | 45195 | 32207 |
| 2015 | 1234 | 635 | 47597 | 33237 |
| 2016 | 1202 | 684 | 54252 | 36531 |
| 2017 | 1306 | 625 | 51803 | 33314 |
| Table 7 Median enterprise statistics by performance type, 2014 - 2017 | |||||
| 2014 | 2015 | 2016 | 2017 | ||
| Enterprises | |||||
| High-growth enterprises | No. | 5,338 | 5,556 | 8,052 | 6,967 |
| Non-high-growth enterprises | No. | 9,833 | 9,674 | 7,567 | 9,510 |
| Persons engaged | |||||
| High-growth enterprises | No. | 24 | 26 | 23 | 25 |
| Non-high-growth enterprises | No. | 17 | 17 | 18 | 17 |
| Turnover | |||||
| High-growth enterprises | €'000 | 3,869 | 4,286 | 4,626 | 5,097 |
| Non-high-growth enterprises | €'000 | 2,040 | 1,965 | 2,411 | 2,071 |
| Gross value added | |||||
| High-growth enterprises | €'000 | 1,066 | 1,234 | 1,202 | 1,306 |
| Non-high-growth enterprises | €'000 | 598 | 635 | 684 | 625 |
| Labour productivity | |||||
| High-growth enterprises | € | 45,195 | 47,597 | 54,252 | 51,803 |
| Non-high-growth enterprises | € | 32,207 | 33,237 | 36,531 | 33,314 |
| Non-high-growth enterprises | High-growth in turnover | High-growth in employment | High-growth in both | Rate of Gazelles (%) | |
| 2014 | 443 | 155 | 48 | 186 | 46.8 |
| 2015 | 463 | 119 | 72 | 222 | 47.1 |
| 2016 | 381 | 208 | 47 | 259 | 57.4 |
| 2017 | 501 | 128 | 87 | 236 | 47.4 |
| Turnover €bn | Gross value added €bn | Number of persons engaged | |
| 2014 | 6.002 | 1.231 | 18037 |
| 2015 | 4.997 | 1.531 | 18808 |
| 2016 | 12.267 | 1.563 | 27691 |
| 2017 | 13.336 | 4.023 | 27090 |
| Table 8 Gazelle enterprises with 10 or more employees in the base year, persons engaged, turnover and gross value added, 2014 - 2017 | |||||
| 2014 | 2015 | 2016 | 2017 | ||
| Gazelle enterprises | No. | 389 | 413 | 514 | 451 |
| Turnover growth | No. | 155 | 119 | 208 | 128 |
| Employment growth | No. | 48 | 72 | 47 | 87 |
| Turnover and employment growth | No. | 186 | 222 | 259 | 236 |
| Persons engaged | No. | 18,037 | 18,808 | 27,691 | 27,090 |
| Turnover | €m | 6,002 | 4,997 | 12,267 | 13,336 |
| Gross value added | €m | 1,231 | 1,531 | 1,563 | 4,023 |
| Non-high-growth enterprises | No. | 443 | 463 | 381 | 501 |
| Young enterprises active for at least three years1 | No. | 832 | 876 | 895 | 952 |
| Rate of Gazelle enterprises | No. | 46.8 | 47.1 | 57.4 | 47.4 |
| 1Young Enterprises that are less than five years old and active for at least three years from the reference year with 10 or more employees in the base year | |||||
| Turnover | Employment | Turnover and employment | |
| 2014 | 2114 | 225 | 491 |
| 2015 | 1973 | 269 | 661 |
| 2016 | 3567 | 275 | 831 |
| 2017 | 2701 | 360 | 764 |
| Table 9 Very high-growth enterprises with 10 or more employees in the base year, 2014 - 2017 | |||||
| 2014 | 2015 | 2016 | 2017 | ||
| Very high-growth enterprises | No. | 2,830 | 2,903 | 4,673 | 3,825 |
| Turnover | No. | 2,114 | 1,973 | 3,567 | 2,701 |
| Employment | No. | 225 | 269 | 275 | 360 |
| Turnover and employment | No. | 491 | 661 | 831 | 764 |
| Non-very high-growth enterprises | No. | 12,341 | 12,327 | 10,946 | 12,652 |
| Enterprises active for at least three years1 | No. | 15,171 | 15,230 | 15,619 | 16,477 |
| Rate of very high-growth enterprises | % | 18.7 | 19.1 | 29.9 | 23.2 |
| 1Enterprises that were active for at least three years before the reference year and with 10 or more employees in the base year | |||||
| Turnover €bn | Gross value added €bn | Number of persons engaged | |
| 2014 | 98.123 | 17.920 | 171956 |
| 2015 | 197.580 | 63.244 | 193832 |
| 2016 | 229.242 | 67.517 | 260771 |
| 2017 | 222.863 | 84.166 | 246260 |
| Table 10 Very high-growth enterprises, persons engaged, turnover and gross value added, 2014 - 2017 | |||||
| 2014 | 2015 | 2016 | 2017 | ||
| Very high-growth enterprises | No. | 2,830 | 2,903 | 4,673 | 3,825 |
| Persons engaged | No. | 171,956 | 193,832 | 260,771 | 246,260 |
| Turnover | €m | 98,123 | 197,580 | 229,242 | 222,863 |
| Gross value added | €m | 17,920 | 63,244 | 67,517 | 84,166 |
| Very high-growth in employment | No. | 225 | 269 | 275 | 360 |
| Persons engaged | No. | 16,572 | 27,831 | 26,253 | 29,283 |
| Turnover | €m | 5,501 | 7,248 | 4,922 | 4,980 |
| Gross value added | €m | 1,403 | 2,102 | 1,477 | 1,690 |
| Very high-growth in turnover | No. | 2,114 | 1,973 | 3,567 | 2,701 |
| Persons engaged | No. | 102,613 | 104,884 | 154,473 | 141,212 |
| Turnover | €m | 80,120 | 173,236 | 180,739 | 165,371 |
| Gross value added | €m | 13,168 | 56,700 | 56,784 | 67,980 |
| Very high-growth in employment and turnover | No. | 491 | 661 | 831 | 764 |
| Persons engaged | No. | 52,771 | 61,117 | 80,045 | 75,765 |
| Turnover | €m | 12,503 | 17,096 | 43,581 | 52,512 |
| Gross value added | €m | 3,349 | 4,442 | 9,256 | 14,497 |
A high-growth enterprise is any enterprise with an annualised growth rate greater than 10% over a three-year period. This in practice means a growth rate of 33.1% from the beginning of the three-year period to the reference year. For this release growth has been measured in turnover and/or employment. A threshold of 10 employees at the beginning of the three-year period is set to avoid micro enterprises distorting the results.
In this release, enterprises need to have been active for at least three years before the reference year and have 10 or more employees at the beginning of the three-year period. This ensures that non-high-growth enterprise figures are not distorted by enterprises that could never meet the definition of a high-growth enterprise.
A Gazelle is a high-growth enterprise that is less than five years old. Considering that an enterprise needs three full years of annualised growth this in effect means that Gazelles are either four or five years old during the reference year.
In this release, young enterprises are all four and five-year-old enterprises during the reference year that had 10 or more employees at the beginning of the three-year period. This ensures that non-Gazelle figures are not distorted by young enterprises that could never meet the definition of a Gazelle.
A very high-growth enterprise is any enterprise with an annualised growth rate greater than 20% over a three-year period. This in practice means a growth rate of 72.8% from the beginning of the three-year period to the reference year. For this release growth has been measured in turnover and/or employment. A threshold of 10 employees at the beginning of the three-year period is set to avoid micro enterprises distorting the results.
Persons engaged is the sum of employees and working proprietors. Employees are persons who are paid a fixed wage or salary, this would include self-employed individuals who pay themselves a working wage. Working proprietors include proprietors, partners and family members who work in the firm but are not paid a definite wage or salary.
Turnover comprises the totals invoiced by the enterprise during the reference period, and this corresponds to market sales of goods or services supplied to third parties.
Gross value added (GVA) provides a monetary value for goods and services that have been produced by the enterprise minus the cost of raw materials and other inputs used in production.
Labour productivity in this release measures output relative to the number of persons engaged in the enterprise. It is calculated as Gross Value Added divided by persons engaged. This measure of labour productivity does not consider the differences in hours worked. For more information on the different measures of labour productivity see the appendix in Productivity in Ireland 2017.
Enterprises that are less than three years old in the given reference year are excluded from the population from which high-growth enterprises are identified. Enterprises that are three years old are excluded because they were born at different points throughout the year and would not have a full year’s worth of turnover in the base year.
Enterprises that merged or were part of a takeover during the three-year growth period are not considered high-growth enterprises.
The following table illustrates how applying the criteria for identifying a high-growth enterprise reduces the population in the release. In 2017, there were 283,244 enterprises in the Structural Business Statistics (SBS) series. Of these enterprises, 186,943 were active during the three-year growth period. Of the 186,943 enterprises, 16,477 had 10 or more employees during the base year.
| 2017 | Number of enterprises |
|---|---|
| SBS enterprises | 283,244 |
| Less than 3 active years during growth period | 96,301 |
| Three or more years active during growth period | 186,943 |
| Of which; | |
| Less than 10 employees during base year | 170,466 |
| 10 or more employees during base year | 16,477 |
Census of Industrial Production
The CIP covers all enterprises which are wholly or principally involved in industrial production. The CIP is a census of all enterprises with three or more persons engaged with the remaining enterprises and non-respondents taken from administrative sources in sectors B-E of NACE Rev.2.
For further information, please see the CIP background notes below:
Census of Industrial Production
Annual Services Inquiry
The ASI has been conducted as an annual survey of both distributive and non-distributive services. The ASI is a census of all enterprises with 20+ persons engaged and a stratified random sample of enterprises with 2-19 persons engaged. The remaining enterprises and non-respondents have data taken from administrative source. The ASI covers sectors G-N excluding K and including divisions 92,93,95 and 96 of NACE Rev.2.
For further information, please see the ASI background notes below:
Building and Construction Inquiry
The BCI was introduced in 2009 for reference year 2008 onwards and replaced the Census of Building and Construction (CBC). The BCI is an annual census of enterprises with 10 or more persons engaged and a sample of enterprises with less than 10 persons engaged. The remaining enterprises and non-respondents are imputed from administrative sources. The BCI covers sector F of NACE Rev.2.
For further information, please see the BCI background notes below:
Building and Construction Inquiry
The figures in this release on High-Growth Enterprises are not directly comparable to the high-growth enterprise statistics produced by Eurostat. This is because the high-growth enterprise figures in Eurostat are from the Business Demography population which covers NACE sectors B - N (excluding K64.20 Activities of holding companies) while this release looks at high-growth enterprises in the Business Operations population which covers NACE sectors B – J and L – N as well as the productive sectors of NACE Sectors R and S (R92, R93, S95 and S96).
NACE Rev. 2 Classification
NACE Rev. 2 is the statistical classification of economic activities. NACE is an acronym for ‘Nomenclature Généraile des Activités Économiques dans les Communautés Européenes’ (General Industrial Classification of Economic Activities within the European Communities). The following are NACE classifications for Sector and Modern and Traditional Sectors are as follows:
Sector
| Sector | NACE Rev. 2 Codes |
| Industry | 05-33, 35-39 |
| Construction | 41-43 |
| Distribution | 45-47 |
| Services | 49-53, 55-56, 58-63, 68-75, 77-82, 92-93, 95-96 |
Modern and Traditional Sectors
| Sector | NACE Rev. 2 Codes |
| Modern | 18, 20-21, 26-27, 3250, 58-59, 61-63 |
| Traditional | All other NACE Rev. 2 categories |
Size Class
| Size Class | Number of Persons Engaged |
| Micro | 0 - 9 |
| Small | 10 - 49 |
| Medium | 50 - 249 |
| SMEs | 0 - 249 |
| Large | 250+ |
Region
All regional breakdowns described in this release in line with Eurostat’s Nomenclature of Territorial Units for Statistics (NUTS). The categorisation used is at NUTS 3 level, and can be described as follows:
| NUTS 3 Region | County |
| Border |
Donegal |
| Sligo | |
| Leitrim | |
| Cavan | |
| Monaghan | |
| West | Galway |
| Mayo | |
| Roscommon | |
| Mid-West | Clare |
| Tipperary | |
| Limerick | |
| South-East | Waterford |
| Kilkenny | |
| Carlow | |
| Wexford | |
| South-West | Cork |
| Kerry | |
| Dublin | Dublin |
| Mid-East | Wicklow |
| Kildare | |
| Meath | |
| Louth | |
| Midlands | Longford |
| Westmeath | |
| Offaly | |
| Laois |
Note: The geographical breakdown for enterprises is an approximation. The county breakdown is based on the address at which an enterprise is registered for Revenue purposes rather than where the business operates from, because no comprehensive administrative data source is currently available for business locations.
Enterprises where the region location is categorised as "Outside the State" generally have Revenue registered addresses outside of the Republic of Ireland but are active on Revenue within the Republic of Ireland. Enterprise information is sourced from Revenue registrations and Revenue activity. The address given at registration with Revenue is the registered address used in the Central Business Register unless amended at a later date due to enterprise profiling activities within the CSO. In some cases, these registered addresses may be outside the Republic of Ireland but they are counted as active within the Republic of Ireland due to either employment, income tax or corporation tax returns.
Type of Ownership
The type of ownership of an enterprise identifies whether an enterprise is domestic or foreign controlled. A domestic enterprise is defined as either domestic indigenous or domestic multinational (with foreign control of less than 50%). A foreign controlled enterprise is defined as having foreign control of more than 50%.
| Type of Ownership | Control (%) |
| Domestic | Enterprises with foreign control <= 50% |
| Foreign | Enterprises with foreign control > 50% |
 Hide Background Notes
Scan the QR code below to view this release online or go to
http://www.cso.ie/en/releasesandpublications/er/hge/highgrowthenterprises2017/
 Show Table 1 High-growth enterprises' persons engaged, turnover and gross value added, 2014 - 2017
 Hide Table 1 High-growth enterprises' persons engaged, turnover and gross value added, 2014 - 2017