
| Number of HSE funded dental treatments, 2013 - 2014 | ||||
| '000s of treatments | ||||
| Gender | 2013 | 2014 | 2015 | 2016 |
| Male | 556.6 | 616.4 | 555.9 | 459.1 |
| Female | 670.4 | 744.6 | 676.4 | 566.5 |
| State Total | 1,227.0 | 1,361.0 | 1,232.3 | 1,025.6 |
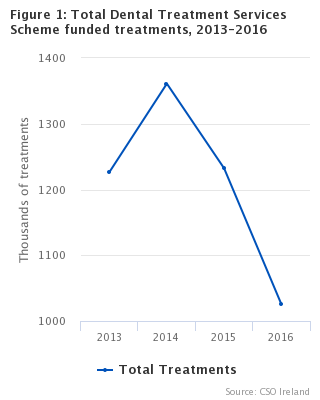
The number of Health Service Executive (HSE) funded treatments under the Dental Treatment Services Scheme (DTSS) fell from 1,227.0 thousand in 2013 to 1,025.6 thousand in 2016, a 16.4% reduction.
These payments were paid for by the Primary Care Reimbursement Service (PCRS). Please see background notes for a further description of the PCSR and DTSS.
Summary Points
| Curative | Preventative | Miscellaneous | Total | |
| 2013 | 676.538 | 416.262 | 134.211 | 1227.011 |
| 2014 | 752.519 | 457.467 | 150.972 | 1360.958 |
| 2015 | 678.152 | 423.365 | 130.694 | 1232.211 |
| 2016 | 545.516 | 374.074 | 105.939 | 1025.529 |
The total number of curative treatments in 2016, at 545.5 thousand, is higher than the combined total of 480.1 thousand for preventative and miscellaneous treatments. The corresponding figures for 2013 are 676.5 thousand and 550.5 thousand respectively. See Table 5 and Figure 2.
Curative treatments were carried out on females than on males in 2016, with 288.8 thousand and 256.7 procedures being carried out respectively. This is a reduction since 2013, when the corresponding figures were 354.5 thousand and 322.0 thousand respectively.
The region with the most curative treatments in 2016 was the South where 169.2 thousand treatments were carried out. Dublin North-East had with the lowest number of curative treatments that year, with a total of 107.2 thousand curative treatments.
The average cost of a dental treatment fell from €52.83 to €51.04 per treatment in the years from 2013 to 2016. See Table 6.
| 2013 | 2014 | 2015 | 2016 | |
| 0 - 24 years | 41.5 | 41.24 | 41.11 | 40.75 |
| 25 - 34 years | 43.33 | 43.12 | 43.03 | 42.26 |
| 35 - 44 years | 46.64 | 46.62 | 46.39 | 45.1 |
| 45 - 54 years | 51.58 | 51.69 | 51.01 | 48.88 |
| 55 - 64 years | 60.55 | 60.34 | 59.5 | 55.72 |
| 65 - 74 years | 66.77 | 67.86 | 66.87 | 61.68 |
| 75 years and over | 69.2 | 71.32 | 71.05 | 65.54 |
The average cost per treatment in 2016 was higher for males at €51.91 than for females at €50.33. Both of these figures have fallen since 2013, when the average cost per treatment for a male was €53.46 and €52.31 for a female.
A treatment for the an individual aged 75 years and older was on average 66.7% higher than a treatment for an individual in the 0-24 years age group in 2013. The difference has fallen, with the cost of a treatment being 60.8% higher for individuals in the 75 years and older cohort than the 0-24 age cohort in 2016. See Figure 3.
In 2016, the average cost of a treatment was highest in the Dublin Mid-Leinster region at €51.66.
| Table 1: Number of above and below the line procedures by gender, age group and local health office region, 2013-2016 | ||||||||||||||||
| '000s of procedures | ||||||||||||||||
| 2013 | 2014 | 2015 | 2016 | |||||||||||||
| Above the line | Below the line | Total | Above the line | Below the line | Total | Above the line | Below the line | Total | Above the line | Below the line | Total | |||||
| State | ||||||||||||||||
| Total | 1,166.8 | 60.2 | 1,227.0 | 1,290.8 | 70.1 | 1,361.0 | 1,168.3 | 63.9 | 1,232.3 | 980.0 | 45.5 | 1,025.6 | ||||
| Gender | ||||||||||||||||
| Male | 528.3 | 28.3 | 556.6 | 583.2 | 33.2 | 616.4 | 525.9 | 30.0 | 555.9 | 437.5 | 21.6 | 459.1 | ||||
| Female | 638.5 | 31.9 | 670.4 | 707.6 | 36.9 | 744.6 | 642.4 | 33.9 | 676.4 | 542.5 | 23.9 | 566.5 | ||||
| Age Group | ||||||||||||||||
| 0 - 24 years | 164.7 | 2.2 | 166.9 | 180.1 | 2.3 | 182.4 | 154.5 | 1.9 | 156.4 | 118.9 | 1.3 | 120.2 | ||||
| 25 - 34 years | 212.5 | 4.4 | 216.9 | 221.3 | 4.6 | 225.9 | 187.4 | 4.0 | 191.5 | 149.4 | 2.7 | 152.1 | ||||
| 35 - 44 years | 206.3 | 6.8 | 213.2 | 226.2 | 7.7 | 233.9 | 203.9 | 6.9 | 210.8 | 166.6 | 4.8 | 171.3 | ||||
| 45 - 54 years | 177.2 | 9.2 | 186.5 | 202.4 | 10.9 | 213.3 | 188.0 | 9.7 | 197.8 | 160.3 | 6.9 | 167.3 | ||||
| 55 - 64 years | 146.6 | 12.0 | 158.6 | 169.0 | 14.0 | 183.0 | 160.8 | 13.0 | 173.8 | 140.8 | 9.3 | 150.1 | ||||
| 65 - 74 years | 144.8 | 14.0 | 158.8 | 166.4 | 17.0 | 183.5 | 158.2 | 15.8 | 173.9 | 141.0 | 11.4 | 152.4 | ||||
| 75 years and over | 114.7 | 11.5 | 126.1 | 125.4 | 13.6 | 139.0 | 115.5 | 12.6 | 128.1 | 103.1 | 9.1 | 112.2 | ||||
| Local Health Office Region | ||||||||||||||||
| Dublin Mid-Leinster | 277.5 | 14.5 | 292.0 | 306.1 | 16.8 | 322.9 | 277.5 | 15.1 | 292.6 | 231.1 | 10.9 | 242.0 | ||||
| Dublin North East | 236.5 | 11.0 | 247.5 | 262.4 | 13.0 | 275.4 | 233.4 | 11.8 | 245.2 | 198.1 | 8.3 | 206.4 | ||||
| West | 303.7 | 15.9 | 319.6 | 337.3 | 18.6 | 355.8 | 304.2 | 16.5 | 320.8 | 253.6 | 11.4 | 265.0 | ||||
| South | 349.1 | 18.8 | 367.9 | 385.0 | 21.8 | 406.8 | 353.1 | 20.4 | 373.6 | 297.2 | 14.9 | 312.1 | ||||
| Table 2: Total number and percentage of procedures by treatment description, 2013-2016 | |||||||||||
| 2013 | 2014 | 2015 | 2016 | ||||||||
| '000s | % | '000s | % | '000s | % | '000s | % | ||||
| Treatment Description | |||||||||||
| 1st stage Endodontics | 8.2 | 0.7 | 8.7 | 0.6 | 7.5 | 0.6 | 5.6 | 0.6 | |||
| Apicectomy / amputation of roots | 0.1 | <0.5 | 0.1 | <0.5 | 0.1 | <0.5 | 0.1 | <0.5 | |||
| Denture repairs | 33.4 | 2.7 | 38.4 | 2.8 | 36.1 | 2.8 | 31.8 | 3.1 | |||
| Endodontics | 6.8 | 0.6 | 7.3 | 0.5 | 6.3 | 0.5 | 4.5 | 0.4 | |||
| Exodontics | 119.3 | 9.7 | 132.7 | 9.8 | 121.9 | 9.8 | 102.0 | 9.9 | |||
| Miscellaneus | 134.2 | 10.9 | 151.0 | 11.1 | 130.7 | 11.1 | 105.9 | 10.3 | |||
| Oral examination | 410.3 | 33.4 | 450.0 | 33.1 | 414.9 | 33.1 | 366.1 | 35.7 | |||
| Prophylaxis | 6.0 | 0.5 | 7.5 | 0.6 | 8.5 | 0.6 | 7.9 | 0.8 | |||
| Prosthetics | 44.0 | 3.6 | 51.2 | 3.8 | 46.0 | 3.8 | 32.0 | 3.1 | |||
| Protracted periodontal treatment | 9.3 | 0.8 | 11.6 | 0.9 | 11.5 | 0.9 | 9.0 | 0.9 | |||
| Restoration using amalgam filling | 263.1 | 21.4 | 287.7 | 21.1 | 256.0 | 21.1 | 204.5 | 19.9 | |||
| Restoration using composite filling | 133.5 | 10.9 | 148.9 | 10.9 | 137.3 | 10.9 | 112.6 | 11.0 | |||
| Surgical extractions | 58.9 | 4.8 | 66.0 | 4.9 | 55.5 | 4.9 | 43.5 | 4.2 | |||
| Total Treatments | 1,227.0 | 100.0 | 1,361.0 | 100.0 | 1,232.2 | 100.0 | 1,025.5 | 100.0 | |||
| Table 3: Number of detailed dental treatments, by gender, age group and Local Health Office region, 2013-2016 | |||||||||||||||
| '000s of treatments | |||||||||||||||
| 1st Stage Endodontics | Endodontics | Denture Repairs | Exodontics | Miscellaneous | Oral Examination | Prophylaxis | Prosthetics | Protracted Periodontal Treatment | Restoration using Amalgam Filling | Restoration using Composite Filling | Surgical Extraction | Total Treatments | |||
| Gender | |||||||||||||||
| Male | 2013 | 4.1 | 3.5 | 15.2 | 61.9 | 56.1 | 175.8 | 2.8 | 20.3 | 4.5 | 119.1 | 62.9 | 30.5 | 556.6 | |
| 2014 | 4.5 | 3.8 | 17.9 | 68.5 | 62.9 | 192.5 | 3.6 | 23.7 | 5.8 | 129.5 | 69.9 | 34.0 | 616.4 | ||
| 2015 | 3.7 | 3.2 | 16.6 | 62.4 | 54.2 | 177.2 | 4.1 | 21.1 | 5.7 | 114.7 | 64.1 | 28.9 | 555.9 | ||
| 2016 | 2.8 | 2.2 | 14.9 | 51.6 | 43.5 | 155.1 | 3.8 | 14.8 | 4.5 | 91.1 | 52.5 | 22.3 | 459.1 | ||
| Female | 2013 | 4.0 | 3.5 | 18.3 | 57.4 | 78.1 | 234.5 | 3.2 | 23.6 | 4.8 | 144.0 | 70.5 | 28.4 | 670.4 | |
| 2014 | 4.2 | 3.6 | 20.5 | 64.2 | 88.1 | 257.5 | 3.9 | 27.5 | 5.9 | 158.2 | 79.0 | 31.9 | 744.6 | ||
| 2015 | 3.8 | 3.2 | 19.4 | 59.5 | 76.5 | 237.7 | 4.4 | 24.9 | 5.8 | 141.3 | 73.2 | 26.6 | 676.4 | ||
| 2016 | 2.8 | 2.3 | 16.9 | 50.4 | 62.5 | 211.1 | 4.1 | 17.2 | 4.4 | 113.4 | 60.1 | 21.2 | 566.5 | ||
| Age Group | |||||||||||||||
| 0 - 24 years | 2013 | 1.3 | 1.1 | 0.2 | 9.8 | 23.5 | 59.5 | 0.4 | 0.6 | 0.6 | 50.1 | 12.5 | 7.5 | 166.9 | |
| 2014 | 1.3 | 1.1 | 0.2 | 10.7 | 26.2 | 65.7 | 0.5 | 0.6 | 0.6 | 54.2 | 13.3 | 8.0 | 182.4 | ||
| 2015 | 1.1 | 0.9 | 0.2 | 9.4 | 21.4 | 58.1 | 0.5 | 0.4 | 0.5 | 46.0 | 11.3 | 6.4 | 156.4 | ||
| 2016 | 0.7 | 0.6 | 0.1 | 7.5 | 16.2 | 46.6 | 0.5 | 0.3 | 0.4 | 34.4 | 8.3 | 4.6 | 120.2 | ||
| 25 - 34 years | 2013 | 1.5 | 1.3 | 0.8 | 16.5 | 29.6 | 73.3 | 0.7 | 2.0 | 1.2 | 59.7 | 17.8 | 12.7 | 216.9 | |
| 2014 | 1.5 | 1.2 | 0.9 | 16.6 | 31.8 | 76.2 | 1.0 | 2.0 | 1.4 | 61.9 | 18.2 | 13.2 | 225.9 | ||
| 2015 | 1.2 | 1.0 | 0.8 | 14.0 | 26.5 | 66.1 | 1.0 | 1.7 | 1.3 | 51.8 | 15.7 | 10.4 | 191.5 | ||
| 2016 | 0.8 | 0.7 | 0.7 | 11.6 | 21.0 | 55.1 | 0.8 | 1.1 | 0.9 | 39.3 | 11.9 | 8.1 | 152.1 | ||
| 35 - 44 years | 2013 | 1.5 | 1.3 | 2.3 | 19.1 | 25.3 | 71.3 | 0.7 | 4.2 | 1.4 | 54.0 | 20.3 | 11.8 | 213.2 | |
| 2014 | 1.5 | 1.3 | 2.6 | 21.4 | 28.3 | 77.5 | 1.0 | 4.6 | 1.7 | 58.5 | 22.6 | 12.7 | 233.9 | ||
| 2015 | 1.3 | 1.1 | 2.4 | 19.3 | 25.6 | 70.8 | 1.1 | 4.1 | 1.7 | 51.9 | 20.5 | 10.9 | 210.8 | ||
| 2016 | 1.0 | 0.8 | 2.0 | 15.0 | 20.5 | 61.5 | 1.0 | 2.7 | 1.3 | 41.2 | 16.0 | 8.4 | 171.3 | ||
| 45 - 54 years | 2013 | 1.2 | 1.1 | 4.2 | 22.3 | 20.2 | 60.0 | 0.8 | 6.5 | 1.6 | 39.0 | 20.4 | 9.2 | 186.5 | |
| 2014 | 1.4 | 1.2 | 5.1 | 25.0 | 23.3 | 67.9 | 1.2 | 7.5 | 2.2 | 44.6 | 22.7 | 11.1 | 213.3 | ||
| 2015 | 1.2 | 1.0 | 4.7 | 23.3 | 20.7 | 64.4 | 1.4 | 6.5 | 2.2 | 41.5 | 21.4 | 9.4 | 197.8 | ||
| 2016 | 0.9 | 0.8 | 4.2 | 19.4 | 17.4 | 58.1 | 1.2 | 4.5 | 1.7 | 34.1 | 17.5 | 7.4 | 167.3 | ||
| 55 - 64 years | 2013 | 1.1 | 0.9 | 6.7 | 20.7 | 14.2 | 49.5 | 0.9 | 9.3 | 1.9 | 25.6 | 20.7 | 7.1 | 158.6 | |
| 2014 | 1.1 | 1.0 | 8.1 | 23.6 | 16.6 | 56.5 | 1.2 | 10.7 | 2.4 | 29.6 | 23.9 | 8.4 | 183.0 | ||
| 2015 | 1.0 | 0.9 | 7.6 | 22.3 | 15.3 | 54.8 | 1.5 | 9.7 | 2.4 | 28.3 | 22.6 | 7.2 | 173.8 | ||
| 2016 | 0.8 | 0.7 | 6.6 | 19.3 | 13.1 | 50.5 | 1.5 | 6.7 | 1.9 | 24.0 | 18.9 | 6.1 | 150.1 | ||
| 65 - 74 years | 2013 | 1.0 | 0.8 | 9.0 | 18.2 | 12.1 | 52.2 | 1.0 | 11.5 | 1.6 | 21.6 | 23.8 | 6.0 | 158.8 | |
| 2014 | 1.1 | 0.9 | 10.8 | 20.9 | 14.1 | 59.0 | 1.3 | 14.0 | 2.1 | 24.4 | 27.7 | 7.1 | 183.5 | ||
| 2015 | 1.0 | 0.8 | 10.2 | 19.6 | 12.4 | 56.9 | 1.7 | 12.7 | 2.2 | 23.3 | 26.7 | 6.3 | 173.9 | ||
| 2016 | 0.9 | 0.7 | 9.1 | 17.4 | 10.6 | 53.2 | 1.6 | 9.0 | 1.7 | 19.9 | 23.0 | 5.3 | 152.4 | ||
| 75 years and over | 2013 | 0.7 | 0.5 | 10.3 | 12.6 | 9.3 | 44.6 | 1.4 | 9.9 | 1.0 | 13.1 | 18.1 | 4.7 | 126.1 | |
| 2014 | 0.8 | 0.6 | 10.7 | 14.5 | 10.7 | 47.2 | 1.1 | 11.7 | 1.2 | 14.4 | 20.4 | 5.5 | 139.0 | ||
| 2015 | 0.7 | 0.6 | 10.1 | 13.9 | 8.7 | 43.8 | 1.3 | 10.8 | 1.2 | 13.2 | 19.1 | 4.8 | 128.1 | ||
| 2016 | 0.5 | 0.4 | 9.0 | 11.8 | 7.2 | 41.0 | 1.3 | 7.7 | 1.0 | 11.5 | 16.9 | 3.7 | 112.2 | ||
| Local Health Office Region | |||||||||||||||
| Dublin Mid-Leinster | 2013 | 1.7 | 1.5 | 6.2 | 30.9 | 29.3 | 98.0 | 1.8 | 11.2 | 1.8 | 62.8 | 31.7 | 15.0 | 292.0 | |
| 2014 | 1.9 | 1.6 | 7.1 | 34.8 | 34.2 | 107.4 | 1.9 | 13.0 | 2.2 | 67.6 | 34.9 | 16.3 | 322.9 | ||
| 2015 | 1.6 | 1.4 | 6.8 | 32.3 | 29.0 | 99.4 | 2.3 | 11.7 | 2.1 | 60.1 | 32.2 | 13.8 | 292.6 | ||
| 2016 | 1.2 | 1.0 | 6.2 | 25.7 | 23.2 | 87.3 | 2.2 | 8.2 | 1.7 | 48.3 | 25.9 | 11.0 | 242.0 | ||
| Dublin North East | 2013 | 1.5 | 1.1 | 7.2 | 22.6 | 32.4 | 81.6 | 1.0 | 8.7 | 1.1 | 51.8 | 24.8 | 13.5 | 247.5 | |
| 2014 | 1.6 | 1.2 | 8.0 | 25.1 | 38.1 | 89.2 | 1.2 | 10.4 | 1.4 | 56.1 | 28.0 | 15.2 | 275.4 | ||
| 2015 | 1.4 | 1.0 | 7.9 | 22.6 | 32.9 | 80.0 | 1.2 | 9.2 | 1.6 | 48.9 | 25.9 | 12.6 | 245.2 | ||
| 2016 | 1.1 | 0.7 | 7.0 | 19.4 | 26.8 | 71.3 | 1.2 | 6.3 | 1.3 | 39.7 | 21.5 | 10.2 | 206.4 | ||
| West | 2013 | 2.4 | 2.1 | 8.1 | 33.5 | 32.8 | 109.3 | 1.5 | 11.0 | 2.8 | 70.0 | 33.5 | 12.7 | 319.6 | |
| 2014 | 2.5 | 2.2 | 9.4 | 36.2 | 35.9 | 120.8 | 2.0 | 12.7 | 3.6 | 77.7 | 37.9 | 14.8 | 355.8 | ||
| 2015 | 2.1 | 1.9 | 8.6 | 32.5 | 31.5 | 111.4 | 2.3 | 11.4 | 3.2 | 68.5 | 34.7 | 12.6 | 320.8 | ||
| 2016 | 1.5 | 1.3 | 7.9 | 27.7 | 25.4 | 97.8 | 2.0 | 7.8 | 2.3 | 53.5 | 28.3 | 9.5 | 265.0 | ||
| South | 2013 | 2.6 | 2.2 | 11.9 | 32.3 | 39.7 | 121.4 | 1.6 | 13.0 | 3.6 | 78.4 | 43.4 | 17.7 | 367.9 | |
| 2014 | 2.8 | 2.3 | 13.8 | 36.6 | 42.7 | 132.6 | 2.3 | 15.1 | 4.4 | 86.3 | 48.1 | 19.7 | 406.8 | ||
| 2015 | 2.4 | 2.0 | 12.6 | 34.5 | 37.3 | 124.1 | 2.7 | 13.8 | 4.6 | 78.5 | 44.5 | 16.5 | 373.6 | ||
| 2016 | 1.8 | 1.5 | 10.7 | 29.1 | 30.5 | 109.8 | 2.6 | 9.7 | 3.7 | 63.0 | 36.8 | 12.8 | 312.1 | ||
| Table 4: Number of procedures by mouth position, by gender, age group and local health office region, 2013-2016 | ||||||||||||||||||||||||
| '000s of treatments | ||||||||||||||||||||||||
| 2013 | 2014 | 2015 | 2016 | |||||||||||||||||||||
| Upper Right | Upper Left | Lower Right | Lower Left | Total Treatments | Upper Right | Upper Left | Lower Right | Lower Left | Total Treatments | Upper Right | Upper Left | Lower Right | Lower Left | Total Treatments | Upper Right | Upper Left | Lower Right | Lower Left | Total Treatments | |||||
| State | ||||||||||||||||||||||||
| Total | 168.7 | 168.2 | 123.8 | 122.2 | 583.0 | 185.2 | 184.6 | 137.8 | 136.5 | 644.0 | 166.2 | 165.7 | 123.9 | 122.5 | 578.2 | 135.2 | 134.0 | 100.1 | 99.0 | 468.2 | ||||
| Gender | ||||||||||||||||||||||||
| Male | 80.9 | 80.6 | 58.9 | 58.1 | 278.6 | 88.3 | 88.0 | 65.6 | 64.5 | 306.4 | 79.0 | 78.1 | 58.5 | 58.2 | 273.8 | 63.4 | 63.1 | 47.1 | 46.7 | 220.2 | ||||
| Female | 87.8 | 87.6 | 64.9 | 64.1 | 304.4 | 96.9 | 96.6 | 72.2 | 72.0 | 337.6 | 87.2 | 87.6 | 65.4 | 64.3 | 304.4 | 71.8 | 70.9 | 53.0 | 52.3 | 248.0 | ||||
| Age Group | ||||||||||||||||||||||||
| 0 - 24 years | 24.5 | 24.3 | 16.2 | 16.1 | 81.1 | 26.4 | 26.1 | 17.8 | 17.2 | 87.4 | 22.6 | 22.4 | 14.9 | 14.3 | 74.2 | 16.8 | 16.8 | 11.1 | 10.7 | 55.5 | ||||
| 25 - 34 years | 33.1 | 33.4 | 21.1 | 20.6 | 108.1 | 33.8 | 33.9 | 21.9 | 21.8 | 111.4 | 28.2 | 28.4 | 18.4 | 18.0 | 93.0 | 22.1 | 21.9 | 14.0 | 13.8 | 71.8 | ||||
| 35 - 44 years | 32.5 | 32.8 | 21.1 | 20.3 | 106.7 | 35.5 | 35.7 | 22.9 | 22.7 | 116.7 | 31.5 | 31.8 | 20.4 | 20.2 | 104.0 | 24.8 | 24.7 | 16.0 | 16.0 | 81.5 | ||||
| 45 - 54 years | 27.9 | 27.7 | 18.4 | 18.1 | 92.1 | 31.4 | 31.4 | 21.0 | 21.0 | 104.8 | 29.0 | 28.8 | 19.5 | 19.6 | 96.9 | 23.9 | 23.8 | 15.6 | 16.0 | 79.4 | ||||
| 55 - 64 years | 21.4 | 21.2 | 16.3 | 16.2 | 75.2 | 24.5 | 24.4 | 18.8 | 18.9 | 86.6 | 23.0 | 23.1 | 17.8 | 17.6 | 81.5 | 19.9 | 19.5 | 15.0 | 14.7 | 69.1 | ||||
| 65 - 74 years | 17.9 | 17.6 | 17.6 | 17.5 | 70.5 | 20.9 | 20.5 | 20.0 | 19.8 | 81.2 | 19.9 | 19.7 | 18.7 | 18.7 | 77.0 | 17.5 | 17.2 | 16.1 | 15.7 | 66.5 | ||||
| 75 years and over | 11.5 | 11.3 | 13.1 | 13.3 | 49.1 | 12.7 | 12.5 | 15.3 | 15.2 | 55.7 | 11.9 | 11.5 | 14.2 | 14.1 | 51.7 | 10.2 | 10.1 | 12.2 | 11.9 | 44.4 | ||||
| Local Health Office Region | ||||||||||||||||||||||||
| Dublin Mid-Leinster | 41.5 | 41.0 | 30.0 | 29.6 | 142.1 | 45.0 | 44.6 | 33.3 | 32.4 | 155.4 | 40.6 | 40.4 | 29.8 | 29.2 | 139.9 | 32.3 | 32.2 | 23.9 | 23.8 | 112.1 | ||||
| Dublin North East | 33.3 | 33.1 | 24.3 | 23.7 | 114.3 | 36.2 | 36.4 | 26.7 | 26.6 | 125.9 | 32.0 | 31.9 | 23.9 | 23.6 | 111.4 | 26.7 | 26.2 | 19.7 | 19.3 | 91.9 | ||||
| West | 44.1 | 44.0 | 32.3 | 31.7 | 152.0 | 48.8 | 48.8 | 35.7 | 35.8 | 169.2 | 42.8 | 43.3 | 32.5 | 31.9 | 150.5 | 34.5 | 34.4 | 26.0 | 25.8 | 120.6 | ||||
| South | 49.9 | 50.2 | 37.1 | 37.2 | 174.4 | 55.1 | 54.7 | 42.0 | 41.7 | 193.5 | 50.9 | 50.1 | 37.6 | 37.8 | 176.4 | 41.6 | 41.3 | 30.6 | 30.1 | 143.6 | ||||
| Table 5: Number of curative, preventative, and miscellaneous treatments, by gender, age group and local health office region, 2013-2016 | ||||||||||||||||||||
| '000s of treatments | ||||||||||||||||||||
| 2013 | 2014 | 2015 | 2016 | |||||||||||||||||
| Curative | Preventative | Miscellaneous | Total | Curative | Preventative | Miscellaneous | Total | Curative | Preventative | Miscellaneous | Total | Curative | Preventative | Miscellaneous | Total | |||||
| State | ||||||||||||||||||||
| Total | 676.5 | 416.2 | 134.2 | 1,227.0 | 752.6 | 457.4 | 151.0 | 1,361.0 | 678.1 | 423.3 | 130.7 | 1,232.3 | 545.5 | 374.1 | 106.0 | 1,025.6 | ||||
| Gender | ||||||||||||||||||||
| Male | 322.0 | 178.5 | 56.1 | 556.6 | 357.5 | 196.0 | 62.9 | 616.4 | 320.4 | 181.2 | 54.2 | 555.9 | 256.7 | 158.9 | 43.5 | 459.1 | ||||
| Female | 354.5 | 237.7 | 78.1 | 670.4 | 395.1 | 261.4 | 88.1 | 744.6 | 357.7 | 242.1 | 76.5 | 676.4 | 288.8 | 215.2 | 62.5 | 566.5 | ||||
| Age Group | ||||||||||||||||||||
| 0 - 24 years | 83.5 | 59.8 | 23.5 | 166.9 | 90.0 | 66.2 | 26.2 | 182.4 | 76.4 | 58.6 | 21.4 | 156.4 | 56.9 | 47.1 | 16.2 | 120.2 | ||||
| 25 - 34 years | 113.3 | 74.0 | 29.6 | 216.9 | 116.9 | 77.2 | 31.8 | 225.9 | 97.9 | 67.1 | 26.5 | 191.5 | 75.1 | 55.9 | 21.0 | 152.1 | ||||
| 35 - 44 years | 115.8 | 72.0 | 25.3 | 213.2 | 127.0 | 78.5 | 28.3 | 233.9 | 113.3 | 71.9 | 25.6 | 210.8 | 88.3 | 62.6 | 20.5 | 171.3 | ||||
| 45 - 54 years | 105.5 | 60.8 | 20.2 | 186.5 | 120.9 | 69.1 | 23.3 | 213.3 | 111.3 | 65.7 | 20.7 | 197.8 | 90.5 | 59.3 | 17.4 | 167.3 | ||||
| 55 - 64 years | 94.0 | 50.4 | 14.2 | 158.6 | 108.8 | 57.7 | 16.6 | 183.0 | 102.1 | 56.4 | 15.3 | 173.8 | 85.0 | 52.0 | 13.1 | 150.1 | ||||
| 65 - 74 years | 93.5 | 53.2 | 12.1 | 158.8 | 109.0 | 60.3 | 14.1 | 183.5 | 102.9 | 58.6 | 12.4 | 173.9 | 87.0 | 54.8 | 10.6 | 152.4 | ||||
| 75 years and over | 70.9 | 46.0 | 9.3 | 126.1 | 79.9 | 48.3 | 10.7 | 139.0 | 74.3 | 45.1 | 8.7 | 128.1 | 62.6 | 42.4 | 7.2 | 112.2 | ||||
| Local Health Office Region | ||||||||||||||||||||
| Dublin Mid-Leinster | 162.9 | 99.8 | 29.3 | 292.0 | 179.4 | 109.4 | 34.2 | 322.9 | 161.9 | 101.7 | 29.0 | 292.6 | 129.3 | 89.5 | 23.2 | 242.0 | ||||
| Dublin North East | 132.5 | 82.6 | 32.4 | 247.5 | 146.9 | 90.3 | 38.1 | 275.4 | 131.1 | 81.2 | 32.9 | 245.2 | 107.2 | 72.5 | 26.8 | 206.4 | ||||
| West | 176.0 | 110.8 | 32.8 | 319.6 | 197.1 | 122.8 | 35.9 | 355.8 | 175.6 | 113.6 | 31.5 | 320.8 | 139.9 | 99.8 | 25.4 | 265.0 | ||||
| South | 205.1 | 123.1 | 39.7 | 367.9 | 229.1 | 135.0 | 42.7 | 406.8 | 209.5 | 126.8 | 37.3 | 373.6 | 169.2 | 112.4 | 30.5 | 312.1 | ||||
| Table 6: Average payment per dental treatment, by gender, age group, and local health office region, 2013-2016 | ||||||||
| € | ||||||||
| 2013 | 2014 | 2015 | 2016 | |||||
| State | ||||||||
| Total | 52.83 | 53.34 | 53.24 | 51.04 | ||||
| Gender | ||||||||
| Male | 53.46 | 54.04 | 53.87 | 51.91 | ||||
| Female | 52.31 | 52.76 | 52.72 | 50.33 | ||||
| Age Group | ||||||||
| 0 - 24 years | 41.50 | 41.24 | 41.11 | 40.75 | ||||
| 25 - 34 years | 43.33 | 43.12 | 43.03 | 42.26 | ||||
| 35 - 44 years | 46.64 | 46.62 | 46.39 | 45.10 | ||||
| 45 - 54 years | 51.58 | 51.69 | 51.01 | 48.88 | ||||
| 55 - 64 years | 60.55 | 60.34 | 59.50 | 55.72 | ||||
| 65 - 74 years | 66.77 | 67.86 | 66.87 | 61.68 | ||||
| 75 years and over | 69.20 | 71.32 | 71.05 | 65.54 | ||||
| Local Health Office Region | ||||||||
| Dublin Mid-Leinster | 53.33 | 53.88 | 53.68 | 51.66 | ||||
| Dublin North East | 52.36 | 53.03 | 53.31 | 50.68 | ||||
| West | 52.43 | 52.99 | 52.63 | 50.46 | ||||
| South | 53.09 | 53.43 | 53.38 | 51.29 | ||||
The data in this release is provided to the Central Statistics Office by the Primary Care Reimbursement Service (PCRS). The PCRS is the part of the Health Service Executive (HSE) that processes payments to all of the GPs, pharmacists, dentists and other health professionals who provide free or reduced cost services to the public.
Payments to dentists are covered under the Dental Treatment Services Scheme (DTSS). Under the DTSS, General Medical Services (GMS) eligible adults have access to a range of treatments and clinical procedures comprised of Routine Treatments and Full Upper and Lower Dentures. Dentists may also prescribe a range of medicines to eligible persons. All claims under the DTSS are processed and paid by the PCRS.
Under the GMS, people who are unable without undue hardship to arrange general practitioner medical and surgical services for themselves and their dependants may be granted a medical card and receive free general medical services.
The figures derived in this release refer to treatments that were carried out in the corresponding year.
Curative treatments include the following;
1st stage Endodontics
Apicectomy / amputation of roots
Denture repairs
Endodontics
Exodontics
Prosthetics
Restoration using amalgam filling
Restoration using composite filling
Protracted periodontal treatment
Surgical extractions
Preventative treatments include the following;
Prophylaxis
Miscellaneous treatments include all miscellaneous treatments and radiographs.
Regions
The regions consist of the local health offices and are constructed as follows;
|
Local Health Offices |
|||
| Dublin Mid-Leinster | Dublin South | Dublin North East | Dublin North West |
| Dublin South East | Dublin North Central | ||
| Dublin South City | Dublin North City | ||
| Dublin South West | Cavan / Monaghan | ||
| Dublin West | Louth | ||
| Kildare / West Wicklow | Meath | ||
| Wicklow | |||
| Laois / Offaly | |||
| Longford / Westmeath | |||
| West | Galway | South | South Lee Cork |
| Mayo | North Lee Cork | ||
| Roscommon | West Cork | ||
| Donegal | Kerry | ||
| Sligo / Leitrim | North Cork | ||
| Clare | Carlow / Kilkenny | ||
| North Tipperary / East Limerick | Waterford | ||
| Limerick | South Tipperary | ||
| Wexford | |||
 Hide Background Notes
Scan the QR code below to view this release online or go to
http://www.cso.ie/en/releasesandpublications/er/hfdt/hsefundeddentaltreatments2013-2016/
 Show Table 1: Number of above and below the line procedures by gender, age group, and local health office region, 2013-2016
 Hide Table 1: Number of above and below the line procedures by gender, age group, and local health office region, 2013-2016