
This release was compiled during the COVID-19 crisis. The results contained in this release reflect some of the economic impacts of the COVID-19 situation. For further information see Information Note - Implications of COVID-19 on the Quarterly National Accounts Quarter 1 2021 Final. The full series of information notes on the implications of COVID-19 on the National Accounts can be found on our Information Notes page.
| GVA at constant (2019) basic prices for sectors dominated by Foreign-owned MNEs and Other sectors | |||
| 2019 | 2020 | ||
| Amount €m | Amount €m | % change | |
| Foreign-owned MNE dominated | 151,115 | 186,070 | 23.1 |
| Other | 184,185 | 168,127 | -8.7 |
| Total | 335,300 | 354,198 | 5.6 |
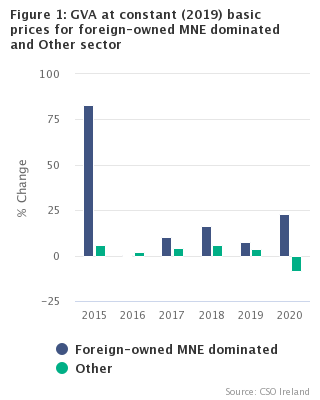
Gross Value Added (GVA) at constant (2019) basic prices for the non-MNE dominated sectors of the economy declined by 8.7% between 2019 and 2020. The sectors where foreign-owned multinational enterprises are dominant grew by 23.1% over the same period, resulting in an overall growth rate of 5.6%.
Real GVA for the total economy was over €350 billion for the first time in the 2020 reference period, with GVA for MNE dominated sectors exceeding €186 billion while GVA for the non-MNE dominated sectors was €168 billion.
Of the larger non-MNE dominated sectors, there were declines in the Wholesale & Retail sector including the sale and repair of motor vehicles (-4.6%), Administrative and support service activities (-14.6%), Real estate activities (-1.4%), Financial and insurance activities sector (-8.6%), Legal, accounting; management consultancy, architecture and engineering activities (-0.8%) and Construction (-10.2%). The AgriFood, Forestry and Fishing sector showed a year-on-year fall of -7.4% in 2020 compared with 2019.
Amongst the larger MNE dominated sectors, there was growth in Publishing, audio-visual and broadcasting activities (+20.7%), Computer programming and information service activities (+8.6%) and Manufacturing of chemicals and chemical products, solid fuel coke and refined petroleum products (+24.0%).
The share of total GVA at constant prices accounted for by the foreign-owned MNE dominated sectors stood at 52.5% in 2020, a significant increase from 45.1% in 2019.
|
The composition of the sectors dominated by foreign-owned multinational enterprises in terms of constituent Nace Rev 2 codes is given in Table 3 of this release. For data at the more detailed 37 sectoral breakdown level, please refer to Tables 21 and 22 of the National Income and Expenditure 2020 publication issued in July 2021. For information on chain linking see NIE 2020 Methodology Note. The data tables contained in this report as well as data for earlier years can be downloaded from the PxStat database service on the CSO website. |
| Foreign-owned MNE dominated | Other | |
| 2015 | 21.6335115102659 | 3.95533348228072 |
| 2016 | 0.177109892338092 | 1.10978524661136 |
| 2017 | 4.20632244131406 | 2.59076384813156 |
| 2018 | 6.79342959578978 | 3.32503407449477 |
| 2019 | 3.27093414978926 | 2.03610524451118 |
| 2020 | 10.4251031334373 | -4.78897023456858 |
| Foreign-owned MNE dominated | Other | Total | |
| 1995 | 15.501594872725 | 85.4278810353676 | 101.139031789439 |
| 1996 | 16.7264419894341 | 90.1394938255031 | 107.199329469343 |
| 1997 | 20.8582943667914 | 96.3094702869191 | 118.396569696816 |
| 1998 | 24.9041031468438 | 101.882848499823 | 128.923628258817 |
| 1999 | 29.2259779654491 | 107.412508584863 | 139.699780838961 |
| 2000 | 33.1259361705495 | 114.181101230802 | 151.089975917032 |
| 2001 | 35.0584486317361 | 117.719956764546 | 156.84134159801 |
| 2002 | 40.415719292844 | 120.817071373402 | 166.385663152603 |
| 2003 | 38.7076047873846 | 125.033187358492 | 168.528221948548 |
| 2004 | 39.8868951025773 | 132.39124326463 | 177.281474612011 |
| 2005 | 43.676346182388 | 139.106093269484 | 188.066215806945 |
| 2006 | 46.0019407918026 | 145.182089850454 | 196.667940365363 |
| 2007 | 51.0313579318295 | 155.385721723481 | 212.024888567272 |
| 2008 | 49.2379622486908 | 152.362130270022 | 207.253265725224 |
| 2009 | 50.7391995734574 | 138.962902895758 | 194.021618368065 |
| 2010 | 53.7994936614113 | 139.649139075966 | 197.631675117177 |
| 2011 | 53.7291017542443 | 141.200715420186 | 199.231210996499 |
| 2012 | 53.6313902722112 | 137.258413169045 | 195.015936211001 |
| 2013 | 53.0073204861988 | 140.428246289462 | 197.79341297032 |
| 2014 | 59.5463509931792 | 148.928917577193 | 212.83928853704 |
| 2015 | 108.959377895006 | 157.963280753642 | 267.302404164022 |
| 2016 | 109.435434035106 | 160.946287935606 | 270.742305809504 |
| 2017 | 120.847712282882 | 167.975353900392 | 289.144893957411 |
| 2018 | 140.629071587733 | 177.657310973918 | 318.401915006974 |
| 2019 | 151.114995684899 | 184.184634383703 | 335.299630068601 |
| 2020 | 186.070327925584 | 168.127234903099 | 354.197562828683 |
| Table 1 Gross Value Added at Current Basic Prices | €million | |||||
| 2015 | 2016 | 2017 | 2018 | 2019 | 2020 | |
| Foreign-owned MNE dominated | 101,158 | 100,545 | 112,523 | 132,231 | 151,115 | 176,490 |
| Other | 142,941 | 150,263 | 161,511 | 174,054 | 184,185 | 172,774 |
| Total | 244,098 | 250,808 | 274,034 | 306,286 | 335,300 | 349,264 |
| Annual Percentage Changes | ||||||
| Foreign-owned MNE dominated | 123.3% | -0.6% | 11.9% | 17.5% | 14.3% | 16.8% |
| Other | 7.3% | 5.1% | 7.5% | 7.8% | 5.8% | -6.2% |
| Total | 36.8% | 2.7% | 9.3% | 11.8% | 9.5% | 4.2% |
| Table 2 Gross Value Added at Constant Basic Prices (Chain-linked annually and referenced to year 2019) | €million | |||||
| 2015 | 2016 | 2017 | 2018 | 2019 | 2020 | |
| Foreign-owned MNE dominated | 108,959 | 109,435 | 120,848 | 140,629 | 151,115 | 186,070 |
| Other | 157,963 | 160,946 | 167,975 | 177,657 | 184,185 | 168,127 |
| Total | 267,302 | 270,742 | 289,145 | 318,402 | 335,300 | 354,198 |
| Annual Percentage Changes | ||||||
| Foreign-owned MNE dominated | 83.0% | 0.4% | 10.4% | 16.4% | 7.5% | 23.1% |
| Other | 6.1% | 1.9% | 4.4% | 5.8% | 3.7% | -8.7% |
| Total | 25.6% | 1.3% | 6.8% | 10.1% | 5.3% | 5.6% |
| Table 3 Composition of Foreign-owned multinational enterprise dominated sector and Other sectors1 | ||
| Description | Nace code | Percentage of 2020 GVA at constant basic prices |
| Chemicals and chemical products | 20 | 5.0% |
| Software and communications sectors | 58-63 | 16.5% |
| Other NACE sectors dominated by Foreign-owned MNEs2 | 18.2, 21, 26, 27 and 32.5 | 31.0% |
| (Reproduction of recorded media, Basic pharmaceutical products and pharmaceutical preparations, Computer, electronic and optical products, Electrical equipment, Medical and dental instruments and supplies) | ||
| Foreign-owned MNE dominated Total | 52.5% | |
| “Other” Sector | 47.5% | |
| The "Other" Sector includes all Nace sectors excluding those listed as part of the Foreign-owned MNE dominated sector above and includes Wholesale & retail sector including the sale and repair of motor vehicles, Administrative & support service activities, Construction, Accommodation & food services and the Manufacture of Food, beverages & tobacco products | ||
| 1 Foreign-owned Multinational Enterprise (MNE) dominated sectors occur where MNE turnover on average exceeds 85% of the sector total | ||
| 2 Nace Rev.2 divisions 18, 21, 26, 27 & 32.5 are collapsed together for 2020 for confidentiality reasons | ||
This release provides gross value added at current basic prices and constant basic prices (chain-linked and referenced to 2019) for the economy divided into two sectors, namely
(a) the economic sectors dominated by Foreign-owned Multi National Enterprises and
(b) all other remaining sectors.
It contains long time series of annual Gross Value Added data for reference years 1995 to 2020 for the MNE-dominated and non-MNE dominated sectors. These data accord and fully align with the 2015-2020 MNE and non-MNE dominated sector estimates that were published as part of Quarterly National Accounts (QNA) Q1 2021 Final on Thursday 15th July 2021, in QNA Table 6.2.
It also provides data concerning the composition of the Foreign-owned multinational dominated sector.
Gross value added at basic prices is measured as the difference between output at basic prices and intermediate consumption at purchasers’ prices.
The sectoral data underlying the aggregates in the release are the same as those used for National Income and Expenditure (NIE 2020) Tables 4, which gives a breakdown of the economy at Constant Basic Prices by 10 principal economic sectors (Nace Rev.2 A10) and NIE Table 22 which illustrates a 37 sector breakdown of the Irish economy. The correspondence with the relevant A10 sections of NACE Rev.2 is as follows:
|
Agriculture, forestry and fishing |
Section A |
|
Industry (excluding Construction) |
Sections B, C, D, E |
|
Of which: Manufacturing |
Section C |
|
Construction |
Section F |
|
Distribution, transport, hotels and restaurants |
Sections G, H, I |
|
Information and communication |
Section J |
|
Financial and insurance activities |
Section K |
|
Real estate activities |
Section L |
|
Professional, admin and support services |
Sections M, N |
|
Public admin, education and health |
Sections O, P, Q |
|
Arts, entertainment and other services |
Sections R, S, T |
National accounts are compiled in the EU according to the European System of National and Regional Accounts (ESA) framework. In 2014, the new ESA 2010 framework replaced the ESA 95 version and all EU member states were required to adopt ESA 2010 by September 2014. ESA 2010 is the European version of the current UN mandated international standards for national accounts statistics, the System of National Accounts (SNA) 2008. The results for all years in this release are published on an ESA 2010 basis.
Nace classification
In compliance with EU regulations the contents of the sectors in this release conform to the Nace Rev. 2 system which corresponds with the UN International Standard Industrial Classification (ISIC Rev 4).
In table 3, the following is the correspondence with the relevant NIE and Nace Rev. 2 sectors:
|
NIE Sectors |
Nace 2 Sections |
Foreign-owned |
Other |
|
Agriculture, forestry and fishing |
Section A |
|
01-03 |
|
Industry (excluding Construction) |
Sections B to E |
18.2, 20, 21, 26, |
05-18.1, |
|
Of which: Manufacturing |
Section C |
18.2, 20, 21, 26, |
10-18.1, |
|
Construction |
Section F |
41-43 |
|
|
Distribution, transport, hotels and restaurants |
Sections G to I |
|
45-56 |
|
Information and communication |
Section J |
58-63 |
n.a. |
|
Financial and insurance activities |
Section K |
64-66 |
|
|
Real estate activities |
Section L |
68 |
|
|
Professional, admin and support services |
Sections M to N |
69-82 |
|
|
Public admin, education and health |
Sections O to Q |
|
84-88 |
|
Arts, entertainment and other services |
Sections R to T |
|
90-98 |
For further information on the Nace Rev. 2 classification of industrial activity, click here.
 Hide Background Notes
Scan the QR code below to view this release online or go to
http://www.cso.ie/en/releasesandpublications/er/gvafm/grossvalueaddedforforeign-ownedmultinationalenterprisesandothersectorsannualresultsfor2020/
 Show Table 1 Gross Value Added at Current Basic Prices
 Hide Table 1 Gross Value Added at Current Basic Prices