
| General Government Revenue and Expenditure | |||||||
| GG Deficit | Revenue | Expenditure | |||||
| End of year | €m | % GDP | % GNI* | €m | % GDP | €m | % GDP |
| 2012 | -14,114 | -8.1 | -11.2 | 59,498 | 34.0 | 73,612 | 42.0 |
| 2013 | -11,027 | -6.1 | -8.1 | 61,502 | 34.2 | 72,529 | 40.3 |
| 2014 | -7,045 | -3.6 | -4.7 | 66,011 | 33.8 | 73,055 | 37.4 |
| 2015 | -4,946 | -1.9 | -3.1 | 70,898 | 27.0 | 75,844 | 28.9 |
| 2016 | -1,414 | -0.5 | -0.8 | 73,651 | 27.0 | 75,066 | 27.5 |
| 2017 | -1,035 | -0.4 | -0.6 | 76,538 | 26.0 | 77,573 | 26.4 |
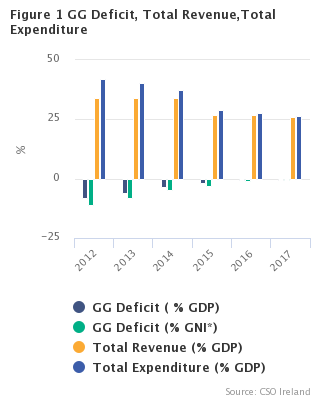
In 2017, the government deficit was €1.0 billion (-0.4% of GDP, -0.6% of GNI*), an improvement on the 2016 deficit of €1.4 billion (-0.5% of GDP, -0.8% of GNI*). During 2017, government revenues increased by 3.9% to €76.5 billion with government expenditures increasing by 3.3% to €77.6 billion (Table 1).
The main driver of the increase in government revenues was an increase in Taxes of €2.8 billion (+5.3%). There were also increased revenues from Social contributions (+5%) and Sales of goods and services (+1.5%). Capital transfers decreased markedly between 2016 and 2017 (-57%). However, excluding the once-off reimbursement of a prepaid margin from the EFSF (€555 million) in 2016, the decrease in Capital transfers was -4% (Table 1).
Government expenditures rose by €2.5 billion between 2016 and 2017. There were increases of €1.2 billion (+6.4%) in Compensation of employees/Pay, €0.6 billion (+2.2%) in Social benefits and €0.3 billion (+3.6%) in Use of goods and services. Debt services costs, or Interest, decreased by €0.4 billion (-5.8%) (Tables 1 and 4).
In 2017, central government collected €72.8 billion (95%) of total revenue (Table 4). The balance was generated by local government in the form of commercial rates (Other taxes on production, D.29), social housing rents (included in Incidental sales and fees, P.131) and Other capital transfers (Table 8).
Central government spent €74.0 billion in 2017 (Table 4), resulting in a central government deficit of €1.2 billion down from €1.6 billion in 2016. Local government recorded a surplus of €182 million in 2017 (Table 7). The central and local balances combine to make up the general government deficit of €1.0 billion in 2017.
|
National accounts are compiled in the EU according to the European System of National Accounts 2010 (ESA 2010) framework. The Government Income and Expenditure (GIE) 2017 release is fully aligned with the National Income and Expenditure (NIE) 2017, published on 19 July 2018. The changes to the previously published tables under the Excessive Debt Procedure in April 2018 reflect updated data sources which become available between the April and July publications. Modified Gross National Income (GNI*) is equal to Gross National Income at current market prices less the factor income of redomiciled companies, less depreciation on research and development related intellectual property imports and less depreciation on aircraft related to aircraft leasing. |
| Table 1 General Government transactions: revenue, expenditure and deficit | ||||||||||
| €million | ||||||||||
| Description | ESA2010 code | 2012 | 2013 | 2014 | 2015 | 2016 | 2017 | |||
| General Government transactions | ||||||||||
| Revenue | TR | 59,498 | 61,502 | 66,011 | 70,898 | 73,651 | 76,538 | |||
| Taxes and social contributions | D2 + D5 + D91 + D61 | 50,823 | 52,927 | 57,443 | 62,232 | 65,139 | 68,570 | |||
| Taxes | D2 + D5 + D91 | 40,949 | 42,517 | 46,460 | 50,844 | 53,097 | 55,928 | |||
| Social contributions | D61 | 9,874 | 10,410 | 10,983 | 11,388 | 12,042 | 12,641 | |||
| Sales of goods and services | P1O | 5,057 | 4,868 | 4,826 | 5,350 | 5,446 | 5,526 | |||
| Investment income | D4 | 3,065 | 3,272 | 3,069 | 2,711 | 1,822 | 1,770 | |||
| Current transfer revenue (excluding taxes) | D7 | 254 | 150 | 266 | 294 | 244 | 247 | |||
| Capital transfer revenue (excluding taxes) | D9N | 299 | 286 | 406 | 310 | 999 | 426 | |||
| Expenditure | TE | 73,612 | 72,529 | 73,055 | 75,844 | 75,066 | 77,573 | |||
| Expense | Expense | 73,067 | 71,999 | 72,043 | 74,647 | 73,505 | 75,964 | |||
| Compensation of employees | D1 | 18,996 | 18,594 | 18,366 | 18,952 | 19,442 | 20,681 | |||
| Use of goods and services plus taxes payable | P2 + D5 + D29 | 8,343 | 8,196 | 8,937 | 9,243 | 9,525 | 9,865 | |||
| Depreciation (Consumption of fixed capital) | P51c | 3,106 | 3,166 | 3,317 | 3,515 | 3,722 | 3,945 | |||
| Interest (excluding FISIM) | D41 | 7,298 | 7,760 | 7,589 | 6,849 | 6,165 | 5,809 | |||
| Subsidies | D3 | 1,949 | 1,909 | 1,867 | 1,790 | 1,771 | 1,819 | |||
| Social benefits | D62 + D632 | 29,454 | 28,526 | 28,076 | 28,423 | 28,437 | 29,068 | |||
| Other current transfers | D7 | 2,507 | 2,915 | 2,759 | 2,528 | 3,005 | 3,173 | |||
| Capital transfers | D9 | 1,415 | 933 | 1,132 | 3,348 | 1,438 | 1,603 | |||
| Net operating balance | NOB | -13,569 | -10,496 | -6,033 | -3,749 | 147 | 575 | |||
| Net acquisition of non-financial assets | P5 + NP - P51c | 545 | 530 | 1,012 | 1,197 | 1,561 | 1,610 | |||
| General Government Surplus/Deficit | B9 | -14,114 | -11,027 | -7,045 | -4,946 | -1,414 | -1,035 | |||
| General Government Surplus/Deficit (% of GDP) | -8.1 | -6.1 | -3.6 | -1.9 | -0.5 | -0.4 | ||||
| General Government Surplus/Deficit (% of GNI*) | -11.2 | -8.1 | -4.7 | -3.1 | -0.8 | -0.6 | ||||
| Table 2 General Government: detailed classification of revenue and output | |||||||||||
| €million | |||||||||||
| Description | ESA2010 code | 2012 | 2013 | 2014 | 2015 | 2016 | 2017 | ||||
| Total Revenue | TR | 59,498 | 61,502 | 66,011 | 70,898 | 73,651 | 76,538 | ||||
| Taxes and social contributions | 50,823 | 52,927 | 57,443 | 62,232 | 65,139 | 68,570 | |||||
| Taxes | D2 + D5 + D91 | 40,949 | 42,517 | 46,460 | 50,844 | 53,097 | 55,928 | ||||
| Indirect taxes (taxes on production and imports) | D2 | 18,372 | 19,310 | 21,213 | 22,581 | 23,625 | 24,681 | ||||
| Taxes on products | D21 | 16,099 | 16,749 | 18,235 | 19,437 | 20,761 | 21,565 | ||||
| of which Value-Added Tax | D211 | 10,219 | 10,372 | 11,521 | 11,955 | 12,826 | 13,278 | ||||
| Other taxes on production | D29 | 2,273 | 2,562 | 2,978 | 3,144 | 2,864 | 3,116 | ||||
| Direct taxes | D5 | 22,292 | 22,929 | 24,889 | 27,863 | 29,061 | 30,799 | ||||
| Taxes on income, profits and capital gains | D51 | 20,837 | 21,298 | 23,016 | 26,599 | 28,023 | 29,784 | ||||
| Other current direct taxes | D59 | 1,456 | 1,630 | 1,873 | 1,263 | 1,039 | 1,015 | ||||
| Capital taxes | D91 | 285 | 278 | 359 | 401 | 411 | 448 | ||||
| Social contributions | D61 | 9,874 | 10,410 | 10,983 | 11,388 | 12,042 | 12,641 | ||||
| Actual social contributions | D611 + D613 | 8,482 | 9,007 | 9,597 | 10,206 | 10,682 | 11,407 | ||||
| PRSI receipts | D611 + D613(pt) | 6,799 | 7,299 | 7,947 | 8,512 | 9,226 | 9,824 | ||||
| Government employees' social contributions | D613(pt) | 1,682 | 1,709 | 1,649 | 1,694 | 1,456 | 1,582 | ||||
| Employers' imputed social contributions | D612 | 1,393 | 1,402 | 1,387 | 1,182 | 1,360 | 1,235 | ||||
| Sales of goods and services | P1O | 5,057 | 4,868 | 4,826 | 5,350 | 5,446 | 5,526 | ||||
| Sales of market establishments (= market output) | P11 | 956 | 991 | 1,039 | 1,117 | 1,221 | 1,326 | ||||
| Imputed sales related to production of own-use capital assets (= output for own final use) | P12 | 38 | 33 | 33 | 21 | 21 | 22 | ||||
| Incidental sales and fees of non-market establishments | P131 | 4,063 | 3,844 | 3,754 | 4,213 | 4,204 | 4,178 | ||||
| Investment income | D4 | 3,065 | 3,272 | 3,069 | 2,711 | 1,822 | 1,770 | ||||
| Interest (excluding FISIM) | D41 | 1,606 | 1,398 | 1,044 | 675 | 251 | 135 | ||||
| Dividends | D42 | 1,428 | 1,771 | 1,922 | 1,932 | 1,468 | 1,532 | ||||
| Current transfer revenue | D39 + D7 | 254 | 150 | 266 | 294 | 244 | 247 | ||||
| Subsidies | D39 | 0 | 0 | 0 | 0 | 0 | 0 | ||||
| Other current transfers | D7 | 254 | 150 | 266 | 294 | 244 | 247 | ||||
| Non-life insurance claims | D72 | 8 | 9 | 7 | 8 | 18 | 18 | ||||
| Other Domestic - Current | D7N_S1 | 200 | 131 | 223 | 193 | 194 | 194 | ||||
| From Rest of World - Current | D7N_S2 | 46 | 11 | 36 | 93 | 32 | 34 | ||||
| Capital transfer revenue | D9N | 299 | 286 | 406 | 310 | 999 | 426 | ||||
| Output | P1 | 30,797 | 30,330 | 31,025 | 32,176 | 33,226 | 35,111 | ||||
| Market output (sales of market establishments) | P11 | 956 | 991 | 1,039 | 1,117 | 1,221 | 1,326 | ||||
| Output for own final use | P12 | 38 | 33 | 33 | 21 | 21 | 22 | ||||
| Non-market output | P13 | 29,804 | 29,306 | 29,953 | 31,039 | 31,985 | 33,764 | ||||
| = Non-market compensation of employees | D1_nonmarket | 18,958 | 18,561 | 18,333 | 18,931 | 19,421 | 20,659 | ||||
| = Total compensation of employees | D1 | 18,996 | 18,594 | 18,366 | 18,952 | 19,442 | 20,681 | ||||
| - Compensation of employees of market establishments | D1_market | ||||||||||
| - Compensation related to production of own-use capital assets | D1_own-use | -38 | -33 | -33 | -21 | -21 | -22 | ||||
| + Non-market intermediate consumption | P2_nonmarket | 8,129 | 7,976 | 8,718 | 9,018 | 9,278 | 9,613 | ||||
| = Total intermediate consumption | P2 | 8,342 | 8,196 | 8,937 | 9,243 | 9,525 | 9,865 | ||||
| - Intermediate consumption of market establishments | P2_market | -212 | -219 | -219 | -225 | -247 | -252 | ||||
| - Intermediate consumption related to production of own-use capital assets | P2_own-use | ||||||||||
| + Non-market consumption of fixed capital | P51c_nonmarket | 2,716 | 2,768 | 2,902 | 3,090 | 3,285 | 3,491 | ||||
| = Total consumption of fixed capital | P51c | 3,106 | 3,166 | 3,317 | 3,515 | 3,722 | 3,945 | ||||
| - Consumption of fixed capital by market establishments | P51c_market | -390 | -397 | -415 | -425 | -437 | -454 | ||||
| - Consumption of fixed capital related to production of own-use capital assets | P51c_own-use | ||||||||||
| + Other taxes on production, payable | D29_pay | 0 | 0 | 0 | 0 | 0 | 0 | ||||
| - Other subsidies on production, receivable | D39_rec | 0 | 0 | 0 | 0 | 0 | 0 | ||||
| Table 3 General Government: detailed classification of expenditure and consumption | |||||||||||
| €million | |||||||||||
| Description | ESA2010 code | 2012 | 2013 | 2014 | 2015 | 2016 | 2017 | ||||
| Total Expenditure | TE | 73,612 | 72,529 | 73,055 | 75,844 | 75,066 | 77,573 | ||||
| Expense | 73,067 | 71,999 | 72,043 | 74,647 | 73,505 | 75,964 | |||||
| Compensation of employees | D1 | 18,996 | 18,594 | 18,366 | 18,952 | 19,442 | 20,681 | ||||
| Of which: Related to production of own-use capital assets | 38 | 33 | 33 | 21 | 21 | 22 | |||||
| Use of goods and services plus taxes payable | P2 + D5 + D29 | 8,343 | 8,196 | 8,937 | 9,243 | 9,525 | 9,865 | ||||
| Use of goods and services [Intermediate consumption] | P2 | 8,342 | 8,196 | 8,937 | 9,243 | 9,525 | 9,865 | ||||
| Of which: Intermediate consumption of market establishments | 212 | 219 | 219 | 225 | 247 | 252 | |||||
| Taxes, payable | D5 | 1 | 0 | 0 | 0 | 0 | 0 | ||||
| Depreciation (Consumption of fixed capital) | P51c | 3,106 | 3,166 | 3,317 | 3,515 | 3,722 | 3,945 | ||||
| Of which: Depreciation by market establishments | 390 | 397 | 415 | 425 | 437 | 454 | |||||
| Interest (excluding FISIM) | D41 | 7,298 | 7,760 | 7,589 | 6,849 | 6,165 | 5,809 | ||||
| Other domestic interest payable | D41_S1 | 2,677 | 3,122 | 2,898 | 2,452 | 2,257 | 2,111 | ||||
| Interest payable to rest of world | D41_S2 | 4,621 | 4,638 | 4,690 | 4,397 | 3,908 | 3,698 | ||||
| Subsidies | D3 | 1,949 | 1,909 | 1,867 | 1,790 | 1,771 | 1,819 | ||||
| Product subsidies | D31 | 1,101 | 1,071 | 957 | 864 | 907 | 935 | ||||
| Other subsidies on production | D39 | 847 | 838 | 910 | 926 | 864 | 885 | ||||
| Social benefits | D62 + D632 | 29,454 | 28,526 | 28,076 | 28,423 | 28,437 | 29,068 | ||||
| Social benefits in cash | D62 | 24,235 | 23,540 | 22,974 | 23,011 | 22,741 | 23,008 | ||||
| Social benefits in kind (via market producers) | D632 | 5,219 | 4,986 | 5,102 | 5,412 | 5,696 | 6,060 | ||||
| Other current transfers | D7 | 2,507 | 2,915 | 2,759 | 2,528 | 3,005 | 3,173 | ||||
| Net non-life insurance premiums | D71 | 77 | 58 | 74 | 55 | 105 | 107 | ||||
| Current international cooperation | D74 | 523 | 530 | 434 | 473 | 438 | 503 | ||||
| Miscellaneous current transfers | D75 | 718 | 764 | 768 | 493 | 611 | 832 | ||||
| VAT and GNI based EU budget contribution | D76 | 1,190 | 1,564 | 1,483 | 1,507 | 1,851 | 1,731 | ||||
| VAT-based EU own resources | D761 | 191 | 202 | 203 | 215 | 219 | 262 | ||||
| GNI-based EU own resources | D762 | 999 | 1,361 | 1,280 | 1,292 | 1,632 | 1,470 | ||||
| Capital transfers | D9 | 1,415 | 933 | 1,132 | 3,348 | 1,438 | 1,603 | ||||
| Investment grants | D92 | 1,135 | 895 | 939 | 1,237 | 1,438 | 1,573 | ||||
| Other capital transfers | D99 | 280 | 38 | 193 | 2,111 | 0 | 30 | ||||
| Net acquisition of non-financial assets | P5 + NP - P51c | 545 | 530 | 1,012 | 1,197 | 1,561 | 1,610 | ||||
| = Gross investment in non-financial assets | P5 + NP | 3,651 | 3,696 | 4,328 | 4,711 | 5,284 | 5,555 | ||||
| Gross fixed capital formation | P51 | 3,568 | 3,613 | 4,268 | 4,651 | 5,224 | 5,600 | ||||
| Net acquisition of stocks | P52 | 83 | 83 | 60 | 60 | 60 | 60 | ||||
| Net acquisition of unproduced assets | NP | 0 | 0 | 0 | 0 | 0 | -105 | ||||
| - Consumption of fixed capital | P51c | -3,106 | -3,166 | -3,317 | -3,515 | -3,722 | -3,945 | ||||
| Net expenditure on current goods and services | P3 excl. D632 | 25,740 | 25,462 | 26,199 | 26,826 | 27,780 | 29,585 | ||||
| = Output | P1 | 30,797 | 30,330 | 31,025 | 32,176 | 33,226 | 35,111 | ||||
| - Sales of goods and services | P11+P12+P131 | -5,057 | -4,868 | -4,826 | -5,350 | -5,446 | -5,526 | ||||
| Market output (sales of market establishments) | P11 | -956 | -991 | -1,039 | -1,117 | -1,221 | -1,326 | ||||
| Output for own final use | P12 | -38 | -33 | -33 | -21 | -21 | -22 | ||||
| Incidental sales and fees of non-market establishments | P131 | -4,063 | -3,844 | -3,754 | -4,213 | -4,204 | -4,178 | ||||
| Final consumption expenditure | P3 | 30,959 | 30,447 | 31,301 | 32,238 | 33,476 | 35,646 | ||||
| = Net expenditure on current goods and services | P3 excl. D632 | 25,740 | 25,462 | 26,199 | 26,826 | 27,780 | 29,585 | ||||
| + Social transfers in kind via market producers | D632 | 5,219 | 4,986 | 5,102 | 5,412 | 5,696 | 6,060 | ||||
| made up of | |||||||||||
| Individual consumption (= social transfers in kind) | P31 (= D63) | 20,639 | 20,540 | 21,064 | 21,790 | 22,627 | 24,093 | ||||
| Social transfers in kind (via market producers) | D632 | 5,219 | 4,986 | 5,102 | 5,412 | 5,696 | 6,060 | ||||
| Social transfers in kind (provided directly by government) | D631 | 15,420 | 15,554 | 15,962 | 16,378 | 16,931 | 18,033 | ||||
| Collective consumption (= actual final consumption of government) | P32 | 10,321 | 9,908 | 10,237 | 10,448 | 10,849 | 11,552 | ||||
| Total social transfers | D62 + D63 | 44,874 | 44,080 | 44,038 | 44,801 | 45,368 | 47,102 | ||||
| Social benefits in cash | D62 | 24,235 | 23,540 | 22,974 | 23,011 | 22,741 | 23,008 | ||||
| Social transfers in kind (= individual consumption) | D63 | 20,639 | 20,540 | 21,064 | 21,790 | 22,627 | 24,093 | ||||
| Table 4 Central Government transactions: revenue, expenditure, financing and deficit | ||||||||||
| €million | ||||||||||
| Description | ESA2010 code | 2012 | 2013 | 2014 | 2015 | 2016 | 2017 | |||
| Central Government transactions | ||||||||||
| Revenue | TR | 55,852 | 58,047 | 62,665 | 67,464 | 70,062 | 72,822 | |||
| Taxes and social contributions | D2 + D5 + D91 + D61 | 49,013 | 51,194 | 55,772 | 60,599 | 63,567 | 67,048 | |||
| Taxes | D2 + D5 + D91 | 39,468 | 41,111 | 45,057 | 49,456 | 51,743 | 54,631 | |||
| Social contributions | D61 | 9,545 | 10,083 | 10,715 | 11,144 | 11,824 | 12,417 | |||
| Sales of goods and services | P1O | 3,479 | 3,317 | 3,395 | 3,831 | 3,821 | 3,746 | |||
| Investment income | D4 | 3,065 | 3,322 | 3,099 | 2,725 | 1,848 | 1,811 | |||
| Current transfer revenue (excluding taxes) | D7 | 211 | 124 | 225 | 253 | 199 | 207 | |||
| Capital transfer revenue (excluding taxes) | D9N | 83 | 90 | 174 | 56 | 628 | 10 | |||
| Expenditure | TE | 69,874 | 69,065 | 69,863 | 72,974 | 71,624 | 74,039 | |||
| Expense | Expense | 69,055 | 67,979 | 67,876 | 71,010 | 69,454 | 71,832 | |||
| Compensation of employees | D1 | 16,849 | 16,568 | 16,819 | 17,430 | 17,896 | 18,997 | |||
| Use of goods and services plus taxes payable | P2 + D5 + D29 | 6,464 | 6,796 | 7,215 | 7,491 | 7,619 | 8,012 | |||
| Depreciation (Consumption of fixed capital) | P51c | 1,297 | 1,332 | 1,624 | 1,757 | 1,886 | 2,039 | |||
| Interest (excluding FISIM) | D41 | 7,275 | 7,738 | 7,574 | 6,832 | 6,156 | 5,801 | |||
| Subsidies | D3 | 1,949 | 1,909 | 1,867 | 1,790 | 1,771 | 1,819 | |||
| Social benefits | D62 + D632 | 27,904 | 27,057 | 26,834 | 27,078 | 27,025 | 27,665 | |||
| Other current transfers | D7 | 4,720 | 4,668 | 4,330 | 4,146 | 4,776 | 5,135 | |||
| Capital transfers | D9 | 2,598 | 1,913 | 1,613 | 4,486 | 2,324 | 2,365 | |||
| Net operating balance | NOB | -13,203 | -9,932 | -5,211 | -3,546 | 608 | 990 | |||
| Net acquisition of non-financial assets | P5 + NP - P51c | 819 | 1,086 | 1,986 | 1,964 | 2,170 | 2,207 | |||
| Central Government Surplus/Deficit | B9 | -14,022 | -11,018 | -7,197 | -5,510 | -1,562 | -1,217 | |||
| Table 5 Central Government: detailed classification of revenue and output | |||||||||||
| €million | |||||||||||
| Description | ESA2010 code | 2012 | 2013 | 2014 | 2015 | 2016 | 2017 | ||||
| Total Revenue | TR | 55,852 | 58,047 | 62,665 | 67,464 | 70,062 | 72,822 | ||||
| Taxes and social contributions | 49,013 | 51,194 | 55,772 | 60,599 | 63,567 | 67,048 | |||||
| Taxes | D2 + D5 + D91 | 39,468 | 41,111 | 45,057 | 49,456 | 51,743 | 54,631 | ||||
| Indirect taxes (taxes on production and imports) | D2 | 16,894 | 17,904 | 19,810 | 21,192 | 22,271 | 23,383 | ||||
| Taxes on products | D21 | 16,099 | 16,749 | 18,235 | 19,437 | 20,761 | 21,565 | ||||
| of which Value-Added Tax | D211 | 10,219 | 10,372 | 11,521 | 11,955 | 12,826 | 13,278 | ||||
| Other taxes on production | D29 | 795 | 1,155 | 1,575 | 1,755 | 1,510 | 1,819 | ||||
| Direct taxes | D5 | 22,292 | 22,929 | 24,889 | 27,863 | 29,061 | 30,799 | ||||
| Taxes on income, profits and capital gains | D51 | 20,837 | 21,298 | 23,016 | 26,599 | 28,023 | 29,784 | ||||
| Other current direct taxes | D59 | 1,456 | 1,630 | 1,873 | 1,263 | 1,039 | 1,015 | ||||
| Capital taxes | D91 | 282 | 278 | 359 | 401 | 411 | 448 | ||||
| Social contributions | D61 | 9,545 | 10,083 | 10,715 | 11,144 | 11,824 | 12,417 | ||||
| Actual social contributions | D611 + D613 | 8,292 | 8,821 | 9,467 | 10,080 | 10,600 | 11,306 | ||||
| PRSI receipts | D611 + D613(pt) | 6,799 | 7,299 | 7,947 | 8,512 | 9,226 | 9,824 | ||||
| Government employees' social contributions | D613(pt) | 1,493 | 1,523 | 1,519 | 1,568 | 1,374 | 1,482 | ||||
| Employers' imputed social contributions | D612 | 1,253 | 1,262 | 1,248 | 1,064 | 1,224 | 1,111 | ||||
| Sales of goods and services | P1O | 3,479 | 3,317 | 3,395 | 3,831 | 3,821 | 3,746 | ||||
| Sales of market establishments (= market output) | P11 | 0 | 0 | 0 | 0 | 0 | 0 | ||||
| Imputed sales related to production of own-use capital assets (= output for own final use) | P12 | 38 | 33 | 33 | 21 | 21 | 22 | ||||
| Incidental sales and fees of non-market establishments | P131 | 3,441 | 3,284 | 3,362 | 3,810 | 3,800 | 3,725 | ||||
| Investment income | D4 | 3,065 | 3,322 | 3,099 | 2,725 | 1,848 | 1,811 | ||||
| Interest (excluding FISIM) | D41 | 1,606 | 1,448 | 1,074 | 690 | 276 | 176 | ||||
| of which received from local government | D41_LG | 97 | 99 | 72 | 51 | 62 | 76 | ||||
| Dividends | D42 | 1,428 | 1,771 | 1,922 | 1,932 | 1,468 | 1,532 | ||||
| Current transfer revenue | D39 + D7 | 211 | 124 | 225 | 253 | 199 | 207 | ||||
| Subsidies | D39 | 0 | 0 | 0 | 0 | 0 | 0 | ||||
| Other current transfers | D7 | 211 | 124 | 225 | 253 | 199 | 207 | ||||
| Non-life insurance claims | D72 | 8 | 9 | 7 | 8 | 18 | 18 | ||||
| Grants from local government | D73 | 3 | 3 | 3 | 3 | 3 | 4 | ||||
| Other Domestic - Current | D7N_S1 | 155 | 102 | 179 | 149 | 145 | 150 | ||||
| From Rest of World - Current | D7N_S2 | 46 | 11 | 36 | 93 | 32 | 34 | ||||
| Capital transfer revenue | D9N | 83 | 90 | 174 | 56 | 628 | 10 | ||||
| Output | P1 | 24,609 | 24,695 | 25,658 | 26,678 | 27,402 | 29,047 | ||||
| Market output (sales of market establishments) | P11 | 0 | 0 | 0 | 0 | 0 | 0 | ||||
| Output for own final use | P12 | 38 | 33 | 33 | 21 | 21 | 22 | ||||
| Non-market output | P13 | 24,571 | 24,662 | 25,625 | 26,657 | 27,381 | 29,025 | ||||
| = Non-market compensation of employees | D1_nonmarket | 16,811 | 16,535 | 16,786 | 17,409 | 17,876 | 18,975 | ||||
| = Total compensation of employees | D1 | 16,849 | 16,568 | 16,819 | 17,430 | 17,896 | 18,997 | ||||
| - Compensation of employees of market establishments | D1_market | 0 | 0 | 0 | 0 | 0 | 0 | ||||
| - Compensation related to production of own-use capital assets | D1_own-use | -38 | -33 | -33 | -21 | -21 | -22 | ||||
| + Non-market intermediate consumption | P2_nonmarket | 6,463 | 6,796 | 7,215 | 7,491 | 7,619 | 8,012 | ||||
| = Total intermediate consumption | P2 | 6,463 | 6,796 | 7,215 | 7,491 | 7,619 | 8,012 | ||||
| - Intermediate consumption of market establishments | P2_market | 0 | 0 | 0 | 0 | 0 | 0 | ||||
| - Intermediate consumption related to production of own-use capital assets | P2_own-use | 0 | 0 | 0 | 0 | 0 | 0 | ||||
| + Non-market consumption of fixed capital | P51c_nonmarket | 1,297 | 1,332 | 1,624 | 1,757 | 1,886 | 2,039 | ||||
| = Total consumption of fixed capital | P51c | 1,297 | 1,332 | 1,624 | 1,757 | 1,886 | 2,039 | ||||
| - Consumption of fixed capital by market establishments | P51c_market | 0 | 0 | 0 | 0 | 0 | 0 | ||||
| - Consumption of fixed capital related to production of own-use capital assets | P51c_own-use | 0 | 0 | 0 | 0 | 0 | 0 | ||||
| + Other taxes on production, payable | D29_pay | 0 | 0 | 0 | 0 | 0 | 0 | ||||
| - Other subsidies on production, receivable | D39_rec | 0 | 0 | 0 | 0 | 0 | 0 | ||||
| Table 6 Central Government: detailed classification of expenditure and consumption | |||||||||||
| €million | |||||||||||
| Description | ESA2010 code | 2012 | 2013 | 2014 | 2015 | 2016 | 2017 | ||||
| Total Expenditure | TE | 69,874 | 69,065 | 69,863 | 72,974 | 71,624 | 74,039 | ||||
| Expense | 69,055 | 67,979 | 67,876 | 71,010 | 69,454 | 71,832 | |||||
| Compensation of employees | D1 | 16,849 | 16,568 | 16,819 | 17,430 | 17,896 | 18,997 | ||||
| Of which: Related to production of own-use capital assets | 38 | 33 | 33 | 21 | 21 | 22 | |||||
| Use of goods and services plus taxes payable | P2 + D5 + D29 | 6,464 | 6,796 | 7,215 | 7,491 | 7,619 | 8,012 | ||||
| Use of goods and services [Intermediate consumption] | P2 | 6,463 | 6,796 | 7,215 | 7,491 | 7,619 | 8,012 | ||||
| Of which: Intermediate consumption of market establishments | 0 | 0 | 0 | 0 | 0 | 0 | |||||
| Taxes, payable | D5 | 1 | 0 | 0 | 0 | 0 | 0 | ||||
| Depreciation (Consumption of fixed capital) | P51c | 1,297 | 1,332 | 1,624 | 1,757 | 1,886 | 2,039 | ||||
| Of which: Depreciation by market establishments | 0 | 0 | 0 | 0 | 0 | 0 | |||||
| Interest (excluding FISIM) | D41 | 7,275 | 7,738 | 7,574 | 6,832 | 6,156 | 5,801 | ||||
| Other domestic interest payable | D41_S1 | 2,654 | 3,100 | 2,884 | 2,435 | 2,248 | 2,103 | ||||
| Interest payable to rest of world | D41_S2 | 4,621 | 4,638 | 4,690 | 4,397 | 3,908 | 3,698 | ||||
| Subsidies | D3 | 1,949 | 1,909 | 1,867 | 1,790 | 1,771 | 1,819 | ||||
| Product subsidies | D31 | 1,101 | 1,071 | 957 | 864 | 907 | 935 | ||||
| Other subsidies on production | D39 | 847 | 838 | 910 | 926 | 864 | 885 | ||||
| Social benefits | D62 + D632 | 27,904 | 27,057 | 26,834 | 27,078 | 27,025 | 27,665 | ||||
| Social benefits in cash | D62 | 23,456 | 22,885 | 22,608 | 22,645 | 22,439 | 22,706 | ||||
| Social benefits in kind (via market producers) | D632 | 4,448 | 4,172 | 4,226 | 4,433 | 4,587 | 4,959 | ||||
| Other current transfers | D7 | 4,720 | 4,668 | 4,330 | 4,146 | 4,776 | 5,135 | ||||
| Net non-life insurance premiums | D71 | 77 | 58 | 74 | 55 | 105 | 107 | ||||
| Current grants to local government | D73 _LG | 2,257 | 1,798 | 1,607 | 1,657 | 1,808 | 1,980 | ||||
| Current international cooperation | D74 | 523 | 530 | 434 | 473 | 438 | 503 | ||||
| Miscellaneous current transfers | D75 | 673 | 719 | 731 | 455 | 574 | 814 | ||||
| VAT and GNI based EU budget contribution | D76 | 1,190 | 1,564 | 1,483 | 1,507 | 1,851 | 1,731 | ||||
| VAT-based EU own resources | D761 | 191 | 202 | 203 | 215 | 219 | 262 | ||||
| GNI-based EU own resources | D762 | 999 | 1,361 | 1,280 | 1,292 | 1,632 | 1,470 | ||||
| Capital transfers | D9 | 2,598 | 1,913 | 1,613 | 4,486 | 2,324 | 2,365 | ||||
| Capital grants to local government | D9_LG | 1,357 | 1,132 | 642 | 1,300 | 1,054 | 898 | ||||
| Investment grants | D92 | 960 | 743 | 778 | 1,076 | 1,271 | 1,436 | ||||
| Other capital transfers | D99 | 280 | 38 | 193 | 2,111 | 0 | 30 | ||||
| Net acquisition of non-financial assets | P5 + NP - P51c | 819 | 1,086 | 1,986 | 1,964 | 2,170 | 2,207 | ||||
| = Gross investment in non-financial assets | P5 + NP | 2,116 | 2,418 | 3,610 | 3,721 | 4,056 | 4,246 | ||||
| Gross fixed capital formation | P51 | 2,033 | 2,335 | 3,550 | 3,721 | 3,996 | 4,291 | ||||
| Net acquisition of stocks | P52 | 83 | 83 | 60 | 60 | 60 | 60 | ||||
| Net acquisition of unproduced assets | NP | 0 | 0 | 0 | -60 | 0 | -105 | ||||
| - Consumption of fixed capital | P51c | -1,297 | -1,332 | -1,624 | -1,757 | -1,886 | -2,039 | ||||
| Net expenditure on current goods and services | P3 excl. D632 | 21,129 | 21,378 | 22,263 | 22,847 | 23,581 | 25,300 | ||||
| = Output | P1 | 24,609 | 24,695 | 25,658 | 26,678 | 27,402 | 29,047 | ||||
| - Sales of goods and services | P11+P12+P131 | -3,479 | -3,317 | -3,395 | -3,831 | -3,821 | -3,746 | ||||
| Market output (sales of market establishments) | P11 | 0 | 0 | 0 | 0 | 0 | 0 | ||||
| Output for own final use | P12 | -38 | -33 | -33 | -21 | -21 | -22 | ||||
| Incidental sales and fees of non-market establishments | P131 | -3,441 | -3,284 | -3,362 | -3,810 | -3,800 | -3,725 | ||||
| Final consumption expenditure | P3 | 25,577 | 25,550 | 26,489 | 27,279 | 28,168 | 30,259 | ||||
| = Net expenditure on current goods and services | P3 excl. D632 | 21,129 | 21,378 | 22,263 | 22,847 | 23,581 | 25,300 | ||||
| + Social transfers in kind via market producers | D632 | 4,448 | 4,172 | 4,226 | 4,433 | 4,587 | 4,959 | ||||
| made up of | |||||||||||
| Individual consumption (= social transfers in kind) | P31 (= D63) | 18,150 | 18,090 | 18,780 | 19,368 | 20,034 | 21,453 | ||||
| Social transfers in kind (via market producers) | D632 | 4,448 | 4,172 | 4,226 | 4,433 | 4,587 | 4,959 | ||||
| Social transfers in kind (provided directly by government) | D631 | 13,702 | 13,918 | 14,554 | 14,935 | 15,447 | 16,494 | ||||
| Collective consumption (= actual final consumption of government) | P32 | 7,427 | 7,460 | 7,709 | 7,911 | 8,134 | 8,807 | ||||
| Total social transfers | D62 + D63 | 41,606 | 40,975 | 41,388 | 42,013 | 42,472 | 44,159 | ||||
| Social benefits in cash | D62 | 23,456 | 22,885 | 22,608 | 22,645 | 22,439 | 22,706 | ||||
| Social transfers in kind (= individual consumption) | D63 | 18,150 | 18,090 | 18,780 | 19,368 | 20,034 | 21,453 | ||||
| Table 7 Local Government transactions: revenue, expenditure, financing and deficit | ||||||||||
| €million | ||||||||||
| Description | ESA2010 code | 2012 | 2013 | 2014 | 2015 | 2016 | 2017 | |||
| Local Government transactions | ||||||||||
| Revenue | TR | 7,361 | 6,487 | 5,669 | 6,445 | 6,516 | 6,676 | |||
| Taxes and social contributions | D2 + D5 + D91 + D61 | 1,810 | 1,733 | 1,671 | 1,633 | 1,572 | 1,522 | |||
| Taxes | D2 + D5 + D91 | 1,481 | 1,407 | 1,403 | 1,389 | 1,354 | 1,298 | |||
| Social contributions | D61 | 329 | 326 | 269 | 244 | 218 | 224 | |||
| Sales of goods and services | P1O | 1,578 | 1,551 | 1,431 | 1,519 | 1,626 | 1,779 | |||
| Investment income | D4 | 97 | 49 | 42 | 37 | 37 | 36 | |||
| Current transfer revenue (excluding taxes) | D7 | 2,302 | 1,827 | 1,651 | 1,702 | 1,856 | 2,025 | |||
| Capital transfer revenue (excluding taxes) | D9N | 1,573 | 1,328 | 874 | 1,554 | 1,425 | 1,314 | |||
| Expenditure | TE | 7,453 | 6,496 | 5,517 | 5,881 | 6,368 | 6,494 | |||
| Expense | Expense | 7,727 | 7,051 | 6,491 | 6,648 | 6,977 | 7,091 | |||
| Compensation of employees | D1 | 2,147 | 2,027 | 1,547 | 1,522 | 1,546 | 1,684 | |||
| Use of goods and services plus taxes payable | P2 + D5 + D29 | 1,879 | 1,400 | 1,722 | 1,752 | 1,905 | 1,854 | |||
| Depreciation (Consumption of fixed capital) | P51c | 1,809 | 1,833 | 1,693 | 1,758 | 1,836 | 1,907 | |||
| Interest (excluding FISIM) | D41 | 120 | 122 | 87 | 68 | 71 | 85 | |||
| Subsidies | D3 | 0 | 0 | 0 | 0 | 0 | 0 | |||
| Social benefits | D62 + D632 | 1,550 | 1,469 | 1,242 | 1,345 | 1,412 | 1,403 | |||
| Other current transfers | D7 | 48 | 48 | 40 | 41 | 40 | 22 | |||
| Capital transfers | D9 | 174 | 153 | 161 | 162 | 167 | 136 | |||
| Net operating balance | NOB | -366 | -564 | -822 | -203 | -461 | -416 | |||
| Net acquisition of non-financial assets | P5 + NP - P51c | -274 | -556 | -975 | -767 | -609 | -598 | |||
| Local Government Surplus/Deficit | B9 | -93 | -9 | 153 | 564 | 148 | 182 | |||
| Table 8 Local Government: detailed classification of revenue and output | |||||||||||
| €million | |||||||||||
| Description | ESA2010 code | 2012 | 2013 | 2014 | 2015 | 2016 | 2017 | ||||
| Total Revenue | TR | 7,361 | 6,487 | 5,669 | 6,445 | 6,516 | 6,676 | ||||
| Taxes and social contributions | 1,810 | 1,733 | 1,671 | 1,633 | 1,572 | 1,522 | |||||
| Taxes | D2 + D5 + D91 | 1,481 | 1,407 | 1,403 | 1,389 | 1,354 | 1,298 | ||||
| Indirect taxes (taxes on production and imports) | D2 | 1,478 | 1,407 | 1,403 | 1,389 | 1,354 | 1,298 | ||||
| Other taxes on production | D29 | 1,478 | 1,407 | 1,403 | 1,389 | 1,354 | 1,298 | ||||
| Capital taxes | D91 | 3 | 0 | 0 | 0 | 0 | 0 | ||||
| Social contributions | D61 | 329 | 326 | 269 | 244 | 218 | 224 | ||||
| Actual social contributions | D611 + D613 | 190 | 186 | 130 | 126 | 82 | 100 | ||||
| Employers' imputed social contributions | D612 | 139 | 140 | 139 | 118 | 136 | 123 | ||||
| Sales of goods and services | P1O | 1,578 | 1,551 | 1,431 | 1,519 | 1,626 | 1,779 | ||||
| Sales of market establishments (= market output) | P11 | 956 | 991 | 1,039 | 1,117 | 1,221 | 1,326 | ||||
| Imputed sales related to production of own-use capital assets (= output for own final use) | P12 | 0 | 0 | 0 | 0 | 0 | 0 | ||||
| Incidental sales and fees of non-market establishments | P131 | 622 | 560 | 391 | 402 | 405 | 453 | ||||
| Investment income | D4 | 97 | 49 | 42 | 37 | 37 | 36 | ||||
| Interest (excluding FISIM) | D41 | 97 | 49 | 42 | 37 | 37 | 36 | ||||
| in which received from Central Government | D41_CG | 0 | 0 | 0 | 0 | 0 | 0 | ||||
| Dividends | D42 | 0 | 0 | 0 | 0 | 0 | 0 | ||||
| Current transfer revenue | D39 + D7 | 2,302 | 1,827 | 1,651 | 1,702 | 1,856 | 2,025 | ||||
| Subsidies | D39 | 0 | 0 | 0 | 0 | 0 | 0 | ||||
| Other current transfers | D7 | 2,302 | 1,827 | 1,651 | 1,702 | 1,856 | 2,025 | ||||
| Grants from central government | D73 | 2,257 | 1,798 | 1,607 | 1,657 | 1,808 | 1,980 | ||||
| Other Domestic - Current | D7N_S1 | 45 | 29 | 44 | 45 | 49 | 44 | ||||
| Capital transfer revenue | D9N | 1,573 | 1,328 | 874 | 1,554 | 1,425 | 1,314 | ||||
| Grants from central government | D9N_CG | 1,357 | 1,132 | 642 | 1,300 | 1,054 | 898 | ||||
| Other capital transfers receivable | D99 | 216 | 196 | 232 | 254 | 371 | 416 | ||||
| Output | P1 | 6,189 | 5,634 | 5,367 | 5,499 | 5,825 | 6,064 | ||||
| Market output (sales of market establishments) | P11 | 956 | 991 | 1,039 | 1,117 | 1,221 | 1,326 | ||||
| Output for own final use | P12 | 0 | 0 | 0 | 0 | 0 | 0 | ||||
| Non-market output | P13 | 5,233 | 4,644 | 4,327 | 4,382 | 4,604 | 4,738 | ||||
| = Non-market compensation of employees | D1_nonmarket | 2,147 | 2,027 | 1,547 | 1,522 | 1,546 | 1,684 | ||||
| = Total compensation of employees | D1 | 2,147 | 2,027 | 1,547 | 1,522 | 1,546 | 1,684 | ||||
| - Compensation of employees of market establishments | D1_market | 0 | 0 | 0 | 0 | 0 | 0 | ||||
| - Compensation related to production of own-use capital assets | D1_own-use | 0 | 0 | 0 | 0 | 0 | 0 | ||||
| + Non-market intermediate consumption | P2_nonmarket | 1,667 | 1,181 | 1,503 | 1,527 | 1,659 | 1,602 | ||||
| = Total intermediate consumption | P2 | 1,879 | 1,400 | 1,722 | 1,752 | 1,905 | 1,854 | ||||
| - Intermediate consumption of market establishments | P2_market | -212 | -219 | -219 | -225 | -247 | -252 | ||||
| - Intermediate consumption related to production of own-use capital assets | P2_own-use | 0 | 0 | 0 | 0 | 0 | 0 | ||||
| + Non-market consumption of fixed capital | P51c_nonmarket | 1,420 | 1,436 | 1,278 | 1,333 | 1,399 | 1,453 | ||||
| = Total consumption of fixed capital | P51c | 1,809 | 1,833 | 1,693 | 1,758 | 1,836 | 1,907 | ||||
| - Consumption of fixed capital by market establishments | P51c_market | -390 | -397 | -415 | -425 | -437 | -454 | ||||
| - Consumption of fixed capital related to production of own-use capital assets | P51c_own-use | 0 | 0 | 0 | 0 | 0 | 0 | ||||
| + Other taxes on production, payable | D29_pay | 0 | 0 | 0 | 0 | 0 | 0 | ||||
| - Other subsidies on production, receivable | D39_rec | 0 | 0 | 0 | 0 | 0 | 0 | ||||
| Table 9 Local Government: detailed classification of expenditure and consumption | |||||||||||
| €million | |||||||||||
| Description | ESA2010 code | 2012 | 2013 | 2014 | 2015 | 2016 | 2017 | ||||
| Total Expenditure | TE | 7,453 | 6,496 | 5,517 | 5,881 | 6,368 | 6,494 | ||||
| Expense | 7,727 | 7,051 | 6,491 | 6,648 | 6,977 | 7,091 | |||||
| Compensation of employees | D1 | 2,147 | 2,027 | 1,547 | 1,522 | 1,546 | 1,684 | ||||
| Of which: Related to production of own-use capital assets | 0 | 0 | 0 | 0 | 0 | 0 | |||||
| Use of goods and services plus taxes payable | P2 + D5 + D29 | 1,879 | 1,400 | 1,722 | 1,752 | 1,905 | 1,854 | ||||
| Use of goods and services [Intermediate consumption] | P2 | 1,879 | 1,400 | 1,722 | 1,752 | 1,905 | 1,854 | ||||
| Of which: Intermediate consumption of market establishments | 212 | 219 | 219 | 225 | 247 | 252 | |||||
| Taxes, payable | D5 + D29 | 0 | 0 | 0 | 0 | 0 | 0 | ||||
| Depreciation (Consumption of fixed capital) | P51c | 1,809 | 1,833 | 1,693 | 1,758 | 1,836 | 1,907 | ||||
| Of which: Depreciation by market establishments | 390 | 397 | 415 | 425 | 437 | 454 | |||||
| Interest (excluding FISIM) | D41 | 120 | 122 | 87 | 68 | 71 | 85 | ||||
| Interest payable to central government | D41_CG | 97 | 99 | 72 | 51 | 62 | 76 | ||||
| Other domestic interest payable | D41_S1 | 22 | 22 | 15 | 17 | 9 | 8 | ||||
| Subsidies | D3 | 0 | 0 | 0 | 0 | 0 | 0 | ||||
| Social benefits | D62 + D632 | 1,550 | 1,469 | 1,242 | 1,345 | 1,412 | 1,403 | ||||
| Social benefits in cash | D62 | 779 | 656 | 366 | 366 | 302 | 302 | ||||
| Social benefits in kind (via market producers) | D632 | 771 | 814 | 876 | 979 | 1,110 | 1,102 | ||||
| Other current transfers | D7 | 48 | 48 | 40 | 41 | 40 | 22 | ||||
| Grants to central government | D73_CG | 3 | 3 | 3 | 3 | 3 | 4 | ||||
| Miscellaneous current transfers | D75 | 45 | 45 | 37 | 38 | 37 | 18 | ||||
| Capital transfers | D9 | 174 | 153 | 161 | 162 | 167 | 136 | ||||
| Investment grants | D92 | 174 | 153 | 161 | 162 | 167 | 136 | ||||
| Net acquisition of non-financial assets | P5 + NP - P51c | -274 | -556 | -975 | -767 | -609 | -598 | ||||
| = Gross investment in non-financial assets | P5 + NP | 1,536 | 1,278 | 718 | 990 | 1,228 | 1,309 | ||||
| Gross fixed capital formation | P51 | 1,536 | 1,278 | 718 | 931 | 1,228 | 1,309 | ||||
| Net acquisition of stocks | P52 | 0 | 0 | 0 | 0 | 0 | 0 | ||||
| Net acquisition of unproduced assets | NP | 0 | 0 | 0 | 60 | 0 | 0 | ||||
| - Consumption of fixed capital | P51c | -1,809 | -1,833 | -1,693 | -1,758 | -1,836 | -1,907 | ||||
| Net expenditure on current goods and services | P3 excl. D632 | 4,611 | 4,084 | 3,936 | 3,979 | 4,199 | 4,285 | ||||
| = Output | P1 | 6,189 | 5,634 | 5,367 | 5,499 | 5,825 | 6,064 | ||||
| - Sales of goods and services | P11+P12+P131 | -1,578 | -1,551 | -1,431 | -1,519 | -1,626 | -1,779 | ||||
| Market output (sales of market establishments) | P11 | -956 | -991 | -1,039 | -1,117 | -1,221 | -1,326 | ||||
| Output for own final use | P12 | 0 | 0 | 0 | 0 | 0 | 0 | ||||
| Incidental sales and fees of non-market establishments | P131 | -622 | -560 | -391 | -402 | -405 | -453 | ||||
| Final consumption expenditure | P3 | 5,382 | 4,897 | 4,812 | 4,958 | 5,309 | 5,387 | ||||
| = Net expenditure on current goods and services | P3 excl. D632 | 4,611 | 4,084 | 3,936 | 3,979 | 4,199 | 4,285 | ||||
| + Social transfers in kind via market producers | D632 | 771 | 814 | 876 | 979 | 1,110 | 1,102 | ||||
| made up of | |||||||||||
| Individual consumption (= social transfers in kind) | P31 (= D63) | 2,489 | 2,450 | 2,284 | 2,422 | 2,594 | 2,641 | ||||
| Social transfers in kind (via market producers) | D632 | 771 | 814 | 876 | 979 | 1,110 | 1,102 | ||||
| Social transfers in kind (provided directly by government) | D631 | 1,718 | 1,636 | 1,408 | 1,443 | 1,484 | 1,539 | ||||
| Collective consumption (= actual final consumption of government) | P32 | 2,893 | 2,448 | 2,528 | 2,536 | 2,715 | 2,746 | ||||
| Total social transfers | D62 + D63 | 3,268 | 3,105 | 2,650 | 2,788 | 2,896 | 2,943 | ||||
| Social benefits in cash | D62 | 779 | 656 | 366 | 366 | 302 | 302 | ||||
| Social transfers in kind (= individual consumption) | D63 | 2,489 | 2,450 | 2,284 | 2,422 | 2,594 | 2,641 | ||||
Introduction
This release comprises the latest official publication by CSO of annual Government Income and Expenditure (GIE) results for years 2012 to 2017. The results for 2017 are still provisional estimates and replace the data published as part of the Excessive Deficit Procedure notification on 16 April 2018. The data published in this series are fully consistent with the National Income and Expenditure 2017.
The tables provide detailed revenue and expenditure data for general government and its two subsectors, namely central and local government. A full time series of these data back to 2000 are available on Statbank. Data back to 1995 for all EU Member States are available on Eurostat’s data base, located here. Note: These tables have replaced what were tables 19, 20 and 21 of the annual National Income and Expenditure (NIE) publication since NIE 2015.
The full suite of GFS tables are available on the CSO website here and CSO Statbank here.
Reclassification of Approved Housing Bodies to local government sub-sector (S.1313)
As of March 2018, 14 Approved Housing Bodies (AHBs) have been reclassified to the local government sub-sector (S.1313) from the Non-Profit Institution Serving Households Sector (S.15). In addition the housing activities of another non-profit organisation have been re-routed to the local government sub-sector.
At the 2017 EDP dialogue visit to Ireland, following a discussion on social housing and the role of AHBs, Eurostat set the action point “As regards approved housing bodies, the issue of their classification will need to be revisited in the light of ESA 2010, taking into account the discussion held and the points raised by Eurostat”. Eurostat requested the CSO to review the classification of the AHBs, expressing the view that under ESA 2010 the role of government financing should be given greater weight in the classification decision than had been the case at the time of the 2014 review.
The initial review carried out during 2017 focussed on the largest AHBs. This review resulted in 14 bodies whose predominant activity is the provision of social housing being reclassified to the local government sub-sector. One other organisation, not predominantly involved in housing, remained classified in the Non-Profit Sector Serving Households Sector (S.15). However, its housing activity has been re-routed to the local government sub-sector. A further review of the remaining AHBs will be progressed during 2018.
Details on the reclassification can be found here.
Impact on local government sub-sector
The inclusion of these AHBs into S.1313 means that their income, expenditure, assets and liabilities are added to this subsector. However, as much of their income is received from the local and central government subsectors, this income has to be consolidated as appropriate. Likewise, expenditure which has a counterparty in local or central government has been consolidated as appropriate. Only additional income from other sectors of the economy has been added to local government income (e.g. receipt of rent from tenants). The main additional expenditure relates to the compensation of employees, intermediate consumption and capital formation.
The net lending/borrowing (B.9) of these organisations forms part of the net/lending borrowing (B.9) of the local government sector. For the current release this impact is recorded only for the years 2014 to 2017 (i.e. the years which are the subject of the EDP notification). For years prior to 2014, the full impact of the inclusion of AHBs has not been estimated. The only revisions to these years is the re-coding of Capital Transfers (D.92) from local government to capital formation (P.51g) of local government. Thus the total revenue, expenditure and net lending/borrowing of local government are unchanged.
GDP figures used in publication
The GDP figures used in the current publication are consistent with those published in the National Income and Expenditure 2017 and the Quarterly National Accounts publication both published on 19 July 2018.
Revisions to General Government Deficit/Surplus (GG Deficit/Surplus)
Historical estimates of the general government deficit have been revised since April 2018. The changes reflect the availability of more up-to-date and detailed data sources.
Government Finance Statistics – Concepts and Definitions
Government Finance Statistics (GFS) form the basis for fiscal monitoring in Europe, in particular in relation to the Excessive Deficit Procedure (EDP).
European GFS, including EDP statistics, are produced according to the legally binding accounting rules of the European System of Accounts (ESA2010). The Manual on Government Debt and Deficit (MGDD) provides further guidance on the implementation of ESA 2010 in the context of GFS.
EU Member States are required to report government deficit/surplus and debt data biannually under the EDP (before 1 April and 1 October in year N) for years N-4 to N-1 calendar years as well as a forecast for the current year. The data are reported in harmonised tables, which provide a consistent framework for the presentation of this data by Member States. The tables provide a structure for linking national budgetary aggregates with government deficit and debt.
Detailed statistics on government revenue and expenditure are also provided to Eurostat under the ESA transmission programme. For annual data the main tables reported are:
Table 0200 Revenue and expenditure of general government and sub-sectors
Tables 0900 and 0999 Taxes and national tax list
These data are available on the Eurostat website here.
Modified Gross National Income (GNI*) is equal to Gross National Income at current market prices less the factor income of redomiciled companies, less depreciation on research and development related intellectual property imports and less depreciation on aircraft related to aircraft leasing.
Definition of General Government and its subsectors
The general government sector of the economy, is defined in ESA2010 paragraph 2.111: as “institutional units which are non-market producers whose output is intended for individual and collective consumption, and are financed by compulsory payments made by units belonging to other sectors, and institutional units principally engaged in the redistribution of national income and wealth.” General government comprises the sub-sectors central government (S.1311), state government (S.1312 – which does not apply in Ireland), local government (S.1313), and social security funds (S.1314 – which does not apply in Ireland).
General Government Deficit/Surplus (GG Deficit/Surplus) is the standard European measure of the fiscal balance, which is used to monitor compliance with the Stability and Growth Pact.
This measure is by definition equal to both Total Revenue (TR) less Total Expenditure (TE), and Net Acquisition of Financial Assets less Net Incurrence of Liabilities as shown in the GFS release.
A listing of some of the main items included in this release is shown below
Main Components of General Government Expenditure and Revenue
P.2 Intermediate consumption – value of goods and services used in the process of production, excluding fixed assets
P.5 Gross capital formation
P.51g Gross fixed capital formation - acquisitions, less disposals, of fixed assets during a given period plus certain additions to the value of non-produced assets realised by productive activity. Fixed assets are tangible or intangible assets produced as outputs from processes of production that are themselves used repeatedly, or continuously, in processes of production for more than one year
P.51c Consumption of fixed capital - the amount of fixed assets used up, during the period under consideration, as a result of normal wear and tear and foreseeable obsolescence, including a provision for losses of fixed assets as a result of accidental damage which can be insured against.
P.52 Changes in inventories
P.53 Acquisitions less disposals of valuables
D.1 Compensation of employees – the total remuneration of government employees
D.29 Other taxes on production (payable) all taxes that enterprises incur as a result of engaging in production, independently of the quantity or value of the goods and services produced or sold. These include taxes on use or ownership of land or buildings, taxes on use of fixed assets, taxes on total wage bill and payroll, taxes on international transactions related to production.
D.3 Subsidies (payable) - current unrequited payments which general government or the institutions of the European Union make to resident producers, with the objective of influencing their levels of production, their prices or the remuneration of the factors of production
D.4 Property income accrues when the owners of financial assets and natural resources put them at the disposal of other units of the economy. The income payable for the use of financial assets is called investment income, while that payable for the use of a natural resource is called rent. Property income is the sum of investment income and rent.
D.41 Interest receivable by the owners of a financial asset for putting it at the disposal of another institutional unit - applies to deposits (AF.2), debt securities (AF.3), loans (AF.4) and other accounts payable (AF.8)
D.42 Dividends receivable by the owners of share equities. Dividends exclude "super dividends" which arise where the dividend paid is large relative to the recent level of dividends and earnings. Super dividends are recorded as withdrawal of equity (F.5). This arises, for example, in the case of dividends paid by the Central Bank in 2015.
D.45 Rent of a natural resource – income receivable by the owner of a natural resource for putting the resource at the disposal of another party.
D.5 Current taxes on income, wealth, etc., (payable) - all compulsory, unrequited payments, in cash or in kind, levied periodically by general government and by the rest of the world on the income and wealth of units in the economy, and some periodic taxes which are assessed neither on income nor wealth
D.6 Social contributions - transfers to households, in cash or in kind, intended to relieve them from the financial burden of a number of risks or needs.
D.7 Other current transfers – includes VAT and GNI based EU budget contributions, current transfers between subsectors of government, current international co-operation and current transfers to households and non-profit institutions.
D.9 Capital transfers - involve the acquisition or disposal of an asset, or assets, by at least one of the parties to the transaction. Includes capital taxes and investment grants.
 Hide Background Notes
Scan the QR code below to view this release online or go to
http://www.cso.ie/en/releasesandpublications/er/giea/governmentincomeandexpenditurejuly2018/
 Show Table 1 General Government Transactions: Revenue, Expenditure and Deficit
 Hide Table 1 General Government Transactions: Revenue, Expenditure and Deficit