
| General Government Deficit, Total Revenue, Total Expenditure and GDP | |||||||
| GG Deficit | Total Revenue | Total Expenditure | GDP | ||||
| End of year | €m | % GDP | €m | % GDP | €m | % GDP | €m |
| 2010 | -53,677 | -32.1 | 55,407 | 33.2 | 109,084 | 65.3 | 167,124 |
| 2011 | -21,842 | -12.6 | 57,716 | 33.3 | 79,557 | 46.0 | 173,070 |
| 2012 | -14,014 | -8.0 | 59,493 | 33.9 | 73,506 | 41.8 | 175,754 |
| 2013 | -10,193 | -5.7 | 61,522 | 34.1 | 71,715 | 39.8 | 180,209 |
| 2014 | -7,195 | -3.7 | 65,804 | 34.1 | 73,000 | 37.8 | 193,160 |
| 2015 | -4,621 | -1.8 | 70,622 | 27.6 | 75,243 | 29.4 | 255,815 |
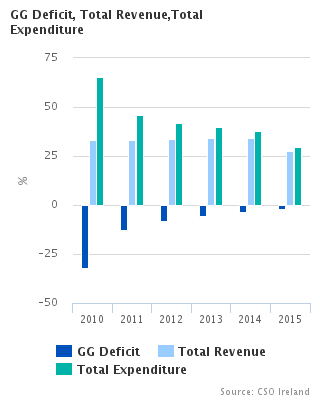
In 2015, the General Government deficit was -€4.6 billion, or -1.8% of GDP. This was an improvement on the 2014 position of -€7.2 billion (-3.7% of GDP) and is mainly due to two factors, namely an increase of over 7% in government revenues which grew from €65.8 billion in 2014 to €70. 6 billion in 2015, and a substantial increase in GDP in 2015. The increase in revenues was partially offset by an increase of €2.2 billion in expenditures.
The factors driving growth in government revenue for 2015 were primarily increases in tax and social contribution revenues partially offset by reductions to investment income. Some €4.3 billion was raised in additional taxes in 2015 comprising €3 billion of direct taxes and €1.3 billion of indirect taxes. The increase in expenditure is mainly due to a once off capital injection expenditure which arose when the government converted part of its holdings in preference shares in AIB to ordinary shares in late 2015. The conversion of these shares is classified as expenditure of government. Further details are available in the background notes to this release.
In 2015, Central Government collected €67 billion, or 95%, of total revenue in 2015. The balance was generated by local government in the form of commercial rates, social housing rents and other transfers.
€72.3 billion was spent by Central Government in 2015. This resulted in a deficit in Central Government of -€5.3 billion. Local Government recorded a surplus of €697 million in 2015. This was primarily due to a capital transfer from the exchequer to local authorities to redeem water related loans.
These balances combine to make up the deficit for General Government of - €4.6 billion, or -1.8% of GDP in 2015.
The government deficit figure for 2015 has been revised since first estimates were published in April from -€4.9 billion to -€4.6 billion. This revision is mainly due to methodological or technical changes to the calculation of compensation of employees and financial intermediation services indirectly measured (FISIM) together with the availability of further data from audited accounts. Combined with the GDP revision, the deficit now stands at 1.8% of GDP for 2015.
|
National Accounts are compiled in the EU according to the European System of National and Regional Accounts (ESA2010) framework. These Government Income and Expenditure 2015 results are fully aligned with the National Income and Expenditure 2015 and Quarterly National Accounts Q1 2016, published on 12 July 2016. These have been updated since the publication of results for the Excessive Deficit Procedure (EDP) notification in April. |
| Table 1 General Government transactions: revenue, expenditure and deficit | ||||||||||
| €million | ||||||||||
| Description | ESA2010 code | 2010 | 2011 | 2012 | 2013 | 2014 | 2015 | |||
| General Government transactions | ||||||||||
| Revenue | TR | 55,407 | 57,716 | 59,493 | 61,522 | 65,804 | 70,622 | |||
| Taxes and social contributions | D2 + D5 + D91 + D61 | 47,377 | 49,231 | 50,803 | 52,908 | 57,432 | 62,124 | |||
| Taxes | D2 + D5 + D91 | 37,891 | 38,863 | 40,929 | 42,499 | 46,449 | 50,736 | |||
| Social contributions | D61 | 9,485 | 10,368 | 9,874 | 10,410 | 10,983 | 11,388 | |||
| Sales of goods and services | P1O | 5,284 | 5,163 | 5,113 | 4,938 | 4,705 | 5,296 | |||
| Investment income | D4 | 2,112 | 2,454 | 3,027 | 3,181 | 2,964 | 2,661 | |||
| Current transfer revenue (excluding taxes) | D7 | 313 | 258 | 250 | 196 | 298 | 253 | |||
| Capital transfer revenue (excluding taxes) | D9N | 322 | 610 | 299 | 298 | 405 | 288 | |||
| Expenditure | TE | 109,084 | 79,557 | 73,506 | 71,715 | 73,000 | 75,243 | |||
| Expense | Expense | 106,786 | 78,585 | 73,254 | 72,092 | 72,201 | 74,464 | |||
| Compensation of employees | D1 | 19,293 | 19,389 | 18,996 | 18,594 | 18,344 | 18,874 | |||
| Use of goods and services plus taxes payable | P2 + D5 + D29 | 9,168 | 8,801 | 8,343 | 8,196 | 8,906 | 9,193 | |||
| Depreciation (Consumption of fixed capital) | P51c | 3,186 | 3,305 | 3,301 | 3,267 | 3,433 | 3,627 | |||
| Interest (excluding FISIM) | D41 | 4,743 | 5,719 | 7,179 | 7,614 | 7,449 | 6,693 | |||
| Subsidies | D3 | 1,828 | 1,725 | 1,921 | 1,913 | 1,853 | 1,785 | |||
| Social benefits | D62 + D632 | 28,774 | 28,827 | 29,476 | 28,583 | 28,209 | 28,249 | |||
| Other current transfers | D7 | 2,664 | 2,598 | 2,519 | 2,892 | 2,773 | 2,565 | |||
| Capital transfers | D9 | 37,130 | 8,222 | 1,519 | 1,033 | 1,234 | 3,478 | |||
| Net operating balance | NOB | -51,381 | -20,871 | -13,762 | -10,570 | -6,397 | -3,842 | |||
| Net acquisition of non-financial assets | P5 + NP - P51c | 2,298 | 972 | 252 | -377 | 798 | 779 | |||
| General Government Surplus/Deficit | B9 | -53,677 | -21,842 | -14,014 | -10,193 | -7,195 | -4,621 | |||
| General Government Surplus/Deficit (% of GDP) | -32.1 | -12.6 | -8.0 | -5.7 | -3.7 | -1.8 | ||||
| Table 2 General Government: detailed classification of revenue and output | |||||||||||
| €million | |||||||||||
| Description | ESA2010 code | 2010 | 2011 | 2012 | 2013 | 2014 | 2015 | ||||
| Total Revenue | TR | 55,407 | 57,716 | 59,493 | 61,522 | 65,804 | 70,622 | ||||
| Taxes and social contributions | 47,377 | 49,231 | 50,803 | 52,908 | 57,432 | 62,124 | |||||
| Taxes | D2 + D5 + D91 | 37,891 | 38,863 | 40,929 | 42,499 | 46,449 | 50,736 | ||||
| Indirect taxes (taxes on production and imports) | D2 | 18,063 | 17,779 | 18,344 | 19,285 | 21,197 | 22,455 | ||||
| Taxes on products | D21 | 16,083 | 15,705 | 16,099 | 16,749 | 18,240 | 19,431 | ||||
| of which Value-Added Tax | D211 | 10,067 | 9,755 | 10,219 | 10,372 | 11,521 | 11,955 | ||||
| Other taxes on production | D29 | 1,981 | 2,074 | 2,245 | 2,536 | 2,957 | 3,023 | ||||
| Direct taxes | D5 | 19,583 | 20,842 | 22,300 | 22,935 | 24,894 | 27,881 | ||||
| Taxes on income, profits and capital gains | D51 | 18,617 | 19,435 | 20,837 | 21,298 | 23,016 | 26,604 | ||||
| Other current direct taxes | D59 | 966 | 1,407 | 1,463 | 1,637 | 1,878 | 1,276 | ||||
| Capital taxes | D91 | 245 | 242 | 285 | 278 | 359 | 401 | ||||
| Social contributions | D61 | 9,485 | 10,368 | 9,874 | 10,410 | 10,983 | 11,388 | ||||
| Actual social contributions | D611 + D613 | 8,432 | 9,039 | 8,482 | 9,020 | 9,581 | 10,022 | ||||
| PRSI receipts | D611 + D613(pt) | 6,702 | 7,268 | 6,799 | 7,299 | 7,947 | 8,512 | ||||
| Government employees' social contributions | D613(pt) | 1,730 | 1,770 | 1,682 | 1,721 | 1,633 | 1,510 | ||||
| Employers' imputed social contributions | D612 | 1,053 | 1,330 | 1,393 | 1,390 | 1,403 | 1,366 | ||||
| Sales of goods and services | P1O | 5,284 | 5,163 | 5,113 | 4,938 | 4,705 | 5,296 | ||||
| Sales of market establishments (= market output) | P11 | 877 | 905 | 978 | 1,048 | 1,137 | 1,245 | ||||
| Imputed sales related to production of own-use capital assets (= output for own final use) | P12 | 58 | 58 | 38 | 33 | 33 | 21 | ||||
| Incidental sales and fees of non-market establishments | P131 | 4,349 | 4,200 | 4,097 | 3,857 | 3,535 | 4,031 | ||||
| Investment income | D4 | 2,112 | 2,454 | 3,027 | 3,181 | 2,964 | 2,661 | ||||
| Interest (excluding FISIM) | D41 | 868 | 1,374 | 1,595 | 1,405 | 1,037 | 715 | ||||
| Dividends | D42 | 1,241 | 1,077 | 1,428 | 1,772 | 1,923 | 1,942 | ||||
| Current transfer revenue | D39 + D7 | 313 | 258 | 250 | 196 | 298 | 253 | ||||
| Subsidies | D39 | 0 | 0 | 0 | 0 | 0 | 0 | ||||
| Other current transfers | D7 | 313 | 258 | 250 | 196 | 298 | 253 | ||||
| Non-life insurance claims | D72 | 24 | 13 | 8 | 9 | 9 | 8 | ||||
| Other Domestic - Current | D7N_S1 | 190 | 204 | 200 | 131 | 239 | 193 | ||||
| From Rest of World - Current | D7N_S2 | 99 | 41 | 42 | 57 | 51 | 52 | ||||
| Capital transfer revenue | D9N | 322 | 610 | 299 | 298 | 405 | 288 | ||||
| Output | P1 | 31,916 | 31,788 | 31,014 | 30,488 | 31,185 | 32,281 | ||||
| Market output (sales of market establishments) | P11 | 877 | 905 | 978 | 1,048 | 1,137 | 1,245 | ||||
| Output for own final use | P12 | 58 | 58 | 38 | 33 | 33 | 21 | ||||
| Non-market output | P13 | 30,980 | 30,825 | 29,998 | 29,408 | 30,015 | 31,016 | ||||
| = Non-market compensation of employees | D1_nonmarket | 19,235 | 19,331 | 18,958 | 18,561 | 18,311 | 18,854 | ||||
| = Total compensation of employees | D1 | 19,293 | 19,389 | 18,996 | 18,594 | 18,344 | 18,874 | ||||
| - Compensation of employees of market establishments | D1_market | ||||||||||
| - Compensation related to production of own-use capital assets | D1_own-use | -58 | -58 | -38 | -33 | -33 | -21 | ||||
| + Non-market intermediate consumption | P2_nonmarket | 8,944 | 8,573 | 8,129 | 7,976 | 8,686 | 8,974 | ||||
| = Total intermediate consumption | P2 | 9,167 | 8,800 | 8,342 | 8,196 | 8,906 | 9,193 | ||||
| - Intermediate consumption of market establishments | P2_market | -224 | -227 | -212 | -219 | -219 | -219 | ||||
| - Intermediate consumption related to production of own-use capital assets | P2_own-use | ||||||||||
| + Non-market consumption of fixed capital | P51c_nonmarket | 2,802 | 2,920 | 2,911 | 2,870 | 3,018 | 3,188 | ||||
| = Total consumption of fixed capital | P51c | 3,186 | 3,305 | 3,301 | 3,267 | 3,433 | 3,627 | ||||
| - Consumption of fixed capital by market establishments | P51c_market | -384 | -385 | -389 | -397 | -415 | -439 | ||||
| - Consumption of fixed capital related to production of own-use capital assets | P51c_own-use | ||||||||||
| + Other taxes on production, payable | D29_pay | 0 | 0 | 0 | 0 | 0 | 0 | ||||
| - Other subsidies on production, receivable | D39_rec | 0 | 0 | 0 | 0 | 0 | 0 | ||||
| Table 3 General Government: detailed classification of expenditure and consumption | |||||||||||
| €million | |||||||||||
| Description | ESA2010 code | 2010 | 2011 | 2012 | 2013 | 2014 | 2015 | ||||
| Total Expenditure | TE | 109,084 | 79,557 | 73,506 | 71,715 | 73,000 | 75,243 | ||||
| Expense | 106,786 | 78,585 | 73,254 | 72,092 | 72,201 | 74,464 | |||||
| Compensation of employees | D1 | 19,293 | 19,389 | 18,996 | 18,594 | 18,344 | 18,874 | ||||
| Of which: Related to production of own-use capital assets | 58 | 58 | 38 | 33 | 33 | 21 | |||||
| Use of goods and services plus taxes payable | P2 + D5 + D29 | 9,168 | 8,801 | 8,343 | 8,196 | 8,906 | 9,193 | ||||
| Use of goods and services [Intermediate consumption] | P2 | 9,167 | 8,800 | 8,342 | 8,196 | 8,906 | 9,193 | ||||
| Of which: Intermediate consumption of market establishments | 224 | 227 | 212 | 219 | 219 | 219 | |||||
| Taxes, payable | D5 | 1 | 1 | 1 | 0 | 0 | 0 | ||||
| Depreciation (Consumption of fixed capital) | P51c | 3,186 | 3,305 | 3,301 | 3,267 | 3,433 | 3,627 | ||||
| Of which: Depreciation by market establishments | 384 | 385 | 389 | 397 | 415 | 439 | |||||
| Interest (excluding FISIM) | D41 | 4,743 | 5,719 | 7,179 | 7,614 | 7,449 | 6,693 | ||||
| Other domestic interest payable | D41_S1 | 1,335 | 1,370 | 2,558 | 2,976 | 2,759 | 2,297 | ||||
| Interest payable to rest of world | D41_S2 | 3,408 | 4,349 | 4,621 | 4,638 | 4,690 | 4,397 | ||||
| Subsidies | D3 | 1,828 | 1,725 | 1,921 | 1,913 | 1,853 | 1,785 | ||||
| Product subsidies | D31 | 1,083 | 1,060 | 1,063 | 1,071 | 957 | 882 | ||||
| Other subsidies on production | D39 | 745 | 665 | 858 | 842 | 897 | 903 | ||||
| Social benefits | D62 + D632 | 28,774 | 28,827 | 29,476 | 28,583 | 28,209 | 28,249 | ||||
| Social benefits in cash | D62 | 23,818 | 23,868 | 24,235 | 23,540 | 23,014 | 23,132 | ||||
| Social benefits in kind (via market producers) | D632 | 4,956 | 4,958 | 5,241 | 5,043 | 5,194 | 5,117 | ||||
| Other current transfers | D7 | 2,664 | 2,598 | 2,519 | 2,892 | 2,773 | 2,565 | ||||
| Net non-life insurance premiums | D71 | 83 | 47 | 77 | 58 | 58 | 57 | ||||
| Current international cooperation | D74 | 547 | 547 | 546 | 531 | 435 | 474 | ||||
| Miscellaneous current transfers | D75 | 867 | 854 | 706 | 748 | 798 | 526 | ||||
| VAT and GNI based EU budget contribution | D76 | 1,167 | 1,150 | 1,190 | 1,556 | 1,483 | 1,507 | ||||
| VAT-based EU own resources | D761 | 194 | 194 | 191 | 194 | 203 | 215 | ||||
| GNI-based EU own resources | D762 | 973 | 956 | 999 | 1,361 | 1,280 | 1,293 | ||||
| Capital transfers | D9 | 37,130 | 8,222 | 1,519 | 1,033 | 1,234 | 3,478 | ||||
| Investment grants | D92 | 1,302 | 1,101 | 1,239 | 995 | 1,041 | 1,367 | ||||
| Other capital transfers | D99 | 35,828 | 7,121 | 280 | 38 | 193 | 2,111 | ||||
| Net acquisition of non-financial assets | P5 + NP - P51c | 2,298 | 972 | 252 | -377 | 798 | 779 | ||||
| = Gross investment in non-financial assets | P5 + NP | 5,484 | 4,277 | 3,553 | 2,890 | 4,231 | 4,406 | ||||
| Gross fixed capital formation | P51 | 5,564 | 4,166 | 3,470 | 3,530 | 4,171 | 4,346 | ||||
| Net acquisition of stocks | P52 | -80 | 111 | 83 | 83 | 60 | 60 | ||||
| Net acquisition of unproduced assets | NP | 0 | 0 | 0 | -723 | 0 | 0 | ||||
| - Consumption of fixed capital | P51c | -3,186 | -3,305 | -3,301 | -3,267 | -3,433 | -3,627 | ||||
| Net expenditure on current goods and services | P3 excl. D632 | 26,631 | 26,625 | 25,901 | 25,550 | 26,479 | 26,985 | ||||
| = Output | P1 | 31,916 | 31,788 | 31,014 | 30,488 | 31,185 | 32,281 | ||||
| - Sales of goods and services | P11+P12+P131 | -5,284 | -5,163 | -5,113 | -4,938 | -4,705 | -5,296 | ||||
| Market output (sales of market establishments) | P11 | -877 | -905 | -978 | -1,048 | -1,137 | -1,245 | ||||
| Output for own final use | P12 | -58 | -58 | -38 | -33 | -33 | -21 | ||||
| Incidental sales and fees of non-market establishments | P131 | -4,349 | -4,200 | -4,097 | -3,857 | -3,535 | -4,031 | ||||
| Final consumption expenditure | P3 | 31,587 | 31,583 | 31,142 | 30,593 | 31,674 | 32,101 | ||||
| = Net expenditure on current goods and services | P3 excl. D632 | 26,631 | 26,625 | 25,901 | 25,550 | 26,479 | 26,985 | ||||
| + Social transfers in kind via market producers | D632 | 4,956 | 4,958 | 5,241 | 5,043 | 5,194 | 5,117 | ||||
| made up of | |||||||||||
| Individual consumption (= social transfers in kind) | P31 (= D63) | 21,814 | 21,497 | 21,363 | 20,862 | 21,582 | 21,726 | ||||
| Social transfers in kind (via market producers) | D632 | 4,956 | 4,958 | 5,241 | 5,043 | 5,194 | 5,117 | ||||
| Social transfers in kind (provided directly by government) | D631 | 16,858 | 16,539 | 16,122 | 15,819 | 16,387 | 16,610 | ||||
| Collective consumption (= actual final consumption of government) | P32 | 9,773 | 10,086 | 9,779 | 9,731 | 10,092 | 10,375 | ||||
| Total social transfers | D62 + D63 | 45,633 | 45,366 | 45,598 | 44,402 | 44,596 | 44,858 | ||||
| Social benefits in cash | D62 | 23,818 | 23,868 | 24,235 | 23,540 | 23,014 | 23,132 | ||||
| Social transfers in kind (= individual consumption) | D63 | 21,814 | 21,497 | 21,363 | 20,862 | 21,582 | 21,726 | ||||
| Table 4 Central Government transactions: revenue, expenditure, financing and deficit | ||||||||||
| €million | ||||||||||
| Description | ESA2010 code | 2010 | 2011 | 2012 | 2013 | 2014 | 2015 | |||
| Central Government transactions | ||||||||||
| Revenue | TR | 51,809 | 54,149 | 55,816 | 58,004 | 62,389 | 67,002 | |||
| Taxes and social contributions | D2 + D5 + D91 + D61 | 45,734 | 47,545 | 48,985 | 51,170 | 55,732 | 60,501 | |||
| Taxes | D2 + D5 + D91 | 36,559 | 37,518 | 39,448 | 41,092 | 45,046 | 49,411 | |||
| Social contributions | D61 | 9,174 | 10,027 | 9,537 | 10,078 | 10,685 | 11,090 | |||
| Sales of goods and services | P1O | 3,700 | 3,573 | 3,513 | 3,331 | 3,232 | 3,558 | |||
| Investment income | D4 | 2,059 | 2,453 | 3,028 | 3,232 | 2,995 | 2,671 | |||
| Current transfer revenue (excluding taxes) | D7 | 267 | 214 | 207 | 170 | 258 | 216 | |||
| Capital transfer revenue (excluding taxes) | D9N | 49 | 364 | 83 | 102 | 173 | 56 | |||
| Expenditure | TE | 105,480 | 75,844 | 69,745 | 68,196 | 69,557 | 72,320 | |||
| Expense | Expense | 104,427 | 75,171 | 69,085 | 67,898 | 67,995 | 70,752 | |||
| Compensation of employees | D1 | 17,150 | 17,204 | 16,849 | 16,568 | 16,791 | 17,321 | |||
| Use of goods and services plus taxes payable | P2 + D5 + D29 | 7,269 | 6,777 | 6,464 | 6,796 | 7,215 | 7,502 | |||
| Depreciation (Consumption of fixed capital) | P51c | 1,380 | 1,488 | 1,455 | 1,396 | 1,933 | 2,127 | |||
| Interest (excluding FISIM) | D41 | 4,721 | 5,697 | 7,157 | 7,592 | 7,436 | 6,678 | |||
| Subsidies | D3 | 1,828 | 1,725 | 1,921 | 1,913 | 1,853 | 1,785 | |||
| Social benefits | D62 + D632 | 27,238 | 27,354 | 27,904 | 27,057 | 26,870 | 26,781 | |||
| Other current transfers | D7 | 5,223 | 5,042 | 4,731 | 4,645 | 4,253 | 4,144 | |||
| Capital transfers | D9 | 39,617 | 9,885 | 2,604 | 1,932 | 1,644 | 4,413 | |||
| Net operating balance | NOB | -52,619 | -21,022 | -13,268 | -9,895 | -5,607 | -3,749 | |||
| Net acquisition of non-financial assets | P5 + NP - P51c | 1,053 | 673 | 660 | 298 | 1,562 | 1,568 | |||
| Central Government Surplus/Deficit | B9 | -53,672 | -21,695 | -13,928 | -10,193 | -7,169 | -5,317 | |||
| Table 5 Central Government: detailed classification of revenue and output | |||||||||||
| €million | |||||||||||
| Description | ESA2010 code | 2010 | 2011 | 2012 | 2013 | 2014 | 2015 | ||||
| Total Revenue | TR | 51,809 | 54,149 | 55,816 | 58,004 | 62,389 | 67,002 | ||||
| Taxes and social contributions | 45,734 | 47,545 | 48,985 | 51,170 | 55,732 | 60,501 | |||||
| Taxes | D2 + D5 + D91 | 36,559 | 37,518 | 39,448 | 41,092 | 45,046 | 49,411 | ||||
| Indirect taxes (taxes on production and imports) | D2 | 16,741 | 16,437 | 16,866 | 17,878 | 19,794 | 21,130 | ||||
| Taxes on products | D21 | 16,083 | 15,705 | 16,099 | 16,749 | 18,240 | 19,431 | ||||
| of which Value-Added Tax | D211 | 10,067 | 9,755 | 10,219 | 10,372 | 11,521 | 11,955 | ||||
| Other taxes on production | D29 | 659 | 732 | 767 | 1,130 | 1,554 | 1,699 | ||||
| Direct taxes | D5 | 19,583 | 20,842 | 22,300 | 22,935 | 24,894 | 27,881 | ||||
| Taxes on income, profits and capital gains | D51 | 18,617 | 19,435 | 20,837 | 21,298 | 23,016 | 26,604 | ||||
| Other current direct taxes | D59 | 966 | 1,407 | 1,463 | 1,637 | 1,878 | 1,276 | ||||
| Capital taxes | D91 | 235 | 239 | 282 | 278 | 359 | 401 | ||||
| Social contributions | D61 | 9,174 | 10,027 | 9,537 | 10,078 | 10,685 | 11,090 | ||||
| Actual social contributions | D611 + D613 | 8,227 | 8,830 | 8,284 | 8,827 | 9,451 | 9,892 | ||||
| PRSI receipts | D611 + D613(pt) | 6,702 | 7,268 | 6,799 | 7,299 | 7,947 | 8,512 | ||||
| Government employees' social contributions | D613(pt) | 1,525 | 1,562 | 1,484 | 1,528 | 1,503 | 1,380 | ||||
| Employers' imputed social contributions | D612 | 947 | 1,197 | 1,253 | 1,251 | 1,235 | 1,198 | ||||
| Sales of goods and services | P1O | 3,700 | 3,573 | 3,513 | 3,331 | 3,232 | 3,558 | ||||
| Sales of market establishments (= market output) | P11 | 0 | 0 | 0 | 0 | 0 | 0 | ||||
| Imputed sales related to production of own-use capital assets (= output for own final use) | P12 | 58 | 58 | 38 | 33 | 33 | 21 | ||||
| Incidental sales and fees of non-market establishments | P131 | 3,642 | 3,515 | 3,475 | 3,297 | 3,199 | 3,538 | ||||
| Investment income | D4 | 2,059 | 2,453 | 3,028 | 3,232 | 2,995 | 2,671 | ||||
| Interest (excluding FISIM) | D41 | 816 | 1,373 | 1,596 | 1,456 | 1,068 | 725 | ||||
| of which received from local government | D41_LG | 80 | 118 | 97 | 99 | 71 | 50 | ||||
| Dividends | D42 | 1,241 | 1,077 | 1,428 | 1,772 | 1,923 | 1,942 | ||||
| Current transfer revenue | D39 + D7 | 267 | 214 | 207 | 170 | 258 | 216 | ||||
| Subsidies | D39 | 0 | 0 | 0 | 0 | 0 | 0 | ||||
| Other current transfers | D7 | 267 | 214 | 207 | 170 | 258 | 216 | ||||
| Non-life insurance claims | D72 | 24 | 13 | 8 | 9 | 9 | 8 | ||||
| Grants from local government | D73 | 3 | 3 | 3 | 3 | 3 | 3 | ||||
| Other Domestic - Current | D7N_S1 | 142 | 158 | 155 | 102 | 196 | 153 | ||||
| From Rest of World - Current | D7N_S2 | 99 | 41 | 42 | 57 | 51 | 52 | ||||
| Capital transfer revenue | D9N | 49 | 364 | 83 | 102 | 173 | 56 | ||||
| Output | P1 | 25,799 | 25,467 | 24,767 | 24,759 | 25,939 | 26,950 | ||||
| Market output (sales of market establishments) | P11 | 0 | 0 | 0 | 0 | 0 | 0 | ||||
| Output for own final use | P12 | 58 | 58 | 38 | 33 | 33 | 21 | ||||
| Non-market output | P13 | 25,741 | 25,409 | 24,729 | 24,726 | 25,906 | 26,929 | ||||
| = Non-market compensation of employees | D1_nonmarket | 17,092 | 17,146 | 16,811 | 16,535 | 16,758 | 17,301 | ||||
| = Total compensation of employees | D1 | 17,150 | 17,204 | 16,849 | 16,568 | 16,791 | 17,321 | ||||
| - Compensation of employees of market establishments | D1_market | 0 | 0 | 0 | 0 | 0 | 0 | ||||
| - Compensation related to production of own-use capital assets | D1_own-use | -58 | -58 | -38 | -33 | -33 | -21 | ||||
| + Non-market intermediate consumption | P2_nonmarket | 7,269 | 6,775 | 6,463 | 6,796 | 7,215 | 7,502 | ||||
| = Total intermediate consumption | P2 | 7,269 | 6,775 | 6,463 | 6,796 | 7,215 | 7,502 | ||||
| - Intermediate consumption of market establishments | P2_market | 0 | 0 | 0 | 0 | 0 | 0 | ||||
| - Intermediate consumption related to production of own-use capital assets | P2_own-use | 0 | 0 | 0 | 0 | 0 | 0 | ||||
| + Non-market consumption of fixed capital | P51c_nonmarket | 1,380 | 1,488 | 1,455 | 1,396 | 1,933 | 2,127 | ||||
| = Total consumption of fixed capital | P51c | 1,380 | 1,488 | 1,455 | 1,396 | 1,933 | 2,127 | ||||
| - Consumption of fixed capital by market establishments | P51c_market | 0 | 0 | 0 | 0 | 0 | 0 | ||||
| - Consumption of fixed capital related to production of own-use capital assets | P51c_own-use | 0 | 0 | 0 | 0 | 0 | 0 | ||||
| + Other taxes on production, payable | D29_pay | 0 | 0 | 0 | 0 | 0 | 0 | ||||
| - Other subsidies on production, receivable | D39_rec | 0 | 0 | 0 | 0 | 0 | 0 | ||||
| Table 6 Central Government: detailed classification of expenditure and consumption | |||||||||||
| €million | |||||||||||
| Description | ESA2010 code | 2010 | 2011 | 2012 | 2013 | 2014 | 2015 | ||||
| Total Expenditure | TE | 105,480 | 75,844 | 69,745 | 68,196 | 69,557 | 72,320 | ||||
| Expense | 104,427 | 75,171 | 69,085 | 67,898 | 67,995 | 70,752 | |||||
| Compensation of employees | D1 | 17,150 | 17,204 | 16,849 | 16,568 | 16,791 | 17,321 | ||||
| Of which: Related to production of own-use capital assets | 58 | 58 | 38 | 33 | 33 | 21 | |||||
| Use of goods and services plus taxes payable | P2 + D5 + D29 | 7,269 | 6,777 | 6,464 | 6,796 | 7,215 | 7,502 | ||||
| Use of goods and services [Intermediate consumption] | P2 | 7,269 | 6,775 | 6,463 | 6,796 | 7,215 | 7,502 | ||||
| Of which: Intermediate consumption of market establishments | 0 | 0 | 0 | 0 | 0 | 0 | |||||
| Taxes, payable | D5 | 1 | 1 | 1 | 0 | 0 | 0 | ||||
| Depreciation (Consumption of fixed capital) | P51c | 1,380 | 1,488 | 1,455 | 1,396 | 1,933 | 2,127 | ||||
| Of which: Depreciation by market establishments | 0 | 0 | 0 | 0 | 0 | 0 | |||||
| Interest (excluding FISIM) | D41 | 4,721 | 5,697 | 7,157 | 7,592 | 7,436 | 6,678 | ||||
| Other domestic interest payable | D41_S1 | 1,313 | 1,348 | 2,536 | 2,954 | 2,746 | 2,282 | ||||
| Interest payable to rest of world | D41_S2 | 3,408 | 4,349 | 4,621 | 4,638 | 4,690 | 4,397 | ||||
| Subsidies | D3 | 1,828 | 1,725 | 1,921 | 1,913 | 1,853 | 1,785 | ||||
| Product subsidies | D31 | 1,083 | 1,060 | 1,063 | 1,071 | 957 | 882 | ||||
| Other subsidies on production | D39 | 745 | 665 | 858 | 842 | 897 | 903 | ||||
| Social benefits | D62 + D632 | 27,238 | 27,354 | 27,904 | 27,057 | 26,870 | 26,781 | ||||
| Social benefits in cash | D62 | 22,939 | 23,099 | 23,456 | 22,885 | 22,649 | 22,767 | ||||
| Social benefits in kind (via market producers) | D632 | 4,299 | 4,255 | 4,448 | 4,172 | 4,221 | 4,014 | ||||
| Other current transfers | D7 | 5,223 | 5,042 | 4,731 | 4,645 | 4,253 | 4,144 | ||||
| Net non-life insurance premiums | D71 | 83 | 47 | 77 | 58 | 58 | 57 | ||||
| Current grants to local government | D73 _LG | 2,604 | 2,490 | 2,257 | 1,798 | 1,526 | 1,626 | ||||
| Current international cooperation | D74 | 547 | 547 | 546 | 531 | 435 | 474 | ||||
| Miscellaneous current transfers | D75 | 822 | 808 | 661 | 703 | 751 | 479 | ||||
| VAT and GNI based EU budget contribution | D76 | 1,167 | 1,150 | 1,190 | 1,556 | 1,483 | 1,507 | ||||
| VAT-based EU own resources | D761 | 194 | 194 | 191 | 194 | 203 | 215 | ||||
| GNI-based EU own resources | D762 | 973 | 956 | 999 | 1,361 | 1,280 | 1,293 | ||||
| Capital transfers | D9 | 39,617 | 9,885 | 2,604 | 1,932 | 1,644 | 4,413 | ||||
| Capital grants to local government | D9_LG | 2,733 | 1,851 | 1,357 | 1,132 | 632 | 1,157 | ||||
| Investment grants | D92 | 1,055 | 913 | 966 | 762 | 819 | 1,145 | ||||
| Other capital transfers | D99 | 35,828 | 7,121 | 280 | 38 | 193 | 2,111 | ||||
| Net acquisition of non-financial assets | P5 + NP - P51c | 1,053 | 673 | 660 | 298 | 1,562 | 1,568 | ||||
| = Gross investment in non-financial assets | P5 + NP | 2,433 | 2,161 | 2,116 | 1,695 | 3,495 | 3,695 | ||||
| Gross fixed capital formation | P51 | 2,513 | 2,050 | 2,033 | 2,335 | 3,435 | 3,635 | ||||
| Net acquisition of stocks | P52 | -80 | 111 | 83 | 83 | 60 | 60 | ||||
| Net acquisition of unproduced assets | NP | 0 | 0 | 0 | -723 | 0 | 0 | ||||
| - Consumption of fixed capital | P51c | -1,380 | -1,488 | -1,455 | -1,396 | -1,933 | -2,127 | ||||
| Net expenditure on current goods and services | P3 excl. D632 | 22,100 | 21,894 | 21,254 | 21,429 | 22,707 | 23,392 | ||||
| = Output | P1 | 25,799 | 25,467 | 24,767 | 24,759 | 25,939 | 26,950 | ||||
| - Sales of goods and services | P11+P12+P131 | -3,700 | -3,573 | -3,513 | -3,331 | -3,232 | -3,558 | ||||
| Market output (sales of market establishments) | P11 | 0 | 0 | 0 | 0 | 0 | 0 | ||||
| Output for own final use | P12 | -58 | -58 | -38 | -33 | -33 | -21 | ||||
| Incidental sales and fees of non-market establishments | P131 | -3,642 | -3,515 | -3,475 | -3,297 | -3,199 | -3,538 | ||||
| Final consumption expenditure | P3 | 26,398 | 26,149 | 25,702 | 25,601 | 26,928 | 27,405 | ||||
| = Net expenditure on current goods and services | P3 excl. D632 | 22,100 | 21,894 | 21,254 | 21,429 | 22,707 | 23,392 | ||||
| + Social transfers in kind via market producers | D632 | 4,299 | 4,255 | 4,448 | 4,172 | 4,221 | 4,014 | ||||
| made up of | |||||||||||
| Individual consumption (= social transfers in kind) | P31 (= D63) | 19,637 | 19,084 | 18,946 | 18,586 | 19,589 | 19,597 | ||||
| Social transfers in kind (via market producers) | D632 | 4,299 | 4,255 | 4,448 | 4,172 | 4,221 | 4,014 | ||||
| Social transfers in kind (provided directly by government) | D631 | 15,339 | 14,829 | 14,498 | 14,414 | 15,369 | 15,583 | ||||
| Collective consumption (= actual final consumption of government) | P32 | 6,761 | 7,065 | 6,756 | 7,015 | 7,338 | 7,808 | ||||
| Total social transfers | D62 + D63 | 42,577 | 42,182 | 42,402 | 41,471 | 42,239 | 42,364 | ||||
| Social benefits in cash | D62 | 22,939 | 23,099 | 23,456 | 22,885 | 22,649 | 22,767 | ||||
| Social transfers in kind (= individual consumption) | D63 | 19,637 | 19,084 | 18,946 | 18,586 | 19,589 | 19,597 | ||||
| Table 7 Local Government transactions: revenue, expenditure, financing and deficit | ||||||||||
| €million | ||||||||||
| Description | ESA2010 code | 2010 | 2011 | 2012 | 2013 | 2014 | 2015 | |||
| Local Government transactions | ||||||||||
| Revenue | TR | 9,018 | 8,028 | 7,391 | 6,550 | 5,648 | 6,457 | |||
| Taxes and social contributions | D2 + D5 + D91 + D61 | 1,643 | 1,687 | 1,818 | 1,738 | 1,701 | 1,623 | |||
| Taxes | D2 + D5 + D91 | 1,332 | 1,345 | 1,481 | 1,407 | 1,403 | 1,325 | |||
| Social contributions | D61 | 311 | 342 | 337 | 332 | 298 | 298 | |||
| Sales of goods and services | P1O | 1,585 | 1,590 | 1,600 | 1,608 | 1,473 | 1,738 | |||
| Investment income | D4 | 132 | 119 | 97 | 49 | 40 | 40 | |||
| Current transfer revenue (excluding taxes) | D7 | 2,652 | 2,536 | 2,302 | 1,827 | 1,570 | 1,666 | |||
| Capital transfer revenue (excluding taxes) | D9N | 3,006 | 2,096 | 1,573 | 1,328 | 864 | 1,389 | |||
| Expenditure | TE | 9,025 | 8,175 | 7,476 | 6,551 | 5,676 | 5,760 | |||
| Expense | Expense | 7,780 | 7,877 | 7,884 | 7,226 | 6,439 | 6,549 | |||
| Compensation of employees | D1 | 2,142 | 2,185 | 2,147 | 2,027 | 1,553 | 1,553 | |||
| Use of goods and services plus taxes payable | P2 + D5 + D29 | 1,898 | 2,025 | 1,879 | 1,400 | 1,691 | 1,691 | |||
| Depreciation (Consumption of fixed capital) | P51c | 1,806 | 1,817 | 1,845 | 1,871 | 1,500 | 1,500 | |||
| Interest (excluding FISIM) | D41 | 102 | 141 | 120 | 122 | 85 | 65 | |||
| Subsidies | D3 | 0 | 0 | 0 | 0 | 0 | 0 | |||
| Social benefits | D62 + D632 | 1,536 | 1,473 | 1,573 | 1,527 | 1,339 | 1,468 | |||
| Other current transfers | D7 | 48 | 48 | 48 | 48 | 50 | 50 | |||
| Capital transfers | D9 | 246 | 188 | 273 | 233 | 222 | 222 | |||
| Net operating balance | NOB | 1,238 | 152 | -493 | -677 | -791 | -92 | |||
| Net acquisition of non-financial assets | P5 + NP - P51c | 1,245 | 299 | -408 | -675 | -764 | -789 | |||
| Local Government Surplus/Deficit | B9 | -6 | -147 | -85 | -1 | -27 | 697 | |||
| Table 8 Local Government: detailed classification of revenue and output | |||||||||||
| €million | |||||||||||
| Description | ESA2010 code | 2010 | 2011 | 2012 | 2013 | 2014 | 2015 | ||||
| Total Revenue | TR | 9,018 | 8,028 | 7,391 | 6,550 | 5,648 | 6,457 | ||||
| Taxes and social contributions | 1,643 | 1,687 | 1,818 | 1,738 | 1,701 | 1,623 | |||||
| Taxes | D2 + D5 + D91 | 1,332 | 1,345 | 1,481 | 1,407 | 1,403 | 1,325 | ||||
| Indirect taxes (taxes on production and imports) | D2 | 1,322 | 1,342 | 1,478 | 1,407 | 1,403 | 1,325 | ||||
| Other taxes on production | D29 | 1,322 | 1,342 | 1,478 | 1,407 | 1,403 | 1,325 | ||||
| Capital taxes | D91 | 10 | 3 | 3 | 0 | 0 | 0 | ||||
| Social contributions | D61 | 311 | 342 | 337 | 332 | 298 | 298 | ||||
| Actual social contributions | D611 + D613 | 206 | 209 | 198 | 193 | 130 | 130 | ||||
| Employers' imputed social contributions | D612 | 105 | 133 | 139 | 139 | 168 | 168 | ||||
| Sales of goods and services | P1O | 1,585 | 1,590 | 1,600 | 1,608 | 1,473 | 1,738 | ||||
| Sales of market establishments (= market output) | P11 | 877 | 905 | 978 | 1,048 | 1,137 | 1,245 | ||||
| Imputed sales related to production of own-use capital assets (= output for own final use) | P12 | 0 | 0 | 0 | 0 | 0 | 0 | ||||
| Incidental sales and fees of non-market establishments | P131 | 707 | 685 | 622 | 560 | 337 | 493 | ||||
| Investment income | D4 | 132 | 119 | 97 | 49 | 40 | 40 | ||||
| Interest (excluding FISIM) | D41 | 132 | 119 | 97 | 49 | 40 | 40 | ||||
| in which received from Central Government | D41_CG | 0 | 0 | 0 | 0 | 0 | 0 | ||||
| Dividends | D42 | 0 | 0 | 0 | 0 | 0 | 0 | ||||
| Current transfer revenue | D39 + D7 | 2,652 | 2,536 | 2,302 | 1,827 | 1,570 | 1,666 | ||||
| Subsidies | D39 | 0 | 0 | 0 | 0 | 0 | 0 | ||||
| Other current transfers | D7 | 2,652 | 2,536 | 2,302 | 1,827 | 1,570 | 1,666 | ||||
| Grants from central government | D73 | 2,604 | 2,490 | 2,257 | 1,798 | 1,526 | 1,626 | ||||
| Other Domestic - Current | D7N_S1 | 48 | 46 | 45 | 29 | 43 | 40 | ||||
| Capital transfer revenue | D9N | 3,006 | 2,096 | 1,573 | 1,328 | 864 | 1,389 | ||||
| Grants from central government | D9N_CG | 2,733 | 1,851 | 1,357 | 1,132 | 632 | 1,157 | ||||
| Other capital transfers receivable | D99 | 273 | 246 | 216 | 196 | 232 | 232 | ||||
| Output | P1 | 6,116 | 6,320 | 6,247 | 5,729 | 5,246 | 5,332 | ||||
| Market output (sales of market establishments) | P11 | 877 | 905 | 978 | 1,048 | 1,137 | 1,245 | ||||
| Output for own final use | P12 | 0 | 0 | 0 | 0 | 0 | 0 | ||||
| Non-market output | P13 | 5,239 | 5,415 | 5,269 | 4,681 | 4,109 | 4,087 | ||||
| = Non-market compensation of employees | D1_nonmarket | 2,142 | 2,185 | 2,147 | 2,027 | 1,553 | 1,553 | ||||
| = Total compensation of employees | D1 | 2,142 | 2,185 | 2,147 | 2,027 | 1,553 | 1,553 | ||||
| - Compensation of employees of market establishments | D1_market | 0 | 0 | 0 | 0 | 0 | 0 | ||||
| - Compensation related to production of own-use capital assets | D1_own-use | 0 | 0 | 0 | 0 | 0 | 0 | ||||
| + Non-market intermediate consumption | P2_nonmarket | 1,675 | 1,798 | 1,667 | 1,181 | 1,472 | 1,472 | ||||
| = Total intermediate consumption | P2 | 1,898 | 2,025 | 1,879 | 1,400 | 1,691 | 1,691 | ||||
| - Intermediate consumption of market establishments | P2_market | -224 | -227 | -212 | -219 | -219 | -219 | ||||
| - Intermediate consumption related to production of own-use capital assets | P2_own-use | 0 | 0 | 0 | 0 | 0 | 0 | ||||
| + Non-market consumption of fixed capital | P51c_nonmarket | 1,422 | 1,432 | 1,456 | 1,474 | 1,085 | 1,061 | ||||
| = Total consumption of fixed capital | P51c | 1,806 | 1,817 | 1,845 | 1,871 | 1,500 | 1,500 | ||||
| - Consumption of fixed capital by market establishments | P51c_market | -384 | -385 | -389 | -397 | -415 | -439 | ||||
| - Consumption of fixed capital related to production of own-use capital assets | P51c_own-use | 0 | 0 | 0 | 0 | 0 | 0 | ||||
| + Other taxes on production, payable | D29_pay | 0 | 0 | 0 | 0 | 0 | 1 | ||||
| - Other subsidies on production, receivable | D39_rec | 0 | 0 | 0 | 0 | 0 | 0 | ||||
| Table 9 Local Government: detailed classification of expenditure and consumption | |||||||||||
| €million | |||||||||||
| Description | ESA2010 code | 2010 | 2011 | 2012 | 2013 | 2014 | 2015 | ||||
| Total Expenditure | TE | 9,025 | 8,175 | 7,476 | 6,551 | 5,676 | 5,760 | ||||
| Expense | 7,780 | 7,877 | 7,884 | 7,226 | 6,439 | 6,549 | |||||
| Compensation of employees | D1 | 2,142 | 2,185 | 2,147 | 2,027 | 1,553 | 1,553 | ||||
| Of which: Related to production of own-use capital assets | 0 | 0 | 0 | 0 | 0 | 0 | |||||
| Use of goods and services plus taxes payable | P2 + D5 + D29 | 1,898 | 2,025 | 1,879 | 1,400 | 1,691 | 1,691 | ||||
| Use of goods and services [Intermediate consumption] | P2 | 1,898 | 2,025 | 1,879 | 1,400 | 1,691 | 1,691 | ||||
| Of which: Intermediate consumption of market establishments | 224 | 227 | 212 | 219 | 219 | 219 | |||||
| Taxes, payable | D5 + D29 | 0 | 0 | 0 | 0 | 0 | 0 | ||||
| Depreciation (Consumption of fixed capital) | P51c | 1,806 | 1,817 | 1,845 | 1,871 | 1,500 | 1,500 | ||||
| Of which: Depreciation by market establishments | 384 | 385 | 389 | 397 | 415 | 439 | |||||
| Interest (excluding FISIM) | D41 | 102 | 141 | 120 | 122 | 85 | 65 | ||||
| Interest payable to central government | D41_CG | 80 | 118 | 97 | 99 | 71 | 50 | ||||
| Other domestic interest payable | D41_S1 | 22 | 22 | 22 | 22 | 13 | 15 | ||||
| Subsidies | D3 | 0 | 0 | 0 | 0 | 0 | 0 | ||||
| Social benefits | D62 + D632 | 1,536 | 1,473 | 1,573 | 1,527 | 1,339 | 1,468 | ||||
| Social benefits in cash | D62 | 879 | 770 | 779 | 656 | 365 | 365 | ||||
| Social benefits in kind (via market producers) | D632 | 657 | 704 | 794 | 871 | 974 | 1,103 | ||||
| Other current transfers | D7 | 48 | 48 | 48 | 48 | 50 | 50 | ||||
| Grants to central government | D73_CG | 3 | 3 | 3 | 3 | 3 | 3 | ||||
| Miscellaneous current transfers | D75 | 46 | 46 | 45 | 45 | 47 | 47 | ||||
| Capital transfers | D9 | 246 | 188 | 273 | 233 | 222 | 222 | ||||
| Investment grants | D92 | 246 | 188 | 273 | 233 | 222 | 222 | ||||
| Net acquisition of non-financial assets | P5 + NP - P51c | 1,245 | 299 | -408 | -675 | -764 | -789 | ||||
| = Gross investment in non-financial assets | P5 + NP | 3,050 | 2,116 | 1,437 | 1,195 | 736 | 711 | ||||
| Gross fixed capital formation | P51 | 3,050 | 2,116 | 1,437 | 1,195 | 736 | 711 | ||||
| Net acquisition of stocks | P52 | 0 | 0 | 0 | 0 | 0 | 0 | ||||
| Net acquisition of unproduced assets | NP | 0 | 0 | 0 | 0 | 0 | 0 | ||||
| - Consumption of fixed capital | P51c | -1,806 | -1,817 | -1,845 | -1,871 | -1,500 | -1,500 | ||||
| Net expenditure on current goods and services | P3 excl. D632 | 4,532 | 4,730 | 4,647 | 4,121 | 3,772 | 3,594 | ||||
| = Output | P1 | 6,116 | 6,320 | 6,247 | 5,729 | 5,246 | 5,332 | ||||
| - Sales of goods and services | P11+P12+P131 | -1,585 | -1,590 | -1,600 | -1,608 | -1,473 | -1,738 | ||||
| Market output (sales of market establishments) | P11 | -877 | -905 | -978 | -1,048 | -1,137 | -1,245 | ||||
| Output for own final use | P12 | 0 | 0 | 0 | 0 | 0 | 0 | ||||
| Incidental sales and fees of non-market establishments | P131 | -707 | -685 | -622 | -560 | -337 | -493 | ||||
| Final consumption expenditure | P3 | 5,189 | 5,434 | 5,441 | 4,992 | 4,746 | 4,697 | ||||
| = Net expenditure on current goods and services | P3 excl. D632 | 4,532 | 4,730 | 4,647 | 4,121 | 3,772 | 3,594 | ||||
| + Social transfers in kind via market producers | D632 | 657 | 704 | 794 | 871 | 974 | 1,103 | ||||
| made up of | |||||||||||
| Individual consumption (= social transfers in kind) | P31 (= D63) | 2,177 | 2,414 | 2,417 | 2,276 | 1,992 | 2,129 | ||||
| Social transfers in kind (via market producers) | D632 | 657 | 704 | 794 | 871 | 974 | 1,103 | ||||
| Social transfers in kind (provided directly by government) | D631 | 1,520 | 1,710 | 1,624 | 1,405 | 1,019 | 1,026 | ||||
| Collective consumption (= actual final consumption of government) | P32 | 3,012 | 3,020 | 3,023 | 2,716 | 2,754 | 2,568 | ||||
| Total social transfers | D62 + D63 | 3,056 | 3,183 | 3,196 | 2,932 | 2,357 | 2,494 | ||||
| Social benefits in cash | D62 | 879 | 770 | 779 | 656 | 365 | 365 | ||||
| Social transfers in kind (= individual consumption) | D63 | 2,177 | 2,414 | 2,417 | 2,276 | 1,992 | 2,129 | ||||
Introduction
This release comprises the latest official publication by CSO of annual Government Finance Statistics results for years 2010 to 2015. The results for 2015 are provisional estimates and replace the data published as part of the Excessive Deficit Procedure notification on 20 April 2016.
The tables provide detailed revenue and expenditure data for General Government and its two subsectors, namely Central and Local Government. This allows the user to decompose the data to subsector level. A full time series of these data back to 1995 are available on Eurostat’s data base, located at the following link:
http://ec.europa.eu/eurostat/web/government-finance-statistics/data/main-tables
Note: These tables replace tables 19, 20 and 21 of the annual National Income and Expenditure publication.
The full suite of government finance statistics tables are also available on the CSO’s website by following the link:
http://www.cso.ie/en/statistics/nationalaccounts/governmentfinancestatistics/
The data published in this series are fully consistent with the National Income and Expenditure 2015 and the Quarterly National Accounts Q1 2016 releases (12 July 2016). They are also consistent with the Quarterly Government Finance Statistics Q1 2016 release published on 13 July 2016.
Significant events arising in 2015
Share Transactions
In Quarter 1 2015 the Ireland Strategic Investment Fund transferred €1,634 million to the exchequer. These funds related to the disposal of its preference share holding in Bank of Ireland.
In Quarter 2 2015 Permanent TSB (PTSB) repurchased contingent capital notes issued in 2011, for which the State received €410.5 million. At around the same time the State sold shares which it held in PTSB at a value of €97 million. The proceeds of both transactions were recorded in the Exchequer statement.
In Quarter 4 2015 the Ireland Strategic Investment Fund redeemed part of its preference shares in AIB for the sum of €1,700 million. At the same time the balance of its preference shares were converted to ordinary shares, and the promissory note issued to EBS in 2010 was paid off in full. The net proceeds of these transactions were recorded in the December Exchequer Statement.
For National Accounts purposes the net inflows to the Exchequer arising from all of the above transactions are not treated as revenue as they are simply the exchange of one asset (equity or securities) for cash or another form of financial asset. Therefore they have no impact on the general government deficit. The balance sheet of government shows changes in the relevant instrument categories resulting from these transactions.
The conversion of the preference shares to ordinary shares has been determined to be a capital transfer (expenditure) rather than a reinvestment of capital. This determination was arrived at by Eurostat during the April 2016 EDP clarification process based on AIB losses incurred since the last capital injection was made in 2012 and on the uncertainty of a return on the investment when compared to the guaranteed return on the preference shares previously held.
Repayment of water-related loans by Central Government.
In Quarter 3 2015 the amount of €423 million was transferred from the Exchequer to local authorities to allow them redeem loans from the Housing Finance Agency related to water services assets. The assets in question had transferred to Irish Water while the legal title to the loans remained with the local authorities. This payment was treated as a capital transfer to Local Government from Central Government, resulting in an improvement of the Local Government balance for 2015 and a corresponding worsening of the Central Government balance, resulting in a zero impact at the General Government level as a result of this transaction. A further amount of approximately €147m in loans related to water services assets are also due for repayment by the Minister.
Other changes since the last release of annual Government Finance Statistics (in April 2016)
Revisions to General Government Deficit/Surplus (GG Deficit/Surplus)
Estimates of the General Government deficit for years 2009 to 2015 have been revised since April 2016. The changes indicate an improvement in the deficit of €300 million for 2015. This is mainly the result of the availability of further data from audited accounts, as well as methodological and data source changes in the estimation of financial intermediation services indirectly measured (FISIM) and Compensation of Employees.
Revisions to GDP
The GDP figures used in the current publication are consistent with those published in the National Income and Expenditure 2015 and the latest Quarterly National Accounts publication.
Other relevant information
Register of Public Sector Bodies
The Central Statistics Office (CSO) is required to define the scope of the public sector (which includes the General Government Sector) for the official reporting of Ireland’s General Government Deficit/Surplus, Government Debt, and other Government Finance Statistics. In this context, the public sector includes all bodies that are directly or indirectly controlled by a Government department or office, or by a local authority. General Government, in turn, includes all public sector bodies that are also mainly financed by government bodies. The decision rules governing the classification of bodies to the Public and General Government sectors are set out in detail in the Manual on Government Deficit and Debt (MGDD).
The CSO’s Register of Public Sector bodies is updated twice a year to coincide with the submission of government deficit and debt figures to Eurostat under the Excessive Deficit Procedure. It reflects any changes in the composition of the government sector since the previous update.
Copies of documents relating to classification decisions can be seen at:
http://www.cso.ie/en/surveysandmethodology/nationalaccounts/classificationdecisions/
A detailed explanation of the application of these rules and the most up-to-date list of public sector bodies (including General Government bodies) for Ireland is also shown at this link.
Government Finance Statistics – Concepts and Definitions
Government Finance Statistics (GFS) form the basis for fiscal monitoring in Europe, in particular in relation to the Excessive Deficit Procedure (EDP).
European GFS, including EDP statistics are produced according to the legally binding accounting rules of the European System of Accounts (ESA2010). The Manual on Government Debt and Deficit (MGDD) provides further guidance on the implementation of ESA 2010 in the context of GFS.
EU Member States are required to report government deficit/surplus and debt data biannually under the EDP (before 1 April and 1 October in year N) for years N-4 to N-1 calendar years as well as a forecast for the current year. The data are reported in harmonised tables, which provide a consistent framework for the presentation of this data by Member States. The tables provide a structure for linking national budgetary aggregates with government deficit and debt.
In addition to the EDP transmission programme, detailed statistics on government revenue and expenditure are also provided to Eurostat under the ESA transmission programme. For quarterly data the main tables reported are:
Table 801 Quarterly Non-financial accounts by sector
Table 2500 Quarterly Short Term Statistics (Revenue and Expenditure) for general government
Table 2700 Quarterly financial accounts for general government
Table 2800 Quarterly government debt
These data are available on the Eurostat website.
http://ec.europa.eu/eurostat/web/government-finance-statistics/data/main-tables
Definition of General Government and its subsectors
The General Government sector of the economy, is defined in ESA2010 paragraph 2.111: as “institutional units which are non-market producers whose output is intended for individual and collective consumption, and are financed by compulsory payments made by units belonging to other sectors, and institutional units principally engaged in the redistribution of national income and wealth.” General Government comprises the sub-sectors Central Government (S.1311), State Government (S.1312 – which does not apply in Ireland), Local Government (S.1313), and social security funds (S.1314 – which does not apply in Ireland),
General Government Deficit/Surplus (GG Deficit/Surplus) is the standard European measure of the fiscal balance, which is used to monitor compliance with the Stability and Growth Pact.
This measure is by definition equal to both Total Revenue (TR) less Total Expenditure (TE), and Net Acquisition of Financial Assets less Net Incurrence of Liabilities. In order to respect this accounting identity, a technical adjustment is made to the level of transactions recorded in liability category F32 (long-term debt securities) to eliminate any statistical discrepancy between the two approaches to the calculation of GG Deficit/Surplus. This adjustment has no impact on gross debt, net debt or net worth.
A listing of some of the main items included in this release is shown below
Main Components of General Government Expenditure and Revenue
P.2 Intermediate consumption – value of goods and services used in the process of production, excluding fixed assets
P.5 Gross capital formation
P.51g Gross fixed capital formation - acquisitions, less disposals, of fixed assets during a given period plus certain additions to the value of non-produced assets realised by productive activity. Fixed assets are tangible or intangible assets produced as outputs from processes of production that are themselves used repeatedly, or continuously, in processes of production for more than one year
P.51c Consumption of fixed capital - the amount of fixed assets used up, during the period under consideration, as a result of normal wear and tear and foreseeable obsolescence, including a provision for losses of fixed assets as a result of accidental damage which can be insured against.
P.52 Changes in inventories
P.53 Acquisitions less disposals of valuables
D.1 Compensation of employees – the total remuneration of Government Employees
D.29 Other taxes on production (payable) all taxes that enterprises incur as a result of engaging in production, independently of the quantity or value of the goods and services produced or sold. These include taxes on use or ownership of land or buildings, taxes on use of fixed assets, taxes on total wage bill and payroll, taxes on international transactions related to production.
D.3 Subsidies (payable) - current unrequited payments which General Government or the institutions of the European Union make to resident producers, with the objective of influencing their levels of production, their prices or the remuneration of the factors of production
D.4 Property income accrues when the owners of financial assets and natural resources put them at the disposal of other units of the economy. The income payable for the use of financial assets is called investment income, while that payable for the use of a natural resource is called rent. Property income is the sum of investment income and rent.
D.41 Interest receivable by the owners of a financial asset for putting it at the disposal of another institutional unit - applies to deposits (AF.2), debt securities (AF.3), loans (AF.4) and other accounts payable (AF.8)
D.42 Dividends receivable by the owners of share equities. Dividends exclude "super dividends" which arise where the dividend paid is large relative to the recent level of dividends and earnings. Super dividends are recorded as withdrawal of equity (F.5). This arises, for example, in the case of dividends paid by the central bank in 2015.
D.5 Current taxes on income, wealth, etc, (payable) - all compulsory, unrequited payments, in cash or in kind, levied periodically by General Government and by the rest of the world on the income and wealth of units in the economy, and some periodic taxes which are assessed neither on income nor wealth
D.6 Social contributions - transfers to households, in cash or in kind, intended to relieve them from the financial burden of a number of risks or needs.
D.7 Other current transfers – includes VAT and GNI based EU budget contributions, current transfers between subsectors of government, current international co-operation and current transfers to households and non-profit institutions.
D.9 Capital transfers - involve the acquisition or disposal of an asset, or assets, by at least one of the parties to the transaction. Includes capital taxes and investment grants.
 Hide Background Notes
Scan the QR code below to view this release online or go to
http://www.cso.ie/en/releasesandpublications/er/giea/governmentincomeandexpenditurejuly2016/
 Show Table 1 General Government transactions: revenue, expenditure and deficit
 Hide Table 1 General Government transactions: revenue, expenditure and deficit