
| General Government | ||||||
| Surplus/Deficit | Gross Debt | Net Debt | ||||
| % quarterly | % annualised | % annualised | ||||
| €m | GDP | €m | GDP | €m | GDP | |
| 2015 Q1 | -2,490 | -4.0 | 203,530 | 97.0 | 167,380 | 79.8 |
| 2015 Q2 | 18 | 0.0 | 204,046 | 90.9 | 166,056 | 74.0 |
| 2015 Q3 | -929 | -1.5 | 203,313 | 85.7 | 165,145 | 69.6 |
| 2015 Q4 | -1,632 | -2.4 | 201,384 | 78.7 | 171,926 | 67.2 |
| 2016 Q1 | -1,721 | -2.7 | 206,980 | 80.1 | 173,436 | 67.1 |
| 2016 Q2 | 96 | 0.2 | 200,277 | 77.7 | 172,817 | 67.1 |
| 2016 Q3 | -1,502 | -2.2 | 202,409 | 77.1 | 173,902 | 66.2 |
| 2016 Q4 | 1,600 | 2.2 | 200,569 | 75.4 | 175,467 | 66.0 |
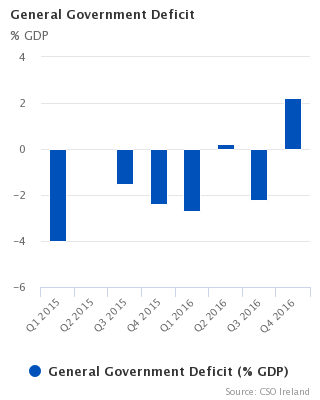
The government recorded a surplus of €1.6 billion (2.2% of quarterly GDP) in the fourth quarter of 2016. This resulted in an annual government deficit of €1.53 billion (-0.6% of GDP) for 2016 (Table 1).
In the final quarter of 2016, government revenue amounted to €21.6 billion, up from €20.6 billion in quarter 4 2015. This increase was mainly due to increases in Taxes and Social contributions. In quarter 3, there was a one-off reimbursement of a prepaid margin (€555 million) on a loan from the European Financial Stability Facility (EFSF) recorded as a capital transfer. See box below and Background notes (Tables 1 and 3).
Government expenditure for quarter 4 2016 was €20.0 billion, reflecting a decrease of €2.3 billion on the same period last year. However, when the effect of a one-off capital transfer of €2.1 billion is excluded from the Q4 2015 figures the decrease falls to €0.2 billion. This decrease is mainly due to reduced debt interest costs with other expenditure categories remaining fairly stable (Tables 1 and 4).
General Government Gross Debt (GG Debt) was €200.6 billion (75.4% of GDP) at the end of quarter 4 2016. This compares with a debt level of 77.1% of GDP at the end of quarter 3. The fall in the ratio is due to a combination of the repayment of short term bonds and increased annualised GDP (Table 2).
At the end of December 2016, General Government Net Debt was €175.5 billion (66.0% of GDP). This is a worsening on the net debt level of a year earlier which stood at €171.9 billion. This is due to a reduction in assets mainly arising from the disposal of holdings of financial corporations during 2016 (Tables 2 and 7).
|
The Government Finance Statistics (GFS) 2016 published on 11 April 2017 were updated on 24 April 2017 to align with the final Excessive Deficit Procedure (EDP) tables published by Eurostat. The changes to the previously published tables reflect the outcome of the Eurostat clarification process for the deficit and debt statistics supplied under the EDP transmission programme. The updated figures show the government deficit for 2016 at €1.53 billion (-0.6% of GDP), a worsening of €170 million from the original estimate of €1.36 billion (-0.5% of GDP). This change results from a review of data inputs as part of the normal EDP clarification process. Also published today are the main EDP notification tables for Ireland, details of government guarantees, PPPs and concessions and tables showing the impact of government interventions in the financial sector on government accounts. Due to the need for publication of GFS to meet the timetables of both the Stability Programme Update (by Department of Finance) and the EDP reporting processes, there may be a need in some years, as in 2017, for an update of GFS to bring the results into line with the EDP tables that are published by Eurostat following the clarification process. The EDP tables for all Member States were also published on 24 April 2017 at 11 am CET on the Eurostat website. The one-off revenue of €555 million reported for quarter 3 2016 arose from the repayment of a prepaid margin (plus interest) related to a loan from the European Financial Stability Facility (EFSF). This treatment is a legacy of the arrangements for this specific loan in the context of the financial crisis. Eurostat have clarified and confirmed this treatment for all affected Member States. Further details are given in the Background notes. National accounts are compiled in the EU according to the European System of National Accounts (ESA) framework - ESA 2010. The calculation methods for quarterly GFS are similar to those used in deriving the annual GFS. As some of the available sources are of lesser reliability than those used for the annual GFS, the quarterly estimates are subject to a greater margin of error than the annual figures. A full description of the concepts and definitions used in the production of these figures is provided in the Background notes. |
| GG Gross Debt | GG Net Debt | |
| Q1 2013 | 123.8 | 87.7 |
| Q2 2013 | 124 | 89.7 |
| Q3 2013 | 122 | 88.4 |
| Q4 2013 | 119.5 | 89.4 |
| Q1 2014 | 118.1 | 88.7 |
| Q2 2014 | 113.7 | 88.8 |
| Q3 2014 | 110.9 | 87.8 |
| Q4 2014 | 105.3 | 86.3 |
| Q1 2015 | 97 | 79.8 |
| Q2 2015 | 90.9 | 74 |
| Q3 2015 | 85.7 | 69.6 |
| Q4 2015 | 78.7 | 67.2 |
| Q1 2016 | 80.1 | 67.1 |
| Q2 2016 | 77.7 | 67.1 |
| Q3 2016 | 77.1 | 66.2 |
| Q4 2016 | 75.4 | 66 |
| Table 1 General Government transactions: revenue, expenditure, financing and deficit | ||||||||||||||||||||||||
| €million | ||||||||||||||||||||||||
| Description | ESA2010 code | 2012 Q1 | 2012 Q2 | 2012 Q3 | 2012 Q4 | 2013 Q1 | 2013 Q2 | 2013 Q3 | 2013 Q4 | 2014 Q1 | 2014 Q2 | 2014 Q3 | 2014 Q4 | 2015 Q1 | 2015 Q2 | 2015 Q3 | 2015 Q4 | 2016 Q1 | 2016 Q2 | 2016 Q3 | 2016 Q4 | |||
| General Government transactions | ||||||||||||||||||||||||
| Revenue | TR | 13,628 | 14,584 | 14,688 | 16,576 | 14,120 | 15,379 | 14,870 | 17,154 | 14,981 | 16,340 | 15,937 | 18,674 | 15,942 | 17,404 | 16,599 | 20,602 | 16,282 | 18,191 | 16,999 | 21,556 | |||
| Taxes and social contributions | D2 + D5 + D91 + D61 | 11,926 | 11,702 | 12,684 | 14,510 | 12,351 | 12,299 | 13,256 | 15,016 | 13,238 | 13,331 | 14,163 | 16,699 | 14,220 | 14,314 | 14,866 | 18,723 | 14,942 | 15,496 | 14,942 | 19,817 | |||
| Taxes | D2 + D5 + D91 | 9,577 | 9,247 | 10,300 | 11,822 | 9,782 | 9,758 | 10,744 | 12,228 | 10,465 | 10,695 | 11,538 | 13,751 | 11,342 | 11,580 | 12,165 | 15,648 | 11,916 | 12,601 | 12,061 | 16,513 | |||
| Social contributions | D61 | 2,349 | 2,455 | 2,383 | 2,688 | 2,569 | 2,541 | 2,512 | 2,788 | 2,774 | 2,636 | 2,625 | 2,948 | 2,878 | 2,734 | 2,701 | 3,075 | 3,026 | 2,895 | 2,881 | 3,304 | |||
| Sales of goods and services | P1O | 1,082 | 1,176 | 1,275 | 1,546 | 1,198 | 1,234 | 1,111 | 1,383 | 1,076 | 1,197 | 1,203 | 1,359 | 1,168 | 1,299 | 1,305 | 1,475 | 1,086 | 1,201 | 1,206 | 1,354 | |||
| Investment income | D4 | 462 | 1,582 | 593 | 390 | 469 | 1,757 | 412 | 543 | 513 | 1,698 | 418 | 334 | 391 | 1,658 | 305 | 264 | 87 | 1,317 | 96 | 238 | |||
| Current transfer revenue (excluding taxes) | D7 | 68 | 57 | 53 | 73 | 50 | 45 | 40 | 60 | 77 | 71 | 67 | 81 | 66 | 58 | 54 | 73 | 66 | 58 | 54 | 73 | |||
| Capital transfer revenue (excluding taxes) | D9N | 91 | 67 | 83 | 57 | 51 | 45 | 51 | 151 | 77 | 42 | 86 | 201 | 97 | 75 | 68 | 68 | 101 | 119 | 701 | 75 | |||
| Expenditure | TE | 18,465 | 18,313 | 17,904 | 18,939 | 17,537 | 17,183 | 17,754 | 19,345 | 17,820 | 17,805 | 18,048 | 19,436 | 18,433 | 17,385 | 17,528 | 22,234 | 18,003 | 18,095 | 18,501 | 19,956 | |||
| Expense | Expense | 18,026 | 17,854 | 18,471 | 19,018 | 17,649 | 17,534 | 18,251 | 18,762 | 17,595 | 17,564 | 18,176 | 18,975 | 18,073 | 17,739 | 17,858 | 21,131 | 17,883 | 17,700 | 18,301 | 19,546 | |||
| Compensation of employees | D1 | 4,942 | 4,670 | 4,706 | 4,678 | 4,833 | 4,733 | 4,545 | 4,483 | 4,769 | 4,670 | 4,483 | 4,422 | 4,917 | 4,814 | 4,623 | 4,560 | 5,056 | 4,951 | 4,754 | 4,689 | |||
| Use of goods and services plus taxes payable | P2 + D5 + D29 | 1,833 | 2,025 | 2,165 | 2,320 | 1,698 | 1,989 | 2,126 | 2,383 | 1,886 | 2,269 | 2,347 | 2,403 | 2,076 | 2,215 | 2,354 | 2,559 | 2,186 | 2,333 | 2,478 | 2,695 | |||
| Depreciation (Consumption of fixed capital) | P51c | 825 | 825 | 825 | 825 | 817 | 817 | 817 | 817 | 858 | 858 | 858 | 858 | 907 | 907 | 907 | 907 | 958 | 958 | 958 | 958 | |||
| Interest (excluding FISIM) | D41 | 1,680 | 1,759 | 1,882 | 1,973 | 1,884 | 1,827 | 1,986 | 2,022 | 1,861 | 1,906 | 1,912 | 1,904 | 1,729 | 1,693 | 1,699 | 1,718 | 1,645 | 1,564 | 1,525 | 1,445 | |||
| Subsidies | D3 | 411 | 430 | 453 | 627 | 413 | 433 | 457 | 611 | 398 | 415 | 437 | 603 | 383 | 399 | 418 | 585 | 361 | 377 | 397 | 581 | |||
| Social benefits | D62 + D632 | 7,002 | 7,139 | 7,389 | 7,946 | 6,830 | 6,830 | 7,227 | 7,697 | 6,598 | 6,695 | 7,235 | 7,640 | 6,658 | 6,730 | 7,241 | 7,661 | 6,687 | 6,785 | 7,388 | 7,597 | |||
| Other current transfers | D7 | 1,008 | 360 | 701 | 451 | 795 | 648 | 769 | 679 | 893 | 493 | 604 | 800 | 940 | 676 | 244 | 726 | 699 | 417 | 592 | 1,032 | |||
| Capital transfers | D9 | 326 | 646 | 350 | 198 | 379 | 258 | 324 | 71 | 330 | 259 | 300 | 344 | 462 | 305 | 373 | 2,415 | 290 | 315 | 210 | 550 | |||
| Net operating balance | NOB | -4,398 | -3,270 | -3,783 | -2,442 | -3,529 | -2,155 | -3,381 | -1,608 | -2,614 | -1,224 | -2,239 | -301 | -2,131 | -336 | -1,259 | -528 | -1,600 | 491 | -1,302 | 2,010 | |||
| Net acquisition of non-financial assets | P5 + NP - P51c | 439 | 459 | -567 | -79 | -112 | -351 | -497 | 584 | 225 | 241 | -128 | 461 | 359 | -354 | -330 | 1104 | 120 | 395 | 200 | 410 | |||
| General Government Surplus/Deficit | B9 | -4,838 | -3,729 | -3,216 | -2,363 | -3,417 | -1,804 | -2,884 | -2,191 | -2,838 | -1,465 | -2,111 | -762 | -2,490 | 18 | -929 | -1,632 | -1,721 | 96 | -1,502 | 1,600 | |||
| equals | ||||||||||||||||||||||||
| Net acquisition of financial assets | ΔFA | -183 | 789 | 8,390 | -3,069 | 5,674 | -2,616 | -1,655 | -7,042 | -2,647 | -7,399 | -2,306 | -6,548 | -1,259 | 235 | 41 | -6,542 | 4,197 | -7,695 | 1,377 | -1,758 | |||
| Debt instruments | F2 + F3 + F4 | 1,297 | -399 | 8,410 | -4,924 | 6,470 | -2,808 | -400 | -7,595 | -677 | -8,235 | -2,343 | -8,329 | -109 | 1,145 | 200 | -8,421 | 4,120 | -6,087 | 1,047 | -3,447 | |||
| Equity and Investment Fund Shares | F5 | -50 | 1,390 | 5 | 481 | 56 | 477 | -1,297 | -543 | -1,194 | 569 | 282 | 252 | 477 | -830 | -36 | 629 | 630 | -1,509 | 551 | -57 | |||
| Other financial assets | F6 + F7 + F8 | -1,430 | -202 | -25 | 1,374 | -852 | -285 | 42 | 1,096 | -776 | 267 | -245 | 1,529 | -1,627 | -80 | -123 | 1,250 | -553 | -99 | -221 | 1,746 | |||
| less | ||||||||||||||||||||||||
| Net incurrence of liabilities | ΔL | 4,655 | 4,518 | 11,606 | -706 | 9,091 | -812 | 1,228 | -4,851 | 191 | -5,934 | -195 | -5,786 | 1,231 | 217 | 971 | -4,910 | 5,917 | -7,791 | 2,879 | -3,358 | |||
| Debt instruments | F2 + F3 + F4 | 4,703 | 4,553 | 11,590 | -1,146 | 9,916 | -777 | 1,277 | -4,888 | 85 | -5,959 | -160 | -6,525 | 1,105 | -12 | 904 | -4,794 | 5,867 | -7,833 | 3,131 | -3,362 | |||
| Other liabilities | F5 + F6 + F7 + F8 | -48 | -35 | 16 | 440 | -825 | -35 | -49 | 37 | 106 | 25 | -35 | 739 | 126 | 229 | 67 | -116 | 50 | 42 | -252 | 4 | |||
| Memo: Net derivative flows on debt interest swap contracts | -49 | -54 | -55 | -63 | -80 | -58 | -58 | -77 | -69 | -68 | -74 | -53 | -22 | -74 | -73 | -71 | -71 | -70 | -69 | -65 | ||||
| General Government Surplus/Deficit (% of quarterly GDP) | -11.4 | -8.3 | -7.2 | -5.4 | -7.9 | -4.1 | -6.1 | -4.9 | -6.3 | -3.1 | -4.1 | -1.5 | -4.0 | 0.0 | -1.5 | -2.4 | -2.7 | 0.2 | -2.2 | 2.2 | ||||
| Quarterly GDP at current market prices | 42,519 | 44,707 | 44,659 | 43,869 | 43,099 | 44,463 | 47,646 | 45,001 | 44,950 | 46,684 | 51,158 | 50,367 | 61,509 | 61,376 | 64,090 | 68,840 | 64,115 | 60,696 | 68,928 | 72,096 | ||||
| Table 2 General Government Net Worth, Gross and Net Debt | ||||||||||||||||||||||||||
| €million | ||||||||||||||||||||||||||
| Description | ESA2010 code | 2012 Q1 | 2012 Q2 | 2012 Q3 | 2012 Q4 | 2013 Q1 | 2013 Q2 | 2013 Q3 | 2013 Q4 | 2014 Q1 | 2014 Q2 | 2014 Q3 | 2014 Q4 | 2015 Q1 | 2015 Q2 | 2015 Q3 | 2015 Q4 | 2016 Q1 | 2016 Q2 | 2016 Q3 | 2016 Q4 | |||||
| General Government net worth | ||||||||||||||||||||||||||
| Net worth at market value, excluding pension liabilities | NW | -30,483 | -37,074 | -44,261 | -49,496 | -52,773 | -54,748 | -58,276 | -55,234 | -57,504 | -61,673 | -63,970 | -58,256 | -55,181 | -52,925 | -53,753 | -49,877 | -52,133 | -52,775 | -55,149 | -52,746 | |||||
| equals | ||||||||||||||||||||||||||
| Non-financial assets at market value | NFA | 85,981 | 86,965 | 86,924 | 87,371 | 88,030 | 88,452 | 88,726 | 90,081 | 91,349 | 92,633 | 93,549 | 95,053 | 96,673 | 97,581 | 98,512 | 100,877 | 100,998 | 101,393 | 101,594 | 102,003 | |||||
| plus | ||||||||||||||||||||||||||
| Financial net worth at market value, excluding pension liabilities | FNW | -116,464 | -124,039 | -131,185 | -136,867 | -140,803 | -143,200 | -147,002 | -145,315 | -148,853 | -154,306 | -157,519 | -153,309 | -151,854 | -150,506 | -152,265 | -150,754 | -153,131 | -154,168 | -156,743 | -154,749 | |||||
| equals | ||||||||||||||||||||||||||
| Financial assets at market value | FA | 87,704 | 86,940 | 95,694 | 92,999 | 98,672 | 95,632 | 93,964 | 94,694 | 94,351 | 86,391 | 85,221 | 84,428 | 89,719 | 84,890 | 85,768 | 84,689 | 89,708 | 82,478 | 83,435 | 80,356 | |||||
| EDP debt instruments | F2 + F3 + F4 | 55,342 | 54,399 | 62,905 | 58,316 | 63,546 | 60,525 | 60,303 | 54,237 | 53,555 | 45,918 | 43,392 | 36,535 | 36,150 | 37,991 | 38,170 | 29,459 | 33,545 | 27,460 | 28,508 | 25,102 | |||||
| Equity and Investment Fund Shares | F5 | 23,465 | 23,713 | 23,904 | 25,098 | 26,654 | 27,003 | 25,293 | 30,795 | 31,988 | 31,808 | 33,646 | 38,201 | 44,189 | 37,935 | 38,968 | 45,260 | 47,485 | 46,471 | 46,613 | 45,220 | |||||
| Other financial assets | F6 + F7 + F8 | 8,897 | 8,828 | 8,885 | 9,585 | 8,472 | 8,104 | 8,368 | 9,662 | 8,808 | 8,665 | 8,183 | 9,692 | 9,380 | 8,964 | 8,630 | 9,970 | 8,678 | 8,547 | 8,314 | 10,034 | |||||
| less | ||||||||||||||||||||||||||
| Liabilities at market value | L | 204,168 | 210,979 | 226,879 | 229,866 | 239,475 | 238,832 | 240,966 | 240,009 | 243,204 | 240,697 | 242,740 | 237,737 | 241,573 | 235,396 | 238,033 | 235,443 | 242,839 | 236,646 | 240,178 | 235,105 | |||||
| EDP debt instruments | F2 + F3 + F4 | 193,583 | 200,635 | 216,317 | 218,616 | 230,498 | 230,283 | 232,388 | 231,501 | 234,422 | 231,663 | 232,924 | 228,867 | 231,748 | 225,507 | 228,101 | 225,655 | 232,664 | 226,581 | 230,631 | 225,564 | |||||
| Other liabilities | F5 + F6 + F7 + F8 | 10,585 | 10,344 | 10,562 | 11,250 | 8,977 | 8,549 | 8,578 | 8,508 | 8,782 | 9,034 | 9,816 | 8,870 | 9,825 | 9,889 | 9,932 | 9,788 | 10,175 | 10,065 | 9,547 | 9,541 | |||||
| Memo: Estimated pension liabilities of government | 98,000 | 98,000 | 98,000 | 98,000 | 98,000 | 98,000 | 98,000 | 98,000 | 98,000 | 98,000 | 98,000 | 98,000 | 98,000 | 98,000 | 98,000 | 98,000 | 98,000 | 98,000 | 98,000 | 98,000 | ||||||
| Memo: Net worth, including pension liabilities | -128,483 | -135,074 | -142,261 | -147,496 | -150,773 | -152,748 | -156,276 | -153,234 | -155,504 | -159,673 | -161,970 | -156,256 | -153,181 | -150,925 | -151,753 | -147,877 | -150,133 | -150,775 | -153,149 | -150,746 | ||||||
| Contingent liabilities | 118,926 | 118,926 | 118,926 | 118,926 | 59,522 | 59,522 | 59,522 | 59,522 | 29,412 | 29,412 | 29,412 | 29,412 | 17,255 | 17,255 | 17,255 | 17,255 | 10,330 | 10,330 | 10,330 | 10,330 | ||||||
| Memo: Net worth, including pension liabilities and contingent liabilities | -247,409 | -254,000 | -261,187 | -266,422 | -210,295 | -212,271 | -215,798 | -212,756 | -184,915 | -189,084 | -191,382 | -185,668 | -170,436 | -168,180 | -169,008 | -165,132 | -160,463 | -161,105 | -163,479 | -161,076 | ||||||
| General Government: changes in net worth | ||||||||||||||||||||||||||
| Opening net worth | -19,555 | -30,483 | -37,074 | -44,261 | -49,496 | -52,773 | -54,748 | -58,276 | -55,234 | -57,504 | -61,673 | -63,970 | -58,256 | -55,181 | -52,925 | -53,753 | -49,877 | -52,133 | -52,775 | -55,149 | ||||||
| Change in net worth due to transactions | -4,398 | -3,270 | -3,783 | -2,442 | -3,529 | -2,155 | -3,381 | -1,608 | -2,614 | -1,224 | -2,239 | -301 | -2,131 | -336 | -1,259 | -528 | -1,600 | 492 | -1,302 | 2,010 | ||||||
| Net acquisition of non-financial assets | P5 + NP - P51c | 439 | 459 | -567 | -79 | -112 | -351 | -497 | 584 | 225 | 241 | -128 | 461 | 359 | -354 | -330 | 1,104 | 120 | 395 | 200 | 410 | |||||
| Net lending/net borrowing | B9 | -4,838 | -3,729 | -3,216 | -2,363 | -3,417 | -1,804 | -2,884 | -2,191 | -2,838 | -1,465 | -2,111 | -762 | -2,490 | 18 | -929 | -1,632 | -1,721 | 96 | -1,502 | 1,600 | |||||
| Change in net worth due to other economic flows | Kx | -6,530 | -3,320 | -3,404 | -2,793 | 253 | 179 | -147 | 4,650 | 344 | -2,945 | -58 | 6,015 | 5,206 | 2,591 | 432 | 4,405 | -657 | -1,133 | -1,073 | 394 | |||||
| Other changes in non-financial assets | 526 | 526 | 526 | 526 | 772 | 772 | 772 | 772 | 1,043 | 1,043 | 1,043 | 1,043 | 1,261 | 1,261 | 1,261 | 1,261 | 0 | 0 | 0 | 0 | ||||||
| Other changes in financial assets | -458 | -1,553 | 364 | 374 | -1 | -424 | -13 | 7,772 | 2,304 | -561 | 1,136 | 5,755 | 6,550 | -5,064 | 837 | 5,463 | 822 | 465 | -420 | -1,321 | ||||||
| Other changes in liabilities | -6,597 | -2,293 | -4,294 | -3,693 | -518 | -169 | -906 | -3,894 | -3,004 | -3,427 | -2,238 | -783 | -2,605 | 6,394 | -1,666 | -2,320 | -1,479 | -1,598 | -653 | 1,715 | ||||||
| Closing net worth | -30,483 | -37,074 | -44,261 | -49,496 | -52,773 | -54,748 | -58,276 | -55,234 | -57,504 | -61,673 | -63,970 | -58,256 | -55,181 | -52,925 | -53,753 | -49,877 | -52,133 | -52,775 | -55,149 | -52,746 | ||||||
| General Government Debt (GGDebt) | ||||||||||||||||||||||||||
| Debt instrument liabilities at market value | F2 + F3 + F4 | 193,583 | 200,635 | 216,317 | 218,616 | 230,498 | 230,283 | 232,388 | 231,501 | 234,422 | 231,663 | 232,924 | 228,867 | 231,748 | 225,507 | 228,101 | 225,655 | 232,664 | 226,581 | 230,631 | 225,564 | |||||
| + Difference between EDP face value and market value | 704 | -869 | -5,912 | -8,600 | -12,238 | -11,880 | -13,866 | -16,205 | -19,408 | -22,170 | -24,647 | -25,541 | -28,218 | -21,461 | -24,788 | -24,271 | -25,684 | -26,304 | -28,222 | -24,995 | ||||||
| Gross General Government Debt (EDP face value) | GGDebt | 194,287 | 199,766 | 210,405 | 210,016 | 218,260 | 218,403 | 218,522 | 215,296 | 215,014 | 209,493 | 208,277 | 203,326 | 203,530 | 204,046 | 203,313 | 201,384 | 206,980 | 200,277 | 202,409 | 200,569 | |||||
| less EDP debt instrument assets | F2 + F3 + F4 | -55,342 | -54,399 | -62,905 | -58,316 | -63,545 | -60,525 | -60,303 | -54,237 | -53,556 | -45,917 | -43,391 | -36,535 | -36,150 | -37,990 | -38,168 | -29,458 | -33,544 | -27,460 | -28,507 | -25,102 | |||||
| Net General Government Debt | GGNetDebt | 138,945 | 145,367 | 147,500 | 151,700 | 154,715 | 157,878 | 158,219 | 161,059 | 161,458 | 163,576 | 164,886 | 166,791 | 167,380 | 166,056 | 165,145 | 171,926 | 173,436 | 172,817 | 173,902 | 175,467 | |||||
| Closing Net Worth (% of annualised GDP) | -17.5 | -21.2 | -25.2 | -28.2 | -29.9 | -31.1 | -32.5 | -30.6 | -31.6 | -33.5 | -34.1 | -30.2 | -26.3 | -23.6 | -22.6 | -19.5 | -20.2 | -20.5 | -21.0 | -19.8 | ||||||
| Gross General Government Debt (% of annualised GDP) | 111.8 | 114.3 | 120.0 | 119.5 | 123.8 | 124.0 | 122.0 | 119.5 | 118.1 | 113.7 | 110.9 | 105.3 | 97.0 | 90.9 | 85.7 | 78.7 | 80.1 | 77.7 | 77.1 | 75.4 | ||||||
| Net General Government Debt (% of annualised GDP) | 80.0 | 83.2 | 84.1 | 86.3 | 87.7 | 89.7 | 88.4 | 89.4 | 88.7 | 88.8 | 87.8 | 86.3 | 79.8 | 74.0 | 69.6 | 67.2 | 67.1 | 67.1 | 66.2 | 66.0 | ||||||
| Annualised GDP | 173,777 | 174,821 | 175,399 | 175,754 | 176,334 | 176,090 | 179,077 | 180,209 | 182,060 | 184,281 | 187,793 | 193,159 | 209,718 | 224,410 | 237,342 | 255,815 | 258,421 | 257,741 | 262,579 | 265,835 | ||||||
| Table 3 General Government: detailed classification of revenue and output | |||||||||||||||||||||||||
| €million | |||||||||||||||||||||||||
| Description | ESA2010 code | 2012 Q1 | 2012 Q2 | 2012 Q3 | 2012 Q4 | 2013 Q1 | 2013 Q2 | 2013 Q3 | 2013 Q4 | 2014 Q1 | 2014 Q2 | 2014 Q3 | 2014 Q4 | 2015 Q1 | 2015 Q2 | 2015 Q3 | 2015 Q4 | 2016 Q1 | 2016 Q2 | 2016 Q3 | 2016 Q4 | ||||
| Total Revenue | TR | 13,628 | 14,584 | 14,688 | 16,576 | 14,120 | 15,379 | 14,870 | 17,154 | 14,981 | 16,340 | 15,937 | 18,674 | 15,942 | 17,404 | 16,599 | 20,602 | 16,282 | 18,191 | 16,999 | 21,556 | ||||
| Taxes and social contributions | 11,926 | 11,702 | 12,684 | 14,510 | 12,351 | 12,299 | 13,256 | 15,016 | 13,238 | 13,331 | 14,163 | 16,699 | 14,220 | 14,314 | 14,866 | 18,723 | 14,942 | 15,496 | 14,942 | 19,817 | |||||
| Taxes | D2 + D5 + D91 | 9,577 | 9,247 | 10,300 | 11,822 | 9,782 | 9,758 | 10,744 | 12,228 | 10,465 | 10,695 | 11,538 | 13,751 | 11,342 | 11,580 | 12,165 | 15,648 | 11,916 | 12,601 | 12,061 | 16,513 | ||||
| Indirect taxes (taxes on production and imports) | D2 | 4,905 | 3,801 | 5,444 | 4,212 | 5,130 | 3,982 | 5,650 | 4,537 | 5,539 | 4,610 | 5,785 | 5,261 | 5,942 | 4,862 | 6,272 | 5,377 | 6,252 | 5,243 | 6,466 | 5,619 | ||||
| Taxes on products | D21 | 4,329 | 3,224 | 4,873 | 3,673 | 4,540 | 3,337 | 5,017 | 3,855 | 4,700 | 3,886 | 5,079 | 4,573 | 5,038 | 4,169 | 5,575 | 4,649 | 5,604 | 4,510 | 5,760 | 4,894 | ||||
| of which Value-Added Tax | D211 | 3,050 | 1,860 | 3,149 | 2,161 | 3,025 | 1,812 | 3,434 | 2,101 | 3,200 | 2,165 | 3,481 | 2,675 | 3,325 | 2,259 | 3,758 | 2,614 | 3,630 | 2,276 | 4,021 | 2,913 | ||||
| Other taxes on production | D29 | 576 | 577 | 571 | 539 | 589 | 646 | 633 | 682 | 838 | 724 | 706 | 688 | 904 | 693 | 697 | 729 | 647 | 733 | 706 | 725 | ||||
| Direct taxes | D5 | 4,650 | 5,420 | 4,814 | 7,417 | 4,632 | 5,750 | 5,057 | 7,497 | 4,896 | 6,049 | 5,709 | 8,239 | 5,370 | 6,683 | 5,838 | 9,990 | 5,629 | 7,297 | 5,532 | 10,643 | ||||
| Taxes on income, profits and capital gains | D51 | 4,387 | 5,169 | 4,099 | 7,182 | 4,362 | 5,467 | 4,262 | 7,207 | 4,583 | 5,759 | 4,729 | 7,945 | 5,057 | 6,404 | 5,409 | 9,734 | 5,334 | 7,028 | 5,275 | 10,409 | ||||
| Other current direct taxes | D59 | 263 | 251 | 715 | 234 | 269 | 283 | 795 | 289 | 313 | 290 | 980 | 294 | 313 | 279 | 429 | 256 | 295 | 269 | 257 | 235 | ||||
| Capital taxes | D91 | 22 | 26 | 43 | 194 | 21 | 26 | 37 | 195 | 29 | 36 | 43 | 250 | 31 | 35 | 56 | 280 | 35 | 62 | 63 | 251 | ||||
| Social contributions | D61 | 2,349 | 2,455 | 2,383 | 2,688 | 2,569 | 2,541 | 2,512 | 2,788 | 2,774 | 2,636 | 2,625 | 2,948 | 2,878 | 2,734 | 2,701 | 3,075 | 3,026 | 2,895 | 2,881 | 3,304 | ||||
| Actual social contributions | D611 + D613 | 2,000 | 2,107 | 2,035 | 2,340 | 2,222 | 2,193 | 2,164 | 2,440 | 2,423 | 2,286 | 2,275 | 2,597 | 2,536 | 2,392 | 2,359 | 2,732 | 2,695 | 2,564 | 2,550 | 2,973 | ||||
| PRSI receipts | D611 + D613(pt) | 1,580 | 1,686 | 1,614 | 1,919 | 1,791 | 1,763 | 1,734 | 2,010 | 2,015 | 1,877 | 1,866 | 2,189 | 2,159 | 2,015 | 1,982 | 2,356 | 2,307 | 2,176 | 2,162 | 2,585 | ||||
| Government employees' social contributions | D613(pt) | 421 | 421 | 421 | 421 | 430 | 430 | 430 | 430 | 408 | 408 | 408 | 408 | 377 | 377 | 377 | 377 | 388 | 388 | 388 | 388 | ||||
| Employers' imputed social contributions | D612 | 348 | 348 | 348 | 348 | 347 | 347 | 347 | 347 | 351 | 351 | 351 | 351 | 342 | 342 | 342 | 342 | 331 | 331 | 331 | 331 | ||||
| Sales of goods and services | P1O | 1,082 | 1,176 | 1,275 | 1,546 | 1,198 | 1,234 | 1,111 | 1,383 | 1,076 | 1,197 | 1,203 | 1,359 | 1,168 | 1,299 | 1,305 | 1,475 | 1,086 | 1,201 | 1,206 | 1,354 | ||||
| Sales of market establishments (= market output) | P11 | 245 | 245 | 245 | 245 | 262 | 262 | 262 | 262 | 284 | 284 | 284 | 284 | 311 | 311 | 311 | 311 | 341 | 341 | 341 | 341 | ||||
| Imputed sales related to production of own-use capital assets (= output for own final use) | P12 | 10 | 10 | 10 | 10 | 8 | 8 | 8 | 8 | 8 | 8 | 8 | 8 | 5 | 5 | 5 | 5 | 5 | 5 | 5 | 5 | ||||
| Incidental sales and fees of non-market establishments | P131 | 828 | 922 | 1,021 | 1,292 | 928 | 963 | 841 | 1,113 | 784 | 905 | 910 | 1,067 | 852 | 983 | 989 | 1,159 | 741 | 855 | 860 | 1,008 | ||||
| Investment income | D4 | 462 | 1,582 | 593 | 390 | 469 | 1,757 | 412 | 543 | 513 | 1,698 | 418 | 334 | 391 | 1,658 | 305 | 264 | 87 | 1,317 | 96 | 238 | ||||
| Interest (excluding FISIM) | D41 | 370 | 448 | 407 | 369 | 411 | 329 | 335 | 330 | 321 | 291 | 214 | 211 | 179 | 174 | 166 | 154 | 79 | 74 | 67 | 34 | ||||
| Dividends | D42 | 91 | 1,132 | 185 | 20 | 58 | 1,426 | 76 | 212 | 191 | 1,407 | 203 | 122 | 211 | 1,483 | 139 | 109 | 7 | 1,241 | 27 | 203 | ||||
| Rent of land and subsoil assets | D45 | 1 | 1 | 1 | 1 | 1 | 1 | 1 | 1 | 1 | 1 | 1 | 1 | 1 | 1 | 1 | 1 | 1 | 1 | 1 | 1 | ||||
| Current transfer revenue | D39 + D7 | 68 | 57 | 53 | 73 | 50 | 45 | 40 | 60 | 77 | 71 | 67 | 81 | 66 | 58 | 54 | 73 | 66 | 58 | 54 | 73 | ||||
| Subsidies | D39 | 0 | 0 | 0 | 0 | 0 | 0 | 0 | 0 | 0 | 0 | 0 | 0 | 0 | 0 | 0 | 0 | 0 | 0 | 0 | 0 | ||||
| Other current transfers | D7 | 68 | 57 | 53 | 73 | 50 | 45 | 40 | 60 | 77 | 71 | 67 | 81 | 66 | 58 | 54 | 73 | 66 | 58 | 54 | 73 | ||||
| Non-life insurance claims | D72 | 2 | 2 | 2 | 2 | 2 | 2 | 2 | 2 | 2 | 2 | 2 | 2 | 2 | 2 | 2 | 2 | 2 | 2 | 2 | 2 | ||||
| Other Domestic - Current | D7N_S1 | 50 | 50 | 50 | 50 | 33 | 33 | 33 | 33 | 60 | 60 | 60 | 60 | 49 | 47 | 47 | 50 | 49 | 47 | 47 | 50 | ||||
| From Rest of World - Current | D7N_S2 | 16 | 5 | 1 | 21 | 16 | 10 | 6 | 26 | 16 | 10 | 6 | 20 | 16 | 10 | 6 | 21 | 16 | 10 | 6 | 21 | ||||
| Capital transfer revenue | D9N | 91 | 67 | 83 | 57 | 51 | 45 | 51 | 151 | 77 | 42 | 86 | 201 | 97 | 75 | 68 | 68 | 101 | 119 | 701 | 75 | ||||
| Output | P1 | 7,694 | 7,613 | 7,790 | 7,917 | 7,456 | 7,646 | 7,596 | 7,791 | 7,639 | 7,922 | 7,814 | 7,809 | 8,045 | 8,081 | 8,027 | 8,170 | 8,381 | 8,421 | 8,370 | 8,521 | ||||
| Market output (sales of market establishments) | P11 | 245 | 245 | 245 | 245 | 262 | 262 | 262 | 262 | 284 | 284 | 284 | 284 | 311 | 311 | 311 | 311 | 341 | 341 | 341 | 341 | ||||
| Output for own final use | P12 | 10 | 10 | 10 | 10 | 8 | 8 | 8 | 8 | 8 | 8 | 8 | 8 | 5 | 5 | 5 | 5 | 5 | 5 | 5 | 5 | ||||
| Non-market output | P13 | 7,440 | 7,359 | 7,536 | 7,663 | 7,186 | 7,376 | 7,326 | 7,520 | 7,347 | 7,629 | 7,522 | 7,517 | 7,729 | 7,765 | 7,712 | 7,854 | 8,035 | 8,076 | 8,024 | 8,176 | ||||
| = Non-market compensation of employees | D1_nonmarket | 4,933 | 4,660 | 4,696 | 4,669 | 4,825 | 4,724 | 4,537 | 4,475 | 4,761 | 4,661 | 4,475 | 4,414 | 4,912 | 4,809 | 4,617 | 4,554 | 5,051 | 4,946 | 4,748 | 4,684 | ||||
| = Total compensation of employees | D1 | 4,942 | 4,670 | 4,706 | 4,678 | 4,833 | 4,733 | 4,545 | 4,483 | 4,769 | 4,670 | 4,483 | 4,422 | 4,917 | 4,814 | 4,623 | 4,560 | 5,056 | 4,951 | 4,754 | 4,689 | ||||
| - Compensation of employees of market establishments | D1_market | 0 | 0 | 0 | 0 | 0 | 0 | 0 | 0 | 0 | 0 | 0 | 0 | 0 | 0 | 0 | 0 | 0 | 0 | 0 | 0 | ||||
| - Compensation related to production of own-use capital assets | D1_own-use | -10 | -10 | -10 | -10 | -8 | -8 | -8 | -8 | -8 | -8 | -8 | -8 | -5 | -5 | -5 | -5 | -5 | -5 | -5 | -5 | ||||
| + Non-market intermediate consumption | P2_nonmarket | 1,780 | 1,971 | 2,112 | 2,267 | 1,643 | 1,934 | 2,071 | 2,328 | 1,832 | 2,214 | 2,293 | 2,349 | 2,020 | 2,159 | 2,297 | 2,503 | 2,130 | 2,276 | 2,422 | 2,638 | ||||
| = Total intermediate consumption | P2 | 1,833 | 2,024 | 2,165 | 2,320 | 1,698 | 1,989 | 2,126 | 2,383 | 1,886 | 2,269 | 2,347 | 2,403 | 2,076 | 2,215 | 2,354 | 2,559 | 2,186 | 2,333 | 2,478 | 2,695 | ||||
| - Intermediate consumption of market establishments | P2_market | -53 | -53 | -53 | -53 | -55 | -55 | -55 | -55 | -55 | -55 | -55 | -55 | -56 | -56 | -56 | -56 | -56 | -56 | -56 | -56 | ||||
| - Intermediate consumption related to production of own-use capital assets | P2_own-use | 0 | 0 | 0 | 0 | 0 | 0 | 0 | 0 | 0 | 0 | 0 | 0 | 0 | 0 | 0 | 0 | 0 | 0 | 0 | 0 | ||||
| + Non-market consumption of fixed capital | P51c_nonmarket | 728 | 728 | 728 | 728 | 717 | 717 | 717 | 717 | 754 | 754 | 754 | 754 | 797 | 797 | 797 | 797 | 854 | 854 | 854 | 854 | ||||
| = Total consumption of fixed capital | P51c | 825 | 825 | 825 | 825 | 817 | 817 | 817 | 817 | 858 | 858 | 858 | 858 | 907 | 907 | 907 | 907 | 958 | 958 | 958 | 958 | ||||
| - Consumption of fixed capital by market establishments | P51c_market | -97 | -97 | -97 | -97 | -99 | -99 | -99 | -99 | -104 | -104 | -104 | -104 | -110 | -110 | -110 | -110 | -104 | -104 | -104 | -104 | ||||
| - Consumption of fixed capital related to production of own-use capital assets | P51c_own-use | 0 | 0 | 0 | 0 | 0 | 0 | 0 | 0 | 0 | 0 | 0 | 0 | 0 | 0 | 0 | 0 | 0 | 0 | 0 | 0 | ||||
| + Other taxes on production, payable | D29_pay | 0 | 0 | 0 | 0 | 0 | 0 | 0 | 0 | 0 | 0 | 0 | 0 | 0 | 0 | 0 | 0 | 0 | 0 | 0 | 0 | ||||
| - Other subsidies on production, receivable | D39_rec | 0 | 0 | 0 | 0 | 0 | 0 | 0 | 0 | 0 | 0 | 0 | 0 | 0 | 0 | 0 | 0 | 0 | 0 | 0 | 0 | ||||
| Table 4 General Government: detailed classification of expenditure and consumption | |||||||||||||||||||||||||
| €million | |||||||||||||||||||||||||
| Description | ESA2010 code | 2012 Q1 | 2012 Q2 | 2012 Q3 | 2012 Q4 | 2013 Q1 | 2013 Q2 | 2013 Q3 | 2013 Q4 | 2014 Q1 | 2014 Q2 | 2014 Q3 | 2014 Q4 | 2015 Q1 | 2015 Q2 | 2015 Q3 | 2015 Q4 | 2016 Q1 | 2016 Q2 | 2016 Q3 | 2016 Q4 | ||||
| Total Expenditure | TE | 18,465 | 18,313 | 17,904 | 18,939 | 17,537 | 17,183 | 17,754 | 19,345 | 17,820 | 17,805 | 18,048 | 19,436 | 18,433 | 17,385 | 17,528 | 22,234 | 18,003 | 18,095 | 18,501 | 19,956 | ||||
| Expense | 18,026 | 17,854 | 18,471 | 19,018 | 17,649 | 17,534 | 18,251 | 18,762 | 17,595 | 17,564 | 18,176 | 18,975 | 18,073 | 17,739 | 17,858 | 21,131 | 17,883 | 17,700 | 18,301 | 19,546 | |||||
| Compensation of employees | D1 | 4,942 | 4,670 | 4,706 | 4,678 | 4,833 | 4,733 | 4,545 | 4,483 | 4,769 | 4,670 | 4,483 | 4,422 | 4,917 | 4,814 | 4,623 | 4,560 | 5,056 | 4,951 | 4,754 | 4,689 | ||||
| Of which: Related to production of own-use capital assets | 10 | 10 | 10 | 10 | 8 | 8 | 8 | 8 | 8 | 8 | 8 | 8 | 5 | 5 | 5 | 5 | 5 | 5 | 5 | 5 | |||||
| Use of goods and services plus taxes payable | P2 + D5 + D29 | 1,833 | 2,025 | 2,165 | 2,320 | 1,698 | 1,989 | 2,126 | 2,383 | 1,886 | 2,269 | 2,347 | 2,403 | 2,076 | 2,215 | 2,354 | 2,559 | 2,186 | 2,333 | 2,478 | 2,695 | ||||
| Use of goods and services [Intermediate consumption] | P2 | 1,833 | 2,024 | 2,165 | 2,320 | 1,698 | 1,989 | 2,126 | 2,383 | 1,886 | 2,269 | 2,347 | 2,403 | 2,076 | 2,215 | 2,354 | 2,559 | 2,186 | 2,333 | 2,478 | 2,695 | ||||
| Of which: Intermediate consumption of market establishments | 53 | 53 | 53 | 53 | 55 | 55 | 55 | 55 | 55 | 55 | 55 | 55 | 56 | 56 | 56 | 56 | 56 | 56 | 56 | 56 | |||||
| Taxes, payable | D5 | 0 | 0 | 0 | 0 | 0 | 0 | 0 | 0 | 0 | 0 | 0 | 0 | 0 | 0 | 0 | 0 | 0 | 0 | 0 | 0 | ||||
| Depreciation (Consumption of fixed capital) | P51c | 825 | 825 | 825 | 825 | 817 | 817 | 817 | 817 | 858 | 858 | 858 | 858 | 907 | 907 | 907 | 907 | 958 | 958 | 958 | 958 | ||||
| Of which: Depreciation by market establishments | 97 | 97 | 97 | 97 | 99 | 99 | 99 | 99 | 104 | 104 | 104 | 104 | 110 | 110 | 110 | 110 | 104 | 104 | 104 | 104 | |||||
| Interest (excluding FISIM) | D41 | 1,680 | 1,759 | 1,882 | 1,973 | 1,884 | 1,827 | 1,986 | 2,022 | 1,861 | 1,906 | 1,912 | 1,904 | 1,729 | 1,693 | 1,699 | 1,718 | 1,645 | 1,564 | 1,525 | 1,445 | ||||
| Other domestic interest payable | D41_S1 | 591 | 644 | 695 | 743 | 696 | 679 | 829 | 877 | 706 | 722 | 732 | 733 | 609 | 613 | 595 | 626 | 579 | 566 | 565 | 560 | ||||
| Interest payable to rest of world | D41_S2 | 1,089 | 1,115 | 1,187 | 1,230 | 1,188 | 1,148 | 1,157 | 1,145 | 1,155 | 1,184 | 1,180 | 1,171 | 1,121 | 1,080 | 1,104 | 1,092 | 1,066 | 998 | 960 | 885 | ||||
| Subsidies | D3 | 411 | 430 | 453 | 627 | 413 | 433 | 457 | 611 | 398 | 415 | 437 | 603 | 383 | 399 | 418 | 585 | 361 | 377 | 397 | 581 | ||||
| Product subsidies | D31 | 225 | 246 | 268 | 324 | 244 | 264 | 288 | 275 | 213 | 231 | 251 | 261 | 196 | 213 | 232 | 241 | 178 | 195 | 214 | 243 | ||||
| Other subsidies on production | D39 | 186 | 184 | 186 | 303 | 169 | 168 | 169 | 335 | 185 | 184 | 185 | 342 | 187 | 185 | 187 | 344 | 183 | 182 | 183 | 337 | ||||
| Social benefits | D62 + D632 | 7,002 | 7,139 | 7,389 | 7,946 | 6,830 | 6,830 | 7,227 | 7,697 | 6,598 | 6,695 | 7,235 | 7,640 | 6,658 | 6,730 | 7,241 | 7,661 | 6,687 | 6,785 | 7,388 | 7,597 | ||||
| Social benefits in cash | D62 | 6,049 | 5,967 | 5,784 | 6,434 | 5,914 | 5,702 | 5,683 | 6,242 | 5,771 | 5,564 | 5,546 | 6,092 | 5,821 | 5,613 | 5,595 | 6,144 | 5,807 | 5,600 | 5,581 | 6,129 | ||||
| Social benefits in kind (via market producers) | D632 | 952 | 1,172 | 1,605 | 1,512 | 916 | 1,128 | 1,544 | 1,455 | 827 | 1,130 | 1,689 | 1,548 | 837 | 1,116 | 1,646 | 1,518 | 880 | 1,185 | 1,806 | 1,469 | ||||
| Other current transfers | D7 | 1,008 | 360 | 701 | 451 | 795 | 648 | 769 | 679 | 893 | 493 | 604 | 800 | 940 | 676 | 244 | 726 | 699 | 417 | 592 | 1,032 | ||||
| Net non-life insurance premiums | D71 | 19 | 19 | 19 | 19 | 14 | 14 | 14 | 14 | 19 | 19 | 19 | 19 | 20 | 20 | 20 | 20 | 20 | 20 | 20 | 20 | ||||
| Current international cooperation | D74 | 102 | 137 | 187 | 120 | 75 | 177 | 145 | 133 | 92 | 72 | 139 | 132 | 82 | 158 | 93 | 141 | 85 | 104 | 104 | 145 | ||||
| Miscellaneous current transfers | D75 | 404 | -33 | 260 | 74 | 170 | 157 | 309 | 111 | 236 | 85 | 260 | 216 | 237 | 180 | 24 | 85 | 48 | 46 | 111 | 157 | ||||
| VAT and GNI based EU budget contribution | D76 | 482 | 237 | 234 | 237 | 535 | 300 | 301 | 421 | 546 | 317 | 186 | 434 | 602 | 318 | 108 | 480 | 546 | 248 | 357 | 709 | ||||
| VAT-based EU own resources | D761 | 81 | 39 | 40 | 32 | 78 | 47 | 47 | 23 | 82 | 47 | 28 | 46 | 83 | 45 | 25 | 63 | 79 | 33 | 53 | 55 | ||||
| GNI-based EU own resources | D762 | 402 | 198 | 194 | 205 | 457 | 253 | 254 | 398 | 465 | 269 | 158 | 388 | 519 | 273 | 83 | 417 | 467 | 215 | 304 | 655 | ||||
| Capital transfers | D9 | 326 | 646 | 350 | 198 | 379 | 258 | 324 | 71 | 330 | 259 | 300 | 344 | 462 | 305 | 373 | 2,415 | 290 | 315 | 210 | 550 | ||||
| Investment grants | D92 | 326 | 366 | 350 | 198 | 341 | 258 | 324 | 71 | 330 | 259 | 289 | 162 | 425 | 266 | 373 | 304 | 290 | 315 | 210 | 550 | ||||
| Other capital transfers | D99 | 0 | 280 | 0 | 0 | 38 | 0 | 0 | 0 | 0 | 0 | 11 | 182 | 37 | 40 | 0 | 2,111 | 0 | 0 | 0 | 0 | ||||
| Net acquisition of non-financial assets | P5 + NP - P51c | 439 | 459 | -567 | -79 | -112 | -351 | -497 | 584 | 225 | 241 | -128 | 461 | 359 | -354 | -330 | 1,104 | 120 | 395 | 200 | 410 | ||||
| = Gross investment in non-financial assets | P5 + NP | 1,264 | 1,284 | 258 | 747 | 704 | 466 | 319 | 1,400 | 1,083 | 1,099 | 730 | 1,319 | 1,266 | 553 | 577 | 2,011 | 1,078 | 1,353 | 1,158 | 1,368 | ||||
| Gross fixed capital formation | P51 | 1,244 | 1,263 | 237 | 726 | 1,407 | 445 | 299 | 1,380 | 1,068 | 1,084 | 715 | 1,304 | 1,251 | 538 | 562 | 1,996 | 1,063 | 1,338 | 1,143 | 1,353 | ||||
| Net acquisition of stocks | P52 | 21 | 21 | 21 | 21 | 21 | 21 | 21 | 21 | 15 | 15 | 15 | 15 | 15 | 15 | 15 | 15 | 15 | 15 | 15 | 15 | ||||
| Net acquisition of unproduced assets | NP | 0 | 0 | 0 | 0 | -723 | 0 | 0 | 0 | 0 | 0 | 0 | 0 | 0 | 0 | 0 | 0 | 0 | 0 | 0 | 0 | ||||
| - Consumption of fixed capital | P51c | -825 | -825 | -825 | -825 | -817 | -817 | -817 | -817 | -858 | -858 | -858 | -858 | -907 | -907 | -907 | -907 | -958 | -958 | -958 | -958 | ||||
| Net expenditure on current goods and services | P3 excl. D632 | 6,613 | 6,437 | 6,514 | 6,371 | 6,258 | 6,412 | 6,485 | 6,408 | 6,563 | 6,724 | 6,611 | 6,450 | 6,877 | 6,782 | 6,722 | 6,695 | 7,294 | 7,221 | 7,164 | 7,168 | ||||
| = Output | P1 | 7,694 | 7,613 | 7,790 | 7,917 | 7,456 | 7,646 | 7,596 | 7,791 | 7,639 | 7,922 | 7,814 | 7,809 | 8,045 | 8,081 | 8,027 | 8,170 | 8,381 | 8,421 | 8,370 | 8,521 | ||||
| - Sales of goods and services | P11+P12+P131 | -1,082 | -1,176 | -1,275 | -1,546 | -1,198 | -1,234 | -1,111 | -1,383 | -1,076 | -1,197 | -1,203 | -1,359 | -1,168 | -1,299 | -1,305 | -1,475 | -1,086 | -1,201 | -1,206 | -1,354 | ||||
| Market output (sales of market establishments) | P11 | -245 | -245 | -245 | -245 | -262 | -262 | -262 | -262 | -284 | -284 | -284 | -284 | -311 | -311 | -311 | -311 | -341 | -341 | -341 | -341 | ||||
| Output for own final use | P12 | -10 | -10 | -10 | -10 | -8 | -8 | -8 | -8 | -8 | -8 | -8 | -8 | -5 | -5 | -5 | -5 | -5 | -5 | -5 | -5 | ||||
| Incidental sales and fees of non-market establishments | P131 | -828 | -922 | -1,021 | -1,292 | -928 | -963 | -841 | -1,113 | -784 | -905 | -910 | -1,067 | -852 | -983 | -989 | -1,159 | -741 | -855 | -860 | -1,008 | ||||
| Final consumption expenditure | P3 | 7,565 | 7,609 | 8,119 | 7,883 | 7,174 | 7,540 | 8,029 | 7,862 | 7,390 | 7,855 | 8,300 | 7,998 | 7,714 | 7,899 | 8,368 | 8,213 | 8,174 | 8,406 | 8,970 | 8,637 | ||||
| = Net expenditure on current goods and services | P3 excl. D632 | 6,613 | 6,437 | 6,514 | 6,371 | 6,258 | 6,412 | 6,485 | 6,408 | 6,563 | 6,724 | 6,611 | 6,450 | 6,877 | 6,782 | 6,722 | 6,695 | 7,294 | 7,221 | 7,164 | 7,168 | ||||
| + Social transfers in kind via market producers | D632 | 952 | 1,172 | 1,605 | 1,512 | 916 | 1,128 | 1,544 | 1,455 | 827 | 1,130 | 1,689 | 1,548 | 837 | 1,116 | 1,646 | 1,518 | 880 | 1,185 | 1,806 | 1,469 | ||||
| made up of | |||||||||||||||||||||||||
| Individual consumption (= social transfers in kind) | P31 (= D63) | 5,197 | 5,304 | 5,834 | 5,028 | 4,941 | 5,222 | 5,727 | 4,962 | 4,973 | 5,395 | 6,013 | 5,116 | 5,165 | 5,405 | 6,005 | 5,181 | 5,466 | 5,750 | 6,479 | 5,321 | ||||
| Social transfers in kind (via market producers) | D632 | 952 | 1,172 | 1,605 | 1,512 | 916 | 1,128 | 1,544 | 1,455 | 827 | 1,130 | 1,689 | 1,548 | 837 | 1,116 | 1,646 | 1,518 | 880 | 1,185 | 1,806 | 1,469 | ||||
| Social transfers in kind (provided directly by government) | D631 | 4,245 | 4,132 | 4,230 | 3,516 | 4,025 | 4,094 | 4,183 | 3,507 | 4,146 | 4,265 | 4,324 | 3,567 | 4,328 | 4,289 | 4,359 | 3,663 | 4,586 | 4,564 | 4,673 | 3,852 | ||||
| Collective consumption (= actual final consumption of government) | P32 | 2,368 | 2,305 | 2,285 | 2,855 | 2,233 | 2,318 | 2,302 | 2,901 | 2,417 | 2,460 | 2,287 | 2,883 | 2,549 | 2,494 | 2,363 | 3,032 | 2,708 | 2,657 | 2,491 | 3,316 | ||||
| Total social transfers | D62 + D63 | 11,246 | 11,271 | 11,619 | 11,462 | 10,855 | 10,924 | 11,410 | 11,203 | 10,744 | 10,959 | 11,559 | 11,207 | 10,986 | 11,018 | 11,600 | 11,324 | 11,273 | 11,349 | 12,061 | 11,449 | ||||
| Social benefits in cash | D62 | 6,049 | 5,967 | 5,784 | 6,434 | 5,914 | 5,702 | 5,683 | 6,242 | 5,771 | 5,564 | 5,546 | 6,092 | 5,821 | 5,613 | 5,595 | 6,144 | 5,807 | 5,600 | 5,581 | 6,129 | ||||
| Social transfers in kind (= individual consumption) | D63 | 5,197 | 5,304 | 5,834 | 5,028 | 4,941 | 5,222 | 5,727 | 4,962 | 4,973 | 5,395 | 6,013 | 5,116 | 5,165 | 5,405 | 6,005 | 5,181 | 5,466 | 5,750 | 6,479 | 5,321 | ||||
| Table 5 General Government financial transactions | ||||||||||||||||||||||||||
| €million | ||||||||||||||||||||||||||
| 2012 Q1 | 2012 Q2 | 2012 Q3 | 2012 Q4 | 2013 Q1 | 2013 Q2 | 2013 Q3 | 2013 Q4 | 2014 Q1 | 2014 Q2 | 2014 Q3 | 2014 Q4 | 2015 Q1 | 2015 Q2 | 2015 Q3 | 2015 Q4 | 2016 Q1 | 2016 Q2 | 2016 Q3 | 2016 Q4 | |||||||
| Description | ESA2010 code | |||||||||||||||||||||||||
| Net lending (+) / net borrowing (-) | B.9 | -4,838 | -3,729 | -3,216 | -2,363 | -3,417 | -1,804 | -2,884 | -2,191 | -2,838 | -1,465 | -2,111 | -762 | -2,490 | 18 | -929 | -1,632 | -1,721 | 96 | -1,502 | 1,600 | |||||
| equals | ||||||||||||||||||||||||||
| Net acquisition of financial assets | ΔA | -183 | 789 | 8,390 | -3,069 | 5,674 | -2,616 | -1,655 | -7,042 | -2,647 | -7,399 | -2,306 | -6,548 | -1,259 | 235 | 41 | -6,542 | 4,197 | -7,695 | 1,377 | -1,758 | |||||
| EDP debt instruments | F2 + F3 + F4 | 1,297 | -399 | 8,410 | -4,924 | 6,470 | -2,808 | -400 | -7,595 | -677 | -8,235 | -2,343 | -8,329 | -109 | 1,145 | 200 | -8,421 | 4,120 | -6,087 | 1,047 | -3,447 | |||||
| Currency and deposits | F2 | 1,764 | 603 | 9,627 | -6,171 | 8,587 | -2,429 | -627 | -6,733 | 2,244 | -1,029 | -275 | -7,284 | 888 | 1,638 | 765 | -3,635 | 4,543 | -6,656 | 2,227 | -3,259 | |||||
| Debt securities | F3 | -1 | -116 | -123 | 1,197 | -860 | -108 | 132 | 79 | -214 | 55 | -686 | -584 | -714 | -397 | -153 | -4,570 | -719 | 529 | -1,225 | 282 | |||||
| Short-term | F31 | -9 | -3 | 0 | 1,046 | 945 | 1 | 1 | 1,750 | -201 | 126 | -341 | -957 | -802 | 258 | -135 | -505 | -832 | -201 | -11 | 10 | |||||
| Long-term | F32 | 8 | -113 | -123 | 151 | -1,805 | -109 | 131 | -1,671 | -13 | -71 | -345 | 373 | 88 | -655 | -18 | -4,065 | 113 | 730 | -1,214 | 272 | |||||
| Loans | F4 | -466 | -886 | -1,094 | 50 | -1,257 | -271 | 95 | -941 | -2,707 | -7,261 | -1,382 | -461 | -283 | -96 | -412 | -216 | 296 | 40 | 45 | -470 | |||||
| Short-term loans | F41 | 231 | -30 | 414 | 454 | -44 | -248 | 340 | 301 | 145 | 33 | -776 | -190 | -111 | -103 | -109 | -207 | 194 | 29 | -29 | -240 | |||||
| Long-term loans | F42 | -697 | -856 | -1,508 | -404 | -1,213 | -23 | -245 | -1,242 | -2,852 | -7,294 | -606 | -271 | -172 | 7 | -303 | -9 | 102 | 11 | 74 | -230 | |||||
| Equity and Investment Fund Shares | F5 | -50 | 1,390 | 5 | 481 | 56 | 477 | -1,297 | -543 | -1,194 | 569 | 282 | 252 | 477 | -830 | -36 | 629 | 630 | -1,509 | 551 | -57 | |||||
| Other financial assets | F6 + F7 + F8 | -1,430 | -202 | -25 | 1,374 | -852 | -285 | 42 | 1,096 | -776 | 267 | -245 | 1,529 | -1,627 | -80 | -123 | 1,250 | -553 | -99 | -221 | 1,746 | |||||
| Insurance, Pensions and Standardised Guarantees | F6 | 0 | 0 | 0 | -1 | 0 | 0 | 0 | 0 | 0 | 0 | 0 | 1 | 0 | 0 | 0 | -1 | 0 | 0 | 0 | 0 | |||||
| Financial derivatives and Employee Stock Options | F7 | -75 | 0 | 0 | -1 | 164 | 0 | 0 | 32 | 17 | 27 | 23 | 30 | -372 | 4 | -1 | 2 | 0 | 0 | 0 | 0 | |||||
| Other accounts receivable/payable | F8 | -1,355 | -202 | -25 | 1,376 | -1,016 | -285 | 42 | 1,064 | -793 | 240 | -268 | 1,498 | -1,255 | -84 | -122 | 1,249 | -553 | -99 | -221 | 1,746 | |||||
| less | ||||||||||||||||||||||||||
| Net incurrence of liabilities | ΔL | 4,655 | 4,518 | 11,606 | -706 | 9,091 | -812 | 1,228 | -4,851 | 191 | -5,934 | -195 | -5,786 | 1,231 | 217 | 971 | -4,910 | 5,917 | -7,791 | 2,879 | -3,358 | |||||
| EDP debt instruments | F2 + F3 + F4 | 4,703 | 4,553 | 11,590 | -1,146 | 9,916 | -777 | 1,277 | -4,888 | 85 | -5,959 | -160 | -6,525 | 1,105 | -12 | 904 | -4,794 | 5,867 | -7,833 | 3,131 | -3,362 | |||||
| Currency and deposits | F2 | 939 | 2,681 | -534 | 716 | -30,613 | 575 | 172 | -841 | -2,842 | -6,962 | -567 | -103 | -446 | 77 | 86 | 36 | 231 | 193 | 125 | 60 | |||||
| Debt securities | F3 | -6,579 | -3,658 | 6,668 | -3,929 | 39,030 | -5,014 | -1,190 | -7,345 | 2,146 | 1,292 | 716 | 1,929 | 9,847 | 104 | 486 | -4,911 | 6,356 | -8,275 | 2,997 | -3,313 | |||||
| Short-term | F31 | -402 | 488 | 1,045 | -2,409 | 2,303 | 637 | -1,439 | -1,690 | 120 | 1,013 | 129 | 153 | 1,875 | -981 | -1,084 | -2,417 | 3,389 | -970 | 1,745 | -3,043 | |||||
| Long-term | F32 | -6,177 | -4,146 | 5,623 | -1,520 | 36,727 | -5,651 | 249 | -5,655 | 2,026 | 279 | 587 | 1,776 | 7,972 | 1,085 | 1,570 | -2,494 | 2,967 | -7,305 | 1,252 | -270 | |||||
| Loans | F4 | 10,343 | 5,530 | 5,456 | 2,067 | 1,499 | 3,662 | 2,295 | 3,298 | 781 | -289 | -309 | -8,351 | -8,296 | -193 | 332 | 81 | -720 | 249 | 9 | -109 | |||||
| Short-term loans | F41 | 11 | 1,258 | 409 | -351 | -115 | -393 | -206 | 235 | 53 | -50 | -15 | -113 | 266 | -143 | -310 | -57 | -367 | -3 | -140 | 170 | |||||
| Long-term loans | F42 | 10,332 | 4,272 | 5,047 | 2,418 | 1,614 | 4,055 | 2,501 | 3,063 | 728 | -239 | -294 | -8,238 | -8,562 | -50 | 642 | 138 | -353 | 252 | 149 | -279 | |||||
| Other liabilities | F5 + F6 + F7 + F8 | -48 | -35 | 16 | 440 | -825 | -35 | -49 | 37 | 106 | 25 | -35 | 739 | 126 | 229 | 67 | -116 | 50 | 42 | -252 | 4 | |||||
| Equity and Investment Fund Shares | F5 | 0 | 0 | 0 | 0 | 0 | 0 | 0 | 0 | 0 | 0 | 0 | 0 | 0 | 0 | 0 | 0 | 0 | 0 | 0 | 0 | |||||
| Insurance, Pensions and Standardised Guarantees | F6 | 0 | 0 | 0 | 1 | 0 | 0 | 0 | -1 | 0 | 0 | 0 | 0 | 0 | 0 | 0 | 0 | 0 | 0 | 0 | 0 | |||||
| Financial derivatives and Employee Stock Options | F7 | 0 | 0 | 0 | 1 | 0 | 0 | 0 | -1 | 0 | 0 | 0 | -1 | 0 | 0 | 0 | 0 | 0 | 0 | 0 | 0 | |||||
| Other accounts receivable/payable | F8 | -48 | -35 | 16 | 438 | -825 | -35 | -49 | 39 | 106 | 25 | -35 | 740 | 126 | 229 | 67 | -116 | 50 | 42 | -252 | 4 | |||||
| Table 6 General Government: detailed breakdown of net worth | |||||||||||||||||||||||||||
| €million | |||||||||||||||||||||||||||
| Description | ESA2010 code | 2012 Q1 | 2012 Q2 | 2012 Q3 | 2012 Q4 | 2013 Q1 | 2013 Q2 | 2013 Q3 | 2013 Q4 | 2014 Q1 | 2014 Q2 | 2014 Q3 | 2014 Q4 | 2015 Q1 | 2015 Q2 | 2015 Q3 | 2015 Q4 | 2016 Q1 | 2016 Q2 | 2016 Q3 | 2016 Q4 | ||||||
| General Government balance sheet | |||||||||||||||||||||||||||
| Net worth at market value, excluding pension liabilities | NW | -30,483 | -37,074 | -44,261 | -49,496 | -52,773 | -54,748 | -58,276 | -55,234 | -57,504 | -61,673 | -63,970 | -58,256 | -55,181 | -52,925 | -53,753 | -49,877 | -52,133 | -52,775 | -55,149 | -52,746 | ||||||
| equals | |||||||||||||||||||||||||||
| Non-financial assets at market value | NFA | 85,981 | 86,965 | 86,924 | 87,371 | 88,030 | 88,452 | 88,726 | 90,081 | 91,349 | 92,633 | 93,549 | 95,053 | 96,673 | 97,581 | 98,512 | 100,877 | 100,998 | 101,393 | 101,594 | 102,003 | ||||||
| plus | |||||||||||||||||||||||||||
| Financial net worth at market value, excluding pension liabilities | FNW | -116,464 | -124,039 | -131,185 | -136,867 | -140,803 | -143,200 | -147,002 | -145,315 | -148,853 | -154,306 | -157,519 | -153,309 | -151,854 | -150,506 | -152,265 | -150,754 | -153,131 | -154,168 | -156,743 | -154,749 | ||||||
| equals | |||||||||||||||||||||||||||
| Financial assets at market value | FA | 87,704 | 86,940 | 95,694 | 92,999 | 98,672 | 95,632 | 93,964 | 94,694 | 94,351 | 86,391 | 85,221 | 84,428 | 89,719 | 84,890 | 85,768 | 84,689 | 89,708 | 82,478 | 83,435 | 80,356 | ||||||
| EDP debt instruments | F2 + F3 + F4 | 55,342 | 54,399 | 62,905 | 58,316 | 63,546 | 60,525 | 60,303 | 54,237 | 53,555 | 45,918 | 43,392 | 36,535 | 36,150 | 37,991 | 38,170 | 29,459 | 33,545 | 27,460 | 28,508 | 25,102 | ||||||
| Currency and deposits | F2 | 20,632 | 21,235 | 30,862 | 24,852 | 33,440 | 31,008 | 30,382 | 23,649 | 25,893 | 24,875 | 24,624 | 17,376 | 18,298 | 19,925 | 20,691 | 17,254 | 21,781 | 15,127 | 17,354 | 14,107 | ||||||
| Debt securities | F3 | 8,069 | 8,021 | 7,926 | 9,470 | 8,610 | 8,487 | 8,620 | 10,249 | 10,146 | 10,239 | 9,560 | 9,646 | 8,959 | 8,520 | 8,363 | 3,289 | 2,552 | 3,082 | 1,854 | 2,162 | ||||||
| Short-term | F31 | 3 | 0 | 0 | 1,046 | 1,990 | 1,991 | 1,992 | 3,744 | 3,542 | 3,667 | 3,326 | 2,369 | 1,567 | 1,825 | 1,689 | 1,184 | 352 | 149 | 136 | 143 | ||||||
| Long-term | F32 | 8,066 | 8,021 | 7,926 | 8,424 | 6,619 | 6,496 | 6,628 | 6,505 | 6,605 | 6,571 | 6,233 | 7,277 | 7,392 | 6,694 | 6,673 | 2,104 | 2,199 | 2,933 | 1,718 | 2,019 | ||||||
| Loans | F4 | 26,641 | 25,143 | 24,117 | 23,994 | 21,496 | 21,030 | 21,301 | 20,339 | 17,516 | 10,804 | 9,208 | 9,513 | 8,893 | 9,546 | 9,116 | 8,916 | 9,212 | 9,251 | 9,300 | 8,833 | ||||||
| Short-term loans | F41 | 1,116 | 1,087 | 1,500 | 1,954 | 1,909 | 1,662 | 2,002 | 2,303 | 2,449 | 2,482 | 1,706 | 1,516 | 1,405 | 1,302 | 1,192 | 986 | 1,180 | 1,208 | 1,179 | 939 | ||||||
| Long-term loans | F42 | 25,525 | 24,056 | 22,617 | 22,040 | 19,587 | 19,368 | 19,299 | 18,036 | 15,067 | 8,322 | 7,502 | 7,997 | 7,488 | 8,244 | 7,923 | 7,930 | 8,032 | 8,043 | 8,120 | 7,894 | ||||||
| Equity and Investment Fund Shares | F5 | 23,465 | 23,713 | 23,904 | 25,098 | 26,654 | 27,003 | 25,293 | 30,795 | 31,988 | 31,808 | 33,646 | 38,201 | 44,189 | 37,935 | 38,968 | 45,260 | 47,485 | 46,471 | 46,613 | 45,220 | ||||||
| Other financial assets | F6 + F7 + F8 | 8,897 | 8,828 | 8,885 | 9,585 | 8,472 | 8,104 | 8,368 | 9,662 | 8,808 | 8,665 | 8,183 | 9,692 | 9,380 | 8,964 | 8,630 | 9,970 | 8,678 | 8,547 | 8,314 | 10,034 | ||||||
| Insurance, Pensions and Standardised Guarantees | F6 | 1 | 1 | 1 | 0 | 0 | 0 | 0 | 0 | 0 | 0 | 0 | 1 | 1 | 1 | 1 | 0 | 0 | 0 | 0 | 0 | ||||||
| Financial derivatives and Employee Stock Options | F7 | 1,339 | 1,474 | 1,557 | 897 | 792 | 700 | 914 | 1,135 | 1,048 | 639 | 398 | 352 | 1,287 | 947 | 728 | 812 | 73 | 41 | 29 | 3 | ||||||
| Other accounts receivable/payable | F8 | 7,557 | 7,353 | 7,327 | 8,688 | 7,680 | 7,404 | 7,454 | 8,527 | 7,760 | 8,026 | 7,785 | 9,339 | 8,092 | 8,016 | 7,901 | 9,158 | 8,605 | 8,506 | 8,285 | 10,031 | ||||||
| less | |||||||||||||||||||||||||||
| Liabilities at market value | L | 204,168 | 210,979 | 226,879 | 229,866 | 239,475 | 238,832 | 240,966 | 240,009 | 243,204 | 240,697 | 242,740 | 237,737 | 241,573 | 235,396 | 238,033 | 235,443 | 242,839 | 236,646 | 240,178 | 235,105 | ||||||
| EDP debt instruments | F2 + F3 + F4 | 193,583 | 200,635 | 216,317 | 218,616 | 230,498 | 230,283 | 232,388 | 231,501 | 234,422 | 231,663 | 232,924 | 228,867 | 231,748 | 225,507 | 228,101 | 225,655 | 232,664 | 226,581 | 230,631 | 225,564 | ||||||
| Currency and deposits | F2 | 59,346 | 62,020 | 61,468 | 62,099 | 31,453 | 32,035 | 32,181 | 31,356 | 28,525 | 21,572 | 21,013 | 20,918 | 20,478 | 20,561 | 20,652 | 20,713 | 20,942 | 21,132 | 21,255 | 21,315 | ||||||
| Debt securities | F3 | 85,897 | 83,125 | 94,797 | 94,287 | 135,255 | 130,599 | 130,024 | 126,265 | 131,265 | 135,388 | 138,054 | 142,372 | 154,101 | 147,520 | 149,747 | 146,741 | 153,871 | 147,164 | 150,684 | 145,193 | ||||||
| Short-term | F31 | 3,501 | 4,025 | 5,052 | 2,572 | 4,955 | 5,572 | 4,107 | 2,395 | 2,494 | 3,480 | 3,639 | 3,763 | 5,860 | 4,675 | 3,548 | 1,188 | 4,490 | 3,543 | 5,290 | 2,278 | ||||||
| Long-term | F32 | 82,396 | 79,100 | 89,745 | 91,715 | 130,300 | 125,027 | 125,917 | 123,870 | 128,771 | 131,909 | 134,416 | 138,609 | 148,241 | 142,845 | 146,200 | 145,552 | 149,380 | 143,621 | 145,394 | 142,915 | ||||||
| Loans | F4 | 48,340 | 55,490 | 60,052 | 62,230 | 63,790 | 67,649 | 70,183 | 73,880 | 74,632 | 74,703 | 73,857 | 65,577 | 57,169 | 57,426 | 57,702 | 58,201 | 57,851 | 58,285 | 58,692 | 59,056 | ||||||
| Short-term loans | F41 | 569 | 1,827 | 2,236 | 1,884 | 1,769 | 1,376 | 1,170 | 1,440 | 1,475 | 1,399 | 1,380 | 1,290 | 1,534 | 1,385 | 1,069 | 1,029 | 646 | 643 | 509 | 683 | ||||||
| Long-term loans | F42 | 47,771 | 53,663 | 57,817 | 60,345 | 62,021 | 66,274 | 69,013 | 72,440 | 73,157 | 73,303 | 72,478 | 64,287 | 55,635 | 56,041 | 56,632 | 57,171 | 57,205 | 57,641 | 58,183 | 58,373 | ||||||
| Other liabilities | F5 + F6 + F7 + F8 | 10,585 | 10,344 | 10,562 | 11,250 | 8,977 | 8,549 | 8,578 | 8,508 | 8,782 | 9,034 | 9,816 | 8,870 | 9,825 | 9,889 | 9,932 | 9,788 | 10,175 | 10,065 | 9,547 | 9,541 | ||||||
| Equity and Investment Fund Shares | F5 | 0 | 0 | 0 | 0 | 0 | 0 | 0 | 0 | 0 | 0 | 0 | 0 | 0 | 0 | 0 | 0 | 0 | 0 | 0 | 0 | ||||||
| Insurance, Pensions and Standardised Guarantees | F6 | 0 | 0 | 0 | 1 | 1 | 1 | 1 | 0 | 0 | 0 | 0 | 0 | 0 | 0 | 0 | 0 | 0 | 0 | 0 | 0 | ||||||
| Financial derivatives and Employee Stock Options | F7 | 2,558 | 2,351 | 2,553 | 2,802 | 1,354 | 961 | 1,040 | 932 | 1,100 | 1,327 | 2,144 | 457 | 1,286 | 1,120 | 1,096 | 1,068 | 1,405 | 1,253 | 987 | 977 | ||||||
| Other accounts receivable/payable | F8 | 8,027 | 7,993 | 8,009 | 8,447 | 7,622 | 7,587 | 7,537 | 7,576 | 7,682 | 7,707 | 7,672 | 8,413 | 8,539 | 8,769 | 8,836 | 8,720 | 8,770 | 8,812 | 8,560 | 8,564 | ||||||
| Memo: Estimated pension liabilities of government | 98,000 | 98,000 | 98,000 | 98,000 | 98,000 | 98,000 | 98,000 | 98,000 | 98,000 | 98,000 | 98,000 | 98,000 | 98,000 | 98,000 | 98,000 | 98,000 | 98,000 | 98,000 | 98,000 | 98,000 | |||||||
| Memo: Net worth, including pension liabilities | -128,483 | -135,074 | -142,261 | -147,496 | -150,773 | -152,748 | -156,276 | -153,234 | -155,504 | -159,673 | -161,970 | -156,256 | -153,181 | -150,925 | -151,753 | -147,877 | -150,133 | -150,775 | -153,149 | -150,746 | |||||||
| Contingent liabilities | 118,926 | 118,926 | 118,926 | 118,926 | 59,522 | 59,522 | 59,522 | 59,522 | 29,412 | 29,412 | 29,412 | 29,412 | 17,255 | 17,255 | 17,255 | 17,255 | 10,330 | 10,330 | 10,330 | 10,330 | |||||||
| Guarantees | 115,555 | 115,555 | 115,555 | 115,555 | 56,020 | 56,020 | 56,020 | 56,020 | 25,145 | 25,145 | 25,145 | 25,145 | 12,604 | 12,604 | 12,604 | 12,604 | 5,276 | 5,276 | 5,276 | 5,276 | |||||||
| Off-balance sheet PPPs and concessions | 3,371 | 3,371 | 3,371 | 3,371 | 3,502 | 3,502 | 3,502 | 3,502 | 4,266 | 4,266 | 4,266 | 4,266 | 4,651 | 4,651 | 4,651 | 4,651 | 5,054 | 5,054 | 5,054 | 5,054 | |||||||
| Memo: Net worth, including pension liabilities and contingent liabilities | -247,409 | -254,000 | -261,187 | -266,422 | -210,295 | -212,271 | -215,798 | -212,756 | -184,915 | -189,084 | -191,382 | -185,668 | -170,436 | -168,180 | -169,008 | -165,132 | -160,463 | -161,105 | -163,479 | -161,076 | |||||||
| Change in net worth of government | |||||||||||||||||||||||||||
| Opening net worth | -19,555 | -30,483 | -37,074 | -44,261 | -49,496 | -52,773 | -54,748 | -58,276 | -55,234 | -57,504 | -61,673 | -63,970 | -58,256 | -55,181 | -52,925 | -53,753 | -49,877 | -52,133 | -52,775 | -55,149 | |||||||
| Change in net worth due to transactions | -4,398 | -3,270 | -3,783 | -2,442 | -3,529 | -2,155 | -3,381 | -1,608 | -2,614 | -1,224 | -2,239 | -301 | -2,131 | -336 | -1,259 | -528 | -1,600 | 492 | -1,302 | 2,010 | |||||||
| Net acquisition of non-financial assets | P5 + NP - P51c | 439 | 459 | -567 | -79 | -112 | -351 | -497 | 584 | 225 | 241 | -128 | 461 | 359 | -354 | -330 | 1,104 | 120 | 395 | 200 | 410 | ||||||
| Net lending/net borrowing | B9 | -4,838 | -3,729 | -3,216 | -2,363 | -3,417 | -1,804 | -2,884 | -2,191 | -2,838 | -1,465 | -2,111 | -762 | -2,490 | 18 | -929 | -1,632 | -1,721 | 96 | -1,502 | 1,600 | ||||||
| = Net acquisition of financial assets | -183 | 789 | 8,390 | -3,069 | 5,674 | -2,616 | -1,655 | -7,042 | -2,647 | -7,399 | -2,306 | -6,548 | -1,259 | 235 | 41 | -6,542 | 4,197 | -7,695 | 1,377 | -1,758 | |||||||
| - Net incurrence of liabilities | -4,655 | -4,518 | -11,606 | 706 | -9,091 | 812 | -1,228 | 4,851 | -191 | 5,934 | 195 | 5,786 | -1,231 | -217 | -971 | 4,910 | -5,917 | 7,791 | -2,879 | 3,358 | |||||||
| Change in net worth due to other economic flows | Kx | -6,530 | -3,320 | -3,404 | -2,793 | 253 | 179 | -147 | 4,650 | 344 | -2,945 | -58 | 6,015 | 5,206 | 2,591 | 432 | 4,405 | -657 | -1,133 | -1,073 | 394 | ||||||
| Other changes in non-financial assets | 526 | 526 | 526 | 526 | 772 | 772 | 772 | 772 | 1,043 | 1,043 | 1,043 | 1,043 | 1,261 | 1,261 | 1,261 | 1,261 | 0 | 0 | 0 | 0 | |||||||
| Other changes in financial net worth | -7,055 | -3,846 | -3,930 | -3,319 | -519 | -593 | -919 | 3,878 | -700 | -3,988 | -1,102 | 4,972 | 3,945 | 1,330 | -829 | 3,143 | -657 | -1,133 | -1,073 | 394 | |||||||
| = Other changes in financial assets | -458 | -1,553 | 364 | 374 | -1 | -424 | -13 | 7,772 | 2,304 | -561 | 1,136 | 5,755 | 6,550 | -5,064 | 837 | 5,463 | 822 | 465 | -420 | -1,321 | |||||||
| EDP debt instruments | -717 | -544 | 96 | 335 | -1,240 | -213 | 178 | 1,529 | -5 | 598 | -183 | 1,472 | -276 | 696 | -21 | -290 | -34 | 2 | 1 | 41 | |||||||
| Equity and Investment Fund Shares | 540 | -1,142 | 186 | 713 | 1,500 | -128 | -413 | 6,045 | 2,387 | -749 | 1,556 | 4,303 | 5,511 | -5,424 | 1,069 | 5,663 | 1,595 | 495 | -409 | -1,336 | |||||||
| Other financial assets | -281 | 133 | 82 | -674 | -261 | -83 | 222 | 198 | -78 | -410 | -237 | -20 | 1,315 | -336 | -211 | 90 | -739 | -32 | -12 | -26 | |||||||
| - Other changes in liabilities | -6,597 | -2,293 | -4,294 | -3,693 | -518 | -169 | -906 | -3,894 | -3,004 | -3,427 | -2,238 | -783 | -2,605 | 6,394 | -1,666 | -2,320 | -1,479 | -1,598 | -653 | 1,715 | |||||||
| EDP debt instruments | -7,013 | -2,499 | -4,092 | -3,445 | -1,966 | -562 | -828 | -4,001 | -2,836 | -3,200 | -1,421 | -2,468 | -1,776 | 6,229 | -1,690 | -2,348 | -1,142 | -1,750 | -919 | 1,705 | |||||||
| Other liabilities | 416 | 206 | -202 | -248 | 1,448 | 393 | -78 | 107 | -168 | -227 | -817 | 1,685 | -829 | 165 | 24 | 28 | -337 | 152 | 266 | 10 | |||||||
| Closing net worth | -30,483 | -37,074 | -44,261 | -49,496 | -52,773 | -54,748 | -58,276 | -55,234 | -57,504 | -61,673 | -63,970 | -58,256 | -55,181 | -52,925 | -53,753 | -49,877 | -52,133 | -52,775 | -55,149 | -52,746 | |||||||
| Table 7 General Government Gross and Net Debt | ||||||||||||||||||||||||
| €million | ||||||||||||||||||||||||
| Description | ESA2010 code | 2012 Q1 | 2012 Q2 | 2012 Q3 | 2012 Q4 | 2013 Q1 | 2013 Q2 | 2013 Q3 | 2013 Q4 | 2014 Q1 | 2014 Q2 | 2014 Q3 | 2014 Q4 | 2015 Q1 | 2015 Q2 | 2015 Q3 | 2015 Q4 | 2016 Q1 | 2016 Q2 | 2016 Q3 | 2016 Q4 | |||
| General Government Debt | ||||||||||||||||||||||||
| Debt instrument liabilities at market value | 193,583 | 200,635 | 216,317 | 218,616 | 230,498 | 230,283 | 232,388 | 231,501 | 234,422 | 231,663 | 232,924 | 228,867 | 231,748 | 225,507 | 228,101 | 225,655 | 232,664 | 226,581 | 230,631 | 225,564 | ||||
| + Difference between face value and market value | 704 | -869 | -5,912 | -8,600 | -12,238 | -11,880 | -13,866 | -16,205 | -19,408 | -22,170 | -24,647 | -25,541 | -28,218 | -21,461 | -24,788 | -24,271 | -25,684 | -26,304 | -28,222 | -24,995 | ||||
| Gross General Government Debt (face value) | GGDebt | 194,287 | 199,766 | 210,405 | 210,016 | 218,260 | 218,403 | 218,522 | 215,296 | 215,014 | 209,493 | 208,277 | 203,326 | 203,530 | 204,046 | 203,313 | 201,384 | 206,980 | 200,277 | 202,409 | 200,569 | |||
| By category: | ||||||||||||||||||||||||
| Currency and deposits | F2 | 59,346 | 62,020 | 61,468 | 62,092 | 31,453 | 32,035 | 32,181 | 31,356 | 28,525 | 21,572 | 21,013 | 20,918 | 20,478 | 20,561 | 20,652 | 20,713 | 20,942 | 21,132 | 21,255 | 21,315 | |||
| Debt securities | F3 | 87,679 | 84,941 | 90,475 | 87,326 | 124,601 | 120,462 | 118,306 | 112,665 | 114,475 | 116,113 | 115,546 | 119,078 | 128,539 | 128,879 | 128,001 | 125,565 | 131,235 | 124,124 | 126,034 | 124,025 | |||
| Short-term | F31 | 3,497 | 4,023 | 5,043 | 2,564 | 4,959 | 5,562 | 4,102 | 2,389 | 2,489 | 3,477 | 3,637 | 3,760 | 5,849 | 4,662 | 3,532 | 1,182 | 4,482 | 3,536 | 5,283 | 2,273 | |||
| Long-term | F32 | 84,182 | 80,918 | 85,432 | 84,762 | 119,642 | 114,900 | 114,205 | 110,276 | 111,986 | 112,636 | 111,910 | 115,318 | 122,690 | 124,217 | 124,469 | 124,383 | 126,753 | 120,589 | 120,751 | 121,752 | |||
| Loans | F4 | 47,262 | 52,804 | 58,462 | 60,597 | 62,206 | 65,905 | 68,036 | 71,275 | 72,015 | 71,808 | 71,718 | 63,330 | 54,512 | 54,606 | 54,660 | 55,106 | 54,803 | 55,020 | 55,119 | 55,229 | |||
| Short-term | F41 | 569 | 1,827 | 2,236 | 1,884 | 1,769 | 1,376 | 1,170 | 1,440 | 1,475 | 1,399 | 1,380 | 1,290 | 1,534 | 1,349 | 1,069 | 1,026 | 646 | 643 | 509 | 681 | |||
| Long-term | F42 | 46,693 | 50,977 | 56,226 | 58,713 | 60,436 | 64,529 | 66,865 | 69,836 | 70,540 | 70,408 | 70,338 | 62,040 | 52,979 | 53,257 | 53,591 | 54,080 | 54,157 | 54,377 | 54,611 | 54,548 | |||
| less EDP debt instrument assets | F2 + F3 + F4 | 55,342 | 54,399 | 62,905 | 58,316 | 63,545 | 60,525 | 60,303 | 54,237 | 53,556 | 45,917 | 43,391 | 36,535 | 36,150 | 37,990 | 38,168 | 29,458 | 33,544 | 27,460 | 28,507 | 25,102 | |||
| By category: | ||||||||||||||||||||||||
| Currency and deposits | F2 | 20,632 | 21,235 | 30,862 | 24,852 | 33,440 | 31,008 | 30,382 | 23,649 | 25,893 | 24,875 | 24,624 | 17,376 | 18,298 | 19,925 | 20,691 | 17,254 | 21,781 | 15,127 | 17,354 | 14,107 | |||
| Debt securities | F3 | 8,069 | 8,021 | 7,926 | 9,470 | 8,609 | 8,487 | 8,620 | 10,249 | 10,147 | 10,238 | 9,559 | 9,646 | 8,959 | 8,519 | 8,362 | 3,288 | 2,551 | 3,082 | 1,854 | 2,162 | |||
| Short-term | F31 | 3 | 0 | 0 | 1,046 | 1,990 | 1,991 | 1,992 | 3,744 | 3,542 | 3,667 | 3,326 | 2,369 | 1,567 | 1,825 | 1,689 | 1,184 | 352 | 149 | 136 | 143 | |||
| Long-term | F32 | 8,066 | 8,021 | 7,926 | 8,424 | 6,619 | 6,496 | 6,628 | 6,505 | 6,605 | 6,571 | 6,233 | 7,277 | 7,392 | 6,694 | 6,673 | 2,104 | 2,199 | 2,933 | 1,718 | 2,019 | |||
| Loans | F4 | 26,641 | 25,143 | 24,117 | 23,994 | 21,496 | 21,030 | 21,301 | 20,339 | 17,516 | 10,804 | 9,208 | 9,513 | 8,893 | 9,546 | 9,115 | 8,916 | 9,212 | 9,251 | 9,299 | 8,833 | |||
| Short-term | F41 | 1,116 | 1,087 | 1,500 | 1,954 | 1,909 | 1,662 | 2,002 | 2,303 | 2,449 | 2,482 | 1,706 | 1,516 | 1,405 | 1,302 | 1,192 | 986 | 1,180 | 1,208 | 1,179 | 939 | |||
| Long-term | F42 | 25,525 | 24,056 | 22,617 | 22,040 | 19,587 | 19,368 | 19,299 | 18,036 | 15,067 | 8,322 | 7,502 | 7,997 | 7,488 | 8,244 | 7,923 | 7,930 | 8,032 | 8,043 | 8,120 | 7,894 | |||
| Net General Government Debt (face value) | GGNetDebt | 138,945 | 145,367 | 147,500 | 151,700 | 154,715 | 157,878 | 158,219 | 161,059 | 161,458 | 163,576 | 164,886 | 166,791 | 167,380 | 166,056 | 165,145 | 171,926 | 173,436 | 172,817 | 173,902 | 175,467 | |||
| By category: | ||||||||||||||||||||||||
| Currency and deposits | F2 | 38,714 | 40,785 | 30,606 | 37,240 | -1,987 | 1,027 | 1,799 | 7,707 | 2,632 | -3,303 | -3,611 | 3,542 | 2,180 | 636 | -39 | 3,459 | -839 | 6,005 | 3,901 | 7,208 | |||
| Debt securities | F3 | 79,610 | 76,920 | 82,549 | 77,856 | 115,992 | 111,975 | 109,686 | 102,416 | 104,328 | 105,875 | 105,987 | 109,432 | 119,580 | 120,360 | 119,639 | 122,277 | 128,684 | 121,042 | 124,180 | 121,863 | |||
| Short-term | F31 | 3,494 | 4,023 | 5,043 | 1,518 | 2,969 | 3,571 | 2,110 | -1,355 | -1,053 | -190 | 311 | 1,391 | 4,282 | 2,837 | 1,843 | -2 | 4,130 | 3,387 | 5,147 | 2,130 | |||
| Long-term | F32 | 76,116 | 72,897 | 77,506 | 76,338 | 113,023 | 108,404 | 107,577 | 103,771 | 105,381 | 106,065 | 105,677 | 108,041 | 115,298 | 117,523 | 117,796 | 122,279 | 124,554 | 117,656 | 119,033 | 119,733 | |||
| Loans | F4 | 20,621 | 27,661 | 34,345 | 36,603 | 40,710 | 44,875 | 46,735 | 50,936 | 54,499 | 61,004 | 62,510 | 53,817 | 45,619 | 45,060 | 45,545 | 46,190 | 45,591 | 45,769 | 45,820 | 46,396 | |||
| Short-term | F41 | -547 | 740 | 736 | -70 | -140 | -286 | -832 | -863 | -974 | -1,083 | -326 | -226 | 129 | 47 | -123 | 40 | -534 | -565 | -670 | -258 | |||
| Long-term | F42 | 21,168 | 26,921 | 33,609 | 36,673 | 40,849 | 45,161 | 47,566 | 51,800 | 55,473 | 62,086 | 62,836 | 54,043 | 45,491 | 45,013 | 45,668 | 46,150 | 46,125 | 46,334 | 46,491 | 46,654 | |||
Introduction
This detailed release is the official publication by the CSO of quarterly Government Finance Statistics (GFS) for the period Q1 2012 to Q4 2016. The data in this release are in line with the official publication by Eurostat of deficit and debt levels for all EU member states on 24 April 2017.
The data published in this series are consistent with the General Government Deficit and Debt levels reported at end-March 2017 under the EU regulation governing the Excessive Deficit Procedure (EDP). Consequently, they may not always be fully aligned with the National Income and Expenditure and related publications such as the Institutional Sector Accounts. National accounts are compiled in the EU according to the European System of National Accounts framework - ESA2010. The calculation methods for quarterly GFS are similiar to those used in deriving the annual GFS. As some of the available sources are of lesser reliability than those used for annual GFS, the quarterly estimates are subject to a greater margin of error than the annual figures.
The full suite of GFS tables is available on the CSO’s website by following the link:
http://www.cso.ie/en/statistics/nationalaccounts/governmentfinancestatistics/
GDP used in publication
The GDP figures used in the current publication are consistent with those published in the National Income and Expenditure 2015 and the latest Quarterly National Accounts publication.
Treatment of pre-paid margin on borrowing from the European Financial Stability Facility (EFSF)
The general government debt (GG Debt) of Ireland includes borrowings from the European Financial Stability Facility (EFSF). The terms of the agreement establishing the EFSF were that it was a facility to make loans to euro area Member States and to finance such loans by issuing or entering into funding instruments backed by guarantees. The financing was made available in the context of the financial crisis as a facility for Member States “in difficulties caused by exceptional circumstances beyond such Member States' control”.
The first of these loans to Ireland was drawn down in February 2011 and had an original maturity date of 18 July 2016. In accordance with the arrangements for EFSF borrowing at that time, a pre-paid margin of €530 million was deducted from the loan amount on disbursement and held as a cash reserve, essentially as a form of security.
The total amount shown on the GG Debt for Ireland in relation to this loan was €4,194 million. This sum includes the full pre-paid margin of €530 million. There was also a counterbalancing asset in the amount of the margin shown in the accounts.
Following a decision of the relevant Heads of State and Government on 21 July 2011 the margin was no longer applicable to new loans, and the reimbursement of the prepaid margin plus interest earned over the period fell due to Ireland and the Member State guarantors (€485 million and €45 million respectively) in proportion to the duration of the loan before and after 21 July 2011. For Ireland, therefore, this reimbursement fell due on 18 July 2016*. On this date a payment of €554.9 million was received. This payment comprises the portion of the pre-paid margin due to the Exchequer (covering the period from 21 July 2011 onwards) plus interest income.
Following clarification from Eurostat the original margin of €530 million has been recorded as interest expenditure over the period of the loan (2011-2016) and the rebate of €554.9 million has been treated as one-off capital transfer revenue in 2016. This treatment is specific to this particular loan and applies to all Member States involved in this type of borrowing from the EFSF. It does not apply to other loans drawn down from the EFSF or other programme funding accessed by Ireland during the financial crisis.
The impact of this decision is reflected in the figures published by the CSO on 24 April 2017.
*In 2013 the original loan was extended and split into two separate loans, with maturity dates in 2032 and 2033. However, the agreement to reimburse the prepaid margin on the maturity date of the original loan held under the new arrangements.
Guidance on sale of licences
On 27 March 2017 Eurostat published a guidance note on the recording of revenues arising from the sale of licences by government – see http://ec.europa.eu/eurostat/documents/1015035/7959867/Mobile-phone-licences-exploration-rights-and-other-licences.pdf
This clarifies the rules for whether sales of licences by government for use of natural resources (e.g. use of the electromagnetic spectrum for mobile phone transmissions) should be treated as the direct sale of an asset, resulting in a once-off revenue or as the rent of an asset over a prolonged period resulting in a series of revenue over the period of the licence.
As a result, the CSO are currently reviewing the treatment of past sales of mobile phone licences to bring these into line with the updated guidance. The results of this work will be reflected in the summer publication of Government Income and Expenditure.
Contingent Liabilities
(a) Public Private Partnerships (PPPs) and concessions
The terms “PPP” and concessions are used to describe long-term contractual arrangements between a government body and a private operator for the provision of a public asset and related services. A key distinction between a PPP and a concession is that in a PPP arrangement the majority of payments to the private partner are made by government while in a concession the majority of payments come from the end users of the asset.
The figures included in Table 6 for the value of off-balance sheet PPPs and concessions previously included both PPPs and some concession projects which had been historically recorded as PPPs in Ireland’s reporting to Eurostat. Following the latest Eurostat dialogue visit to Ireland in 2017 it was clarified that only genuine PPPs and not concessions should be included in the EDP reporting to Eurostat on contingent liabilities of Member States. For completeness, in this publication all off-balance sheet PPPs and concessions are now shown as part of the national reporting of contingent liabilities, resulting in an increase in the overall total to that previously reported. The Eurostat total of contingent liabilities which is based on PPPs, not including concessions, will be reduced in future EU and Department of Finance publications as a result of the exclusion of concession projects from this total.
The figures in this release reflect nominal design and construction value. A further breakdown of these figures were published on 24 April 2017 along with other EDP tables for Ireland.
(b) Guarantees
This item refers to the stock of debt of non-government bodies guaranteed by government and is based on Statement 1.11 of the Finance Accounts.
(c) Pension Liabilities
The estimated pension liability of government (the accrued liability in respect of Public Service occupational pensions) is a contingent liability of government and does not form part of the ESA accounts of general government. It is shown in this release as a memorandum item. The value shown for years 2009-2011 of €116 billion was calculated by the Comptroller and Auditor General. The value of this liability is reduced by €18 billion to €98 billion with effect from 2012. This follows an actuarial valuation carried out by the Department of Public Service and Reform. The main reasons for the reduction were the pay and pension cuts since 2009 and the freeze in pay and pension rates until after the Haddington Road Agreement. Details on this updated estimate can be accessed at:
http://www.per.gov.ie/public-service-pensions-accrued-liability/
Share transactions
In Q3 2016, AIB repurchased contingent capital for which the State received €1,600 million. The proceeds of this transaction were recorded in the Exchequer statement. For National Accounts purposes these proceeds are not treated as revenue as they are simply the exchange of one asset (equity or securities) for cash or another form of financial asset. Therefore, they have no impact on the General Government Deficit. The Balance sheet of government shows changes in the relevant instrument categories resulting from this transaction.
Investment income
In Q2 2016, the increase in Investment Income was mainly due to a dividend paid by Central Bank of €1.2 billion to the Exchequer.
Government Finance Statistics – concepts and definitions
GFS form the basis for fiscal monitoring in Europe, in particular in relation to the Excessive Deficit Procedure (EDP).
European GFS, including EDP statistics, are produced according to the legally binding accounting rules of the European System of Accounts (ESA2010). The Manual on Government Debt and Deficit (MGDD) provides further guidance on the implementation of ESA 2010 in the context of GFS.
EU Member States are required to report Government Deficit/Surplus and Debt data biannually under the EDP - before 1 April and 1 October in year N, for years N-4 to N-1 calendar years, as well as a forecast for the current year. The data are reported in harmonised tables, which provide a consistent framework for the presentation of this data by Member States. The tables provide a structure for linking national budgetary aggregates with Government Deficit and Debt.
In addition to the EDP transmission programme, detailed statistics on government revenue and expenditure are also provided to Eurostat under the ESA transmission programme. For quarterly data the main tables reported are:
Table 0801 Quarterly Non-financial accounts by sector
Table 2500 Quarterly Short Term Statistics (Revenue and Expenditure) for General Government
Table 2700 Quarterly financial accounts for General Government
Table 2800 Quarterly Government Debt
These data are available on the Eurostat website -
http://ec.europa.eu/eurostat/web/government-finance-statistics/data/main-tables.
Definition of General Government and its subsectors
The General Government sector of the economy, is defined in ESA2010 paragraph 2.111: as “institutional units which are non-market producers whose output is intended for individual and collective consumption, and are financed by compulsory payments made by units belonging to other sectors, and institutional units principally engaged in the redistribution of national income and wealth.” General Government comprises the sub-sectors Central Government (S.1311), State Government (S.1312 – which does not apply in Ireland), Local Government (S.1313), and Social Security Funds (S.1314 – which does not apply in Ireland).
General Government Deficit/Surplus (GG Deficit/Surplus) is the standard European measure of the fiscal balance, which is used to monitor compliance with the Stability and Growth Pact.
This measure is by definition equal to both Total Revenue (TR) less Total Expenditure (TE), and Net acquisition of financial assets less Net incurrence of liabilities (Tables 1 and 5). In order to respect this accounting identity, a technical adjustment is made to the level of transactions recorded in liability category F32 (long-term debt securities) to eliminate any statistical discrepancy between the two approaches to the calculation of GG Deficit/Surplus. This adjustment has no impact on Gross debt, Net debt or Net worth. For this Q3 2016 release, see note on revisions referred to earlier.
General Government Gross Debt (GG Debt) is defined in the EU regulations implementing the Maastricht Treaty as the Gross Debt Liabilities of the consolidated General Government sector, at nominal value.
‘Gross’ means that the value of any financial assets held by General Government cannot be deducted from the GG Debt. In Ireland’s case, this means that the liquid assets which are deducted from the ‘Gross’ National Debt in arriving at the audited National Debt cannot be deducted from the GG Debt.
‘Debt liabilities’ are defined as the ESA 2010 categories AF.2 (Currency and Deposits), AF.3 (Debt Securities), and AF.4 (Loans).
This definition excludes liabilities in derivatives, equity liabilities, pension and insurance liabilities and accounts payable.
‘Consolidated’ means that any money owed by one entity within General Government to another is excluded from the total GG Debt.
‘Nominal value’ is defined in the governing regulation as face value. If debt is sold at a discount, it is the undiscounted value of the instrument, rather than the amount actually received, that is shown in the GG Debt. In other statistical contexts, ‘nominal value’ means face value plus any interest accrued but not paid; however, such interest is excluded from GG Debt by definition.
General Government Net Debt is a measure produced in accordance with the methodology of the IMF/World Bank Public Sector Debt Statistics Guide, by subtracting from the GG Gross Debt figure the value of the financial assets corresponding to the categories of financial liabilities which comprise GG Gross Debt.
General Government Net Worth is calculated as the sum of financial and non-financial assets of General Government less financial liabilities.
Detailed codes and technical definitions can be seen in the ESA 2010 manual available at http://ec.europa.eu/eurostat/documents/3859598/5925693/KS-02-13-269-EN.PDF/44cd9d01-bc64-40e5-bd40-d17df0c69334
A listing of some of the main items included in this release is shown below.
Main Components of General Government Expenditure and Revenue
P.2 Intermediate consumption – value of goods and services used in the process of production, excluding fixed assets.
P.5 Gross capital formation.
P.51g Gross fixed capital formation - acquisitions, less disposals, of fixed assets during a given period plus certain additions to the value of non-produced assets realised by productive activity. Fixed assets are tangible or intangible assets produced as outputs from processes of production that are themselves used repeatedly, or continuously, in processes of production for more than one year.
P.51c Consumption of fixed capital - the amount of fixed assets used up, during the period under consideration, as a result of normal wear and tear and foreseeable obsolescence, including a provision for losses of fixed assets as a result of accidental damage which can be insured against.
P.52 Changes in inventories.
P.53 Acquisitions less disposals of valuables.
D.1 Compensation of employees – the total remuneration of Government employees.
D.29 Other taxes on production (payable) all taxes that enterprises incur as a result of engaging in production, independently of the quantity or value of the goods and services produced or sold. These include taxes on use or ownership of land or buildings, taxes on use of fixed assets, taxes on total wage bill and payroll, taxes on international transactions related to production.
D.3 Subsidies (payable) - current unrequited payments which General Government or the institutions of the European Union make to resident producers, with the objective of influencing their levels of production, their prices or the remuneration of the factors of production.
D.4 Property income accrues when the owners of financial assets and natural resources put them at the disposal of other units of the economy. The income payable for the use of financial assets is called investment income, while that payable for the use of a natural resource is called rent. Property income is the sum of investment income and rent.
D.41 Interest receivable by the owners of a financial asset for putting it at the disposal of another institutional unit. Applies to deposits (AF.2), debt securities (AF.3), loans (AF.4) and other accounts payable (AF.8).
D.42 Dividends receivable by the owners of share equities. Dividends exclude "super dividends" which arise where the dividend paid is large relative to the recent level of dividends and earnings. Super dividends are recorded as withdrawal of equity (F.5). This arises, for example, in the case of dividends paid by the Central Bank in 2015.
D.5 Current taxes on income, wealth, etc., (payable) - all compulsory, unrequited payments, in cash or in kind, levied periodically by General Government and by the rest of the world on the income and wealth of units in the economy, and some periodic taxes which are assessed neither on income nor wealth.
D.6 Social contributions - transfers to households, in cash or in kind, intended to relieve them from the financial burden of a number of risks or needs.
D.7 Other current transfers – includes VAT and GNI based EU budget contributions, current transfers between subsectors of government, current international co-operation and current transfers to households and non-profit institutions.
D.9 Capital transfers - involve the acquisition or disposal of an asset, or assets, by at least one of the parties to the transaction. Includes capital taxes and investment grants.
P.1 Total output of Government is equal to market output, own account capital formation, and non-market output (i.e. the sum of D.1+P.2+P51c). The market output referred to in this publication is the imputed market value of social housing rented dwellings. See Table 3.
P.3 Final consumption expenditure of Government is equal to the total of its output (P.1) plus the expenditure on products/services supplied to households via market producers minus the sales of goods and services (at both market and non-market prices). This is made up of individual non-market services plus collective non-market services (P.31 and P.32). See Table 4.
Categories of Financial Flows
F.1 Monetary gold and Special Drawing Rights (SDRs)
F.11 Monetary gold
F.12 Special Drawing Rights (SDRs)
F.2 Currency and deposits
F.21 Currency
F.22 Transferable deposits
F.29 Other deposits
F.3 Debt securities
F.31 Short-term
F.32 Long-term
F.4 Loans
F.41 - Short-term loans
F.42 - Long-term loans
F.5 Equity and investment fund share
F.51 Equity
F.52 Investment fund shares/units
F.6 Insurance pension and standardised guarantee schemes
F.7 Financial derivatives and employee stock options
F.71 Financial derivatives
F.72 Employee stock options
F.8 Other accounts receivable/payable
F.81 Trade credits and advances
F.89 Other Trade credits
 Hide Background Notes
Scan the QR code below to view this release online or go to
http://www.cso.ie/en/releasesandpublications/er/gfsq/governmentfinancestatisticsquarter42016/
 Show Table 1 General Government Transactions: Revenue, Expenditure, Financing and Deficit Q1 2012 to Q4 2016
 Hide Table 1 General Government Transactions: Revenue, Expenditure, Financing and Deficit Q1 2012 to Q4 2016