
| General Government Debt, Deficit and Net Worth Q1 2011 to Q4 2012 | ||||||||
| General Government Gross Debt | General Government Deficit | General Government Net Worth | ||||||
| €m | % GDP | €m | % GDP | €m | % GDP | |||
| 2011 Q1 | 155,863 | 100.2 | -4,945 | -13.0 | -16,293 | -10.5 | ||
| 2011 Q2 | 158,785 | 101.5 | -2,741 | -6.7 | -18,467 | -11.8 | ||
| 2011 Q3 | 162,376 | 103.6 | -11,589 | -29.0 | -47,262 | -30.1 | ||
| 2011 Q4 | 169,226 | 106.4 | -1,993 | -5.0 | -47,232 | -29.7 | ||
| 2012 Q1 | 174,289 | 108.4 | -5,031 | -12.6 | -58,109 | -36.1 | ||
| 2012 Q2 | 180,978 | 111.9 | -2,626 | -6.2 | -62,772 | -38.8 | ||
| 2012 Q3 | 191,791 | 117.7 | -3,634 | -8.8 | -71,386 | -43.8 | ||
| 2012 Q4 | 192,461 | 117.6 | -1,171 | -2.9 | -77,283 | -47.2 | ||
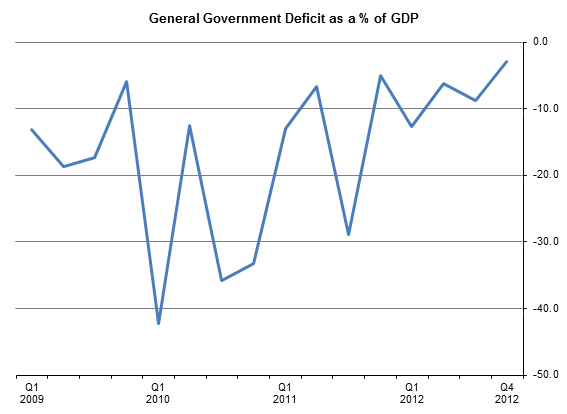
General Government Deficit
Ireland’s General Government Deficit showed substantial variation during the quarters of 2009-2011, ranging from a high of over 42% of Q1 2010 GDP to 5% of Q4 2011 GDP, its lowest point in the period. In 2012, the range was in the order of 10 percentage points (from 12.8% of GDP in Q1 to 2.9% in Q4) and overall the deficit levels were lower than in the earlier years.
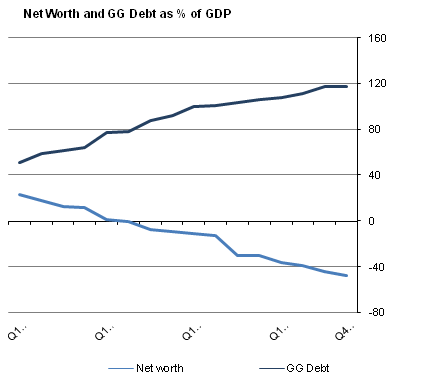
General Government Debt and Net Worth
General Government Gross Debt (GGDebt) and Net Worth showed fairly stable patterns on a quarterly basis during 2009-2012. Quarterly GGDebt comprises specific financial instruments (currency and deposits, securities other than shares, excluding financial derivatives, and loans), recorded at face value. As it is a gross figure, no financial assets are deducted in its calculation. GGDebt rose from €85.5 billion at the end of Q1 2009 to €192.5 billion by end 2012.
Net Worth (non financial assets plus financial assets less liabilities) of General Government showed a similar, although declining, pattern over the same quarters falling from a positive value of €41.3 billion in Q1 2009 to a negative net worth of €77.3 billion by end 2012.
Tables showing the full series for 2009 - 2012 are available at: http://www.cso.ie/en/releasesandpublications/nationalaccounts/governmentfinancestatistics
| Table 1 General Government Transactions: Revenue, Expenditure, Financing and Deficit Q1 2011 TO Q4 2012 | |||||||||
| €m | |||||||||
| Description | ESA code | 2011 Q1 | 2011 Q2 | 2011 Q3 | 2011 Q4 | 2012 Q1 | 2012 Q2 | 2012 Q3 | 2012 Q4 |
| General Government transactions | |||||||||
| Revenue | TR | 11,764 | 14,062 | 13,105 | 16,482 | 11,848 | 14,269 | 13,697 | 16,781 |
| Taxes and social contributions | 10,310 | 11,663 | 11,576 | 14,327 | 10,393 | 11,734 | 12,056 | 15,018 | |
| Taxes | D2 + D5 + D91 | 7,669 | 9,235 | 9,057 | 11,665 | 8,138 | 9,398 | 9,701 | 12,457 |
| Social contributions | D61 | 2,641 | 2,429 | 2,519 | 2,662 | 2,255 | 2,336 | 2,355 | 2,562 |
| Sales of goods and services | P1O | 1,107 | 1,232 | 1,242 | 1,505 | 1,036 | 1,127 | 1,222 | 1,483 |
| Investment income | D4 | 263 | 1,134 | 258 | 346 | 280 | 1,376 | 392 | 208 |
| Current transfer revenue | D7 | 28 | 12 | 7 | 17 | 21 | 11 | 6 | 26 |
| Capital transfer revenue | D9 | 56 | 22 | 22 | 287 | 117 | 21 | 20 | 45 |
| Expenditure | TE | 16,676 | 16,770 | 24,661 | 18,442 | 16,829 | 16,840 | 17,275 | 17,889 |
| Expense | 16,498 | 16,714 | 24,315 | 17,394 | 16,627 | 16,756 | 17,107 | 17,955 | |
| Compensation of employees | D1 | 4,874 | 4,680 | 4,720 | 4,839 | 4,889 | 4,617 | 4,653 | 4,625 |
| Use of goods and services plus taxes payable | P2 + D5 + D29 | 1,962 | 2,295 | 2,254 | 2,380 | 1,908 | 2,014 | 2,066 | 2,576 |
| Depreciation (Consumption of fixed capital) | K1 | 629 | 629 | 629 | 629 | 578 | 578 | 578 | 578 |
| Interest (excluding FISIM) | D41 | 1,223 | 1,289 | 1,447 | 1,231 | 1,298 | 1,433 | 1,646 | 1,534 |
| Subsidies | D3 | 127 | 122 | 149 | 242 | 100 | 119 | 141 | 279 |
| Social benefits | D62 + D631 | 6,717 | 7,048 | 7,624 | 7,379 | 6,924 | 7,040 | 7,400 | 7,302 |
| Other current transfers | D7 | 700 | 564 | 523 | 536 | 695 | 483 | 430 | 644 |
| Capital transfers | D9 | 266 | 87 | 6,968 | 157 | 235 | 473 | 194 | 416 |
| Net operating balance | -4,734 | -2,652 | -11,210 | -911 | -4,780 | -2,488 | -3,411 | -1,174 | |
| Net acquisition of non-financial assets | P5 + NP - K1 | 178 | 56 | 345 | 1,048 | 202 | 84 | 168 | -66 |
| Net lending (+) / net borrowing (-) | B9 | -4,946 | -2,741 | -11,590 | -1,994 | -5,030 | -2,625 | -3,634 | -1,171 |
| equals | |||||||||
| Net acquisition of financial assets | 7,497 | -982 | -6,657 | 3,263 | 1,866 | 2,124 | 8,694 | -2,347 | |
| Debt instruments | F2 + F33 + F4 | 11,004 | -1,573 | -12,679 | 2,567 | 2,330 | 418 | 9,719 | -3,862 |
| Shares and other equity | F5 | -3,791 | 788 | 7,440 | -854 | -50 | 1,388 | 4 | 473 |
| Other financial assets | F34 + F61 + F62 + F7 | 284 | -197 | -1,418 | 1,550 | -414 | 318 | -1,029 | 1,042 |
| less | |||||||||
| Net incurrence of liabilities | 12,409 | 1,725 | 4,899 | 5,223 | 6,847 | 4,695 | 12,273 | -1,239 | |
| Debt instruments | F2 + F33 + F4 | 11,153 | 1,965 | 5,109 | 6,202 | 5,402 | 5,018 | 12,552 | -281 |
| Other liabilities | F34 + F5 + F61 + F62 + F7 | 1,256 | -240 | -210 | -979 | 1,445 | -323 | -279 | -958 |
| General Government Deficit | |||||||||
| Net lending / net borrowing | B9 | -4,912 | -2,707 | -11,556 | -1,960 | -4,981 | -2,571 | -3,579 | -1,108 |
| Adjustment for swaps | -34 | -34 | -34 | -34 | -49 | -54 | -55 | -63 | |
| General Government Surplus/Deficit | EDP_B9 | -4,946 | -2,741 | -11,590 | -1,994 | -5,030 | -2,625 | -3,634 | -1,171 |
| Table 2 General Government: Net Worth, Gross and Net Debt Q1 2011 TO Q4 2012 | |||||||||
| €m | |||||||||
| Description | ESA code | 2011 Q1 | 2011 Q2 | 2011 Q3 | 2011 Q4 | 2012 Q1 | 2012 Q2 | 2012 Q3 | 2012 Q4 |
| General Government net worth | |||||||||
| Net worth at market value, excluding pension liabilities | -16,293 | -18,467 | -47,262 | -47,232 | -58,109 | -62,772 | -71,386 | -77,283 | |
| equals | |||||||||
| Non-financial assets at market value | 58,106 | 57,787 | 57,468 | 57,148 | 57,350 | 57,434 | 57,601 | 57,535 | |
| plus | |||||||||
| Financial net worth at market value, excluding pension liabilities | -74,399 | -76,254 | -104,730 | -104,380 | -115,459 | -120,206 | -128,987 | -134,818 | |
| equals | |||||||||
| Financial assets at market value | 71,470 | 67,222 | 59,212 | 62,743 | 65,141 | 66,434 | 75,617 | 72,926 | |
| EDP debt instruments | AF2 + AF33 + AF4 | 42,726 | 40,902 | 28,247 | 30,839 | 33,318 | 33,857 | 43,602 | 40,088 |
| Shares and other equity | AF5 | 19,702 | 17,437 | 23,158 | 22,581 | 22,991 | 22,877 | 23,266 | 23,895 |
| Other financial assets | AF34 + AF61 + AF62 + AF7 | 9,042 | 8,883 | 7,807 | 9,323 | 8,832 | 9,700 | 8,749 | 8,943 |
| less | |||||||||
| Liabilities at market value | 145,869 | 143,476 | 163,942 | 167,123 | 180,600 | 186,640 | 204,604 | 207,744 | |
| EDP debt instruments | AF2 + AF33 + AF4 | 139,161 | 137,005 | 157,262 | 161,089 | 173,137 | 179,271 | 197,314 | 201,105 |
| Other liabilities | AF34 + AF61 + AF62 + AF7 | 6,708 | 6,471 | 6,680 | 6,034 | 7,463 | 7,369 | 7,290 | 6,639 |
| Memo: Estimated pension liabilities of government | 116,000 | 116,000 | 116,000 | 116,000 | 116,000 | 116,000 | 116,000 | 116,000 | |
| Memo: Net worth, including pension liabilities | -132,293 | -134,467 | -163,262 | -163,232 | -174,109 | -178,772 | -187,386 | -193,283 | |
| Contingent liabilities | 147,241 | 147,241 | 147,241 | 147,241 | 119,306 | 119,306 | 119,306 | 119,306 | |
| Memo: Net worth, including pension liabilities and contingent liabilities | -279,534 | -281,709 | -310,504 | -310,473 | -293,415 | -298,079 | -306,692 | -312,589 | |
| General Government: changes in net worth | |||||||||
| Opening net worth | -14,242 | -16,293 | -18,467 | -47,262 | -47,232 | -58,109 | -62,772 | -71,386 | |
| Change in net worth due to transactions | -4,734 | -2,652 | -11,210 | -911 | -4,780 | -2,488 | -3,411 | -1,174 | |
| Net acquisition of non-financial assets | 178 | 56 | 345 | 1,048 | 202 | 84 | 168 | -66 | |
| Net lending/net borrowing | -4,912 | -2,707 | -11,556 | -1,960 | -4,981 | -2,571 | -3,579 | -1,108 | |
| Change in net worth due to other economic flows | 2,683 | 478 | -17,585 | 942 | -6,098 | -2,176 | -5,202 | -4,723 | |
| Other changes in non-financial assets | -497 | -375 | -665 | -1,367 | 0 | 0 | 0 | 0 | |
| Other changes in financial assets | -1,434 | -3,266 | -1,353 | 268 | 532 | -831 | 489 | -344 | |
| Other changes in liabilities | 4,614 | 4,118 | -15,567 | 2,042 | -6,630 | -1,345 | -5,691 | -4,379 | |
| Closing net worth | -16,293 | -18,467 | -47,262 | -47,232 | -58,109 | -62,772 | -71,386 | -77,283 | |
| General Government Debt (GGDebt) | |||||||||
| Debt instrument liabilities at market value | 139,161 | 137,005 | 157,262 | 161,089 | 173,137 | 179,271 | 197,314 | 201,105 | |
| + Difference between face value and market value | 16,702 | 21,780 | 5,114 | 8,137 | 1,152 | 1,707 | -5,523 | -8,644 | |
| Gross General Government Debt (face value) | 155,863 | 158,785 | 162,376 | 169,226 | 174,289 | 180,978 | 191,791 | 192,461 | |
| less EDP debt instrument assets | -42,726 | -40,902 | -28,247 | -30,839 | -33,318 | -33,857 | -43,602 | -40,088 | |
| Net General Government Debt (face value) | 113,137 | 117,883 | 134,129 | 138,387 | 140,971 | 147,121 | 148,189 | 152,373 | |
Introduction
This release is the first in a new series being published by the Central Statistics Office. It coincides with the release of EU wide General Government Debt and Deficit figures by Eurostat as reported under the Excessive Deficit Procedure (EDP) at end March 2013. Up to 2012, the EDP returns for Ireland had been prepared and transmitted to Eurostat by the Department of Finance with input from the CSO. From 2013 the CSO have assumed responsibility for the historic components of this return, in addition to the existing Government Finance Statistics reporting already undertaken by the Office to Eurostat. The Department of Finance retain responsibility for the preparation of the current year forecasts included in the EDP return.
Government Finance Statistics – Concepts and Definitions
Government Finance Statistics (GFS) form the basis for fiscal monitoring in Europe, in particular in relation to the Excessive Deficit Procedure (EDP).
European GFS, including EDP statistics are produced according to the legally binding accounting rules of the European System of Accounts 1995 (ESA95). The Manual on Government Debt and Deficit (MGDD) provides further guidance on the implementation of ESA95 in the context of GFS.
The ESA 95 regulation sets out both a methodology for the compilation of National Accounts and a programme of transmission of key economic aggregates which are a subset of the full set of accounts set out in ESA 95. In relation to GFS aggregates of interest include: general government revenue and expenditure, general government surplus/deficit, general government consolidated gross debt and their main components.
EU Member States are required to report government deficit/surplus and debt data biannually under the EDP (before 1 April and 1 October in year N) for years N-4 to N-1 calendar years as well as a forecast for the current year. The data are reported in harmonised tables, which provide a consistent framework for the presentation of this data by Member States. The tables provide a structure for linking national budgetary aggregates with government deficit and debt.
Detailed statistics on Government revenue and expenditure are also provided to Eurostat under the ESA95 transmission programme. For quarterly data the main tables reported are:
Table 2500 Quarterly non-financial accounts for general government ,
Table 2700 Quarterly financial accounts for general government
Table 2800 Quarterly government debt.
Total general government expenditure and revenue are defined according to Commission Regulation (EC) No 1500/2000 of 10 July 2000 on general government expenditure and revenue. They comprise specific categories of ESA 95.
Definition of general government and its subsectors
The general government sector of the economy, is defined in ESA95, paragraph 2.68: 'All institutional units which are other non-market producers [institutional units whose sales do not cover more than the 50% of the production costs, see ESA95 paragraph 3.26] whose output is intended for individual and collective consumption, and mainly financed by compulsory payments made by units belonging to other sectors, and/or all institutional units principally engaged in the redistribution of national income and wealth'. General government comprises the sub-sectors central government (S.1311), state government (S.1312 - where applicable), local government (S.1313), and social security funds (S.1314).
As part of the GFS production process CSO is required to define the General Government and public sectors for Ireland. In this context, the public sector includes all bodies that are directly or indirectly controlled by a Government department or office, or by a local authority. General Government, in turn, includes all public sector bodies that are also mainly financed by Government bodies. The decision rules governing the classification of bodies to the public and General Government sectors are set out in detail in the Manual on Government Deficit and Debt. A detailed explanation of the application of these rules and the most up-to-date list of public sector and (including general government bodies) for Ireland are shown at
http://www.cso.ie/en/surveysandmethodology/nationalaccounts/ .
General Government Deficit/Surplus (GG Deficit) is the standard European measure of the fiscal balance, which is used to monitor compliance with the Stability and Growth Pact. It is the difference between the revenue and the expenditure of the general government sector. The government deficit data related to the EDP (EDP B.9) differs from the deficit according to ESA95 (B.9) in the treatment of interest relating to swaps and forward rate agreements.
General Government Debt (GG Debt) is defined in the EU regulations implementing the Maastricht Treaty as the gross debt liabilities of the consolidated General Government sector, at nominal value.
‘Gross’ means that the value of any financial assets held by General Government cannot be deducted from the GGDebt. In Ireland’s case, this means that the liquid assets which are deducted from the ‘gross’ National Debt in arriving at the audited National Debt cannot be deducted from the GGDebt.
‘Debt liabilities’ are defined as the ESA categories AF.2 (Currency and deposits), AF.33 (Securities other than shares, excluding financial derivatives), and AF.4 (loans).
This definition excludes liabilities in derivatives (AF.34), equity liabilities (AF.5), pension and insurance liabilities (AF.6) and accounts payable (AF.7).
‘Consolidated’ means that any money owed by one entity within General Government to another is excluded from the total GGDebt.
‘Nominal value’ is defined in the governing regulation as face value. If debt is sold at a discount, it is the undiscounted value of the instrument, rather than the amount actually received, that is shown in the GGDebt. In other statistical contexts, ‘nominal value’ means face value plus any interest accrued but not paid; however, such interest is excluded from GGDebt by definition.
ESA 95 codes and an explanation of each are shown below for the main components of Government revenue and expenditure as well as for types of financial flows. More detailed codes and technical definitions can be seen in the ESA 95 manual available at http://circa.europa.eu/irc/dsis/nfaccount/info/data/esa95/en/esa95en.htm.
Main Components of General Government Expenditure and Revenue
P.2 Intermediate consumption – value of goods and services used in the process of production, excluding fixed assets
P.5 Gross capital formation
P.51 Gross fixed capital formation - acquisitions, less disposals, of fixed assets during a given period plus certain additions to the value of non-produced assets realised by productive activity. Fixed assets are tangible or intangible assets produced as outputs from processes of production that are themselves used repeatedly, or continuously, in processes of production for more than one year
P.52 Changes in inventories
P.53 Acquisitions less disposals of valuables
D.1 Compensation of employees – the total remuneration of government employees
D.11 Wages and salaries, in cash and in kind
D.12 Employers social contributions – actual (D.121) and imputed (D.122)
D.29 Other taxes on production (payable) all taxes that enterprises incur as a result of engaging in production, independently of the quantity or value of the goods and services produced or sold. These include taxes on use or ownership of land or buildings, taxes on use of fixed assets, taxes on total wage bill and payroll, taxes on international transactions related to production.
D.3 Subsidies (payable) - current unrequited payments which general government or the Institutions of the European Union make to resident producers, with the objective of influencing their levels of production, their prices or the remuneration of the factors of production
D.4 Property income (payable) - the income receivable by the owner of a financial asset or a tangible non-produced asset in return for providing funds to, or putting the tangible non-produced asset at the disposal of, another unit
D.41 Interest (payable) - excludes settlements under swaps and forward rate arrangements, as these are treated as financial transactions in the ESA 95
D.5 Current taxes on income, wealth, etc, (payable) - all compulsory, unrequited payments, in cash or in kind, levied periodically by general government and by the rest of the world on the income and wealth of units in the economy, and some periodic taxes which are assessed neither on income nor wealth
D.6 Social contributions - transfers to households, in cash or in kind, intended to relieve them from the financial burden of a number of risks or needs, made through collectively organised schemes, or outside such schemes by government and non-profit institutions. These include payments from general government to producers which individually benefit households and which are made in the context of social risks or needs
D.62 Social benefits in cash - social benefits and pensions paid in cash;
D.631 Social transfers in kind, via market producers - can be subdivided into those where beneficiary households actually purchase the goods and services themselves and are then reimbursed, and those where the relevant services are provided directly to the beneficiaries
D.7 Other current transfers
D.9 Capital transfers - involve the acquisition or disposal of an asset, or assets, by at least one of the parties to the transaction.
K.1 Consumption of fixed capital - the amount of fixed assets used up, during the period under consideration, as a result of normal wear and tear and foreseeable obsolescence, including a provision for losses of fixed assets as a result of accidental damage which can be insured against.
Categories of Financial Flows
F.1 Monetary gold and special drawing rights (SDRs)
F.11 Monetary gold
F.12 Special drawing rights (SDRs)
F.2 Currency and deposits
F.21 Currency
F.22 Transferable deposits
F.29 Other deposits
F.3 Securities other than shares
F.33 Securities other than shares, excluding financial derivatives
(F.331 - Short-term,
F.332 - Long-term )
F.34 Financial derivatives
F.4 Loans
F.41 - Short-term
F.42 - Long-term
F.5 Shares and other equity
F.51 Shares and other equity, excluding mutual funds shares
(F.511 - Quoted shares,
F.512 - Unquoted shares,
F.513 - Other equity )
F.52 Mutual funds shares
F.6 Insurance technical reserves
F.61 Net equity of households in life insurance reserves and in pension funds reserves
(F.611 - Net equity of households in life insurance reserves,
F.612 - Net equity of households in pension funds reserves)
F.62 - Prepayments of insurance premiums and reserves for outstanding claims
F.7 Other accounts receivable/payable
F.71 Trade credits and advances
F.79 Other
 Hide Background Notes
Scan the QR code below to view this release online or go to
http://www.cso.ie/en/releasesandpublications/er/gfsq/governmentfinancestatisticsquarter42012/
 Show Table 1 General Government Transactions: Revenue, Expenditure, Financing and Deficit Q1 2011 TO Q4 2012
 Hide Table 1 General Government Transactions: Revenue, Expenditure, Financing and Deficit Q1 2011 TO Q4 2012