
| General Government Finances | ||||||
| Balance | Gross Debt | Net Debt | ||||
| % quarterly | % annualised | % annualised | ||||
| €bn | GDP | €bn | GDP | €bn | GDP | |
| 2018 Q1 | -1.8 | -2.3 | 210.3 | 68.5 | 177.6 | 57.8 |
| 2018 Q2 | -0.6 | -0.8 | 214.6 | 68.3 | 177.0 | 56.3 |
| 2018 Q3 | -1.6 | -1.8 | 215.8 | 67.2 | 177.8 | 55.4 |
| 2018 Q4 | 4.1 | 4.9 | 206.0 | 63.6 | 177.9 | 54.9 |
| 2019 Q1 | -1.6 | -1.9 | 215.0 | 65.4 | 178.9 | 54.4 |
| 2019 Q2 | 1.5 | 1.9 | 213.7 | 63.9 | 175.9 | 52.6 |
| 2019 Q3 | -0.6 | -0.7 | 212.9 | 62.6 | 175.6 | 51.6 |
| 2018 Q1-Q3 | -3.9 | -1.6 | ||||
| 2019 Q1-Q3 | -0.7 | -0.3 | ||||
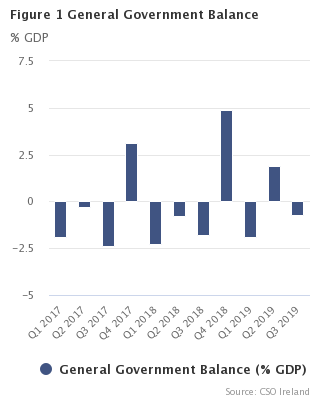
The government recorded a deficit of €0.7 billion (-0.3% of GDP) in the first nine months of 2019. This compares with a deficit of €3.9 billion (-1.6% of GDP) for the same period last year (Table 1).
In the first nine months of 2019, government revenue increased by €4.4 billion (+7.9%) compared with the same period of 2018. The main driving factor was an 8.1% increase in Taxes and social contributions (Tables 1 and 3).
Expenditure levels of government increased by €1.2 billion (+1.9%) when comparing the first nine months of 2019 and 2018. Increases in Compensation of employees/pay (+4.4%), Use of goods and services (+4.6%) and Social benefits (+2.7%) were partially offset by a decrease in Interest (-16.9%) (Tables 1 and 4).
Government Gross Debt at 62.6% of GDP at end Q3 2019
General Government Gross Debt (GG Debt) stood at €212.9 billion (62.6% of annualised GDP) at the end of September 2019, compared with a debt level of €215.8 billion (67.2%) at end Q3 2018. The fall in the ratio was mainly due to an increase in GDP over the year (Table 2). The gross debt per capita at the end of Q3 2019 stood at €43,266 (Figure 3).
At the end of September 2019, General Government Net Debt was €175.6 billion (51.6% of annualised GDP) compared with €177.8 billion (55.4%) at end Q3 2018.
The market value of Equity and Investment Fund Shares fell by €6.1 billion over the same period. This decrease in the value of the investment portfolio was caused by a combination of net sales of these assets (€2.7 billion) and stock market losses (€3.4 billion) predominantly due to shares held by the State in Irish banks (Tables 2, 5 and 6). Quarter on quarter the value of the State's investment portfolio fell by €2.6 billion and, again, this was driven largely by the fall in market valuation of the Irish banks in which the State holds shares.
|
Government accounts are compiled in the EU according to the European System of National Accounts 2010 (ESA2010) framework. For this publication data for Q1 and Q2 2019 have been revised due to increased data availability. Pre-2019 data remains unchanged to that published in the 2019 Q2 publication on 18 October 2019. Pre-2019 Government Finance Statistics (GFS) are benchmarked to the most recent EDP notification as published on 18 October 2019. Consequently, they may not always be fully aligned with the National Income and Expenditure and related publications such as the Institutional Sector Accounts and the Quarterly National Accounts. The calculation methods for quarterly GFS are similar to those used in deriving the annual GFS. As some of the available sources are of lesser reliability than those used for the annual GFS, the quarterly estimates are subject to a greater margin of error than the annual figures. A full description of the concepts and definitions used in the production of these statistics is provided in the Background notes. |
| GG Gross Debt | GG Net Debt | |
| Q1 2017 | 75.7 | 64.6 |
| Q2 2017 | 75.1 | 61.7 |
| Q3 2017 | 72.6 | 59.9 |
| Q4 2017 | 67.8 | 59.2 |
| Q1 2018 | 68.5 | 57.8 |
| Q2 2018 | 68.3 | 56.3 |
| Q3 2018 | 67.2 | 55.4 |
| Q4 2018 | 63.6 | 54.9 |
| Q1 2019 | 65.4 | 54.4 |
| Q2 2019 | 63.9 | 52.6 |
| Q3 2019 | 62.6 | 51.6 |
| GG Gross Debt per Capita | |
| 2007 Q3 | 12642 |
| 2008 Q3 | 16288 |
| 2009 Q3 | 22987 |
| 2010 Q3 | 30714 |
| 2011 Q3 | 41252 |
| 2012 Q3 | 45999 |
| 2013 Q3 | 47574 |
| 2014 Q3 | 45145 |
| 2015 Q3 | 43423 |
| 2016 Q3 | 42730 |
| 2017 Q3 | 44027 |
| 2018 Q3 | 44433 |
| 2019 Q3 | 43266 |
| Table 1 General Government transactions: revenue, expenditure, financing and deficit | |||||||||||||||||||
| €million | |||||||||||||||||||
| Description | ESA2010 code | 2016 Q1 | 2016 Q2 | 2016 Q3 | 2016 Q4 | 2017 Q1 | 2017 Q2 | 2017 Q3 | 2017 Q4 | 2018 Q1 | 2018 Q2 | 2018 Q3 | 2018 Q4 | 2019 Q1 | 2019 Q2 | 2019 Q3 | |||
| General Government transactions | |||||||||||||||||||
| Revenue | TR | 16,400 | 18,360 | 17,074 | 21,647 | 17,384 | 18,712 | 17,639 | 22,840 | 17,788 | 19,841 | 18,684 | 26,024 | 18,847 | 21,535 | 20,356 | |||
| Taxes and social contributions | D2 + D5 + D91 + D61 | 14,860 | 15,428 | 14,874 | 19,661 | 15,547 | 16,031 | 15,916 | 20,818 | 16,120 | 17,303 | 16,894 | 23,707 | 17,224 | 18,660 | 18,519 | |||
| Taxes | D2 + D5 + D91 | 11,846 | 12,546 | 12,005 | 16,372 | 12,365 | 12,980 | 12,891 | 17,424 | 12,757 | 14,062 | 13,689 | 20,053 | 13,620 | 15,153 | 15,072 | |||
| Social contributions | D61 | 3,014 | 2,882 | 2,869 | 3,289 | 3,182 | 3,052 | 3,026 | 3,394 | 3,363 | 3,241 | 3,205 | 3,654 | 3,604 | 3,506 | 3,446 | |||
| Sales of goods and services | P1O | 1,207 | 1,345 | 1,351 | 1,530 | 1,244 | 1,370 | 1,383 | 1,536 | 1,313 | 1,458 | 1,465 | 1,654 | 1,314 | 1,455 | 1,462 | |||
| Investment income | D4 | 109 | 1,339 | 118 | 260 | 329 | 1,092 | 115 | 247 | 111 | 846 | 88 | 272 | 68 | 1,244 | 125 | |||
| Current transfer revenue (excluding taxes) | D7 | 105 | 110 | 84 | 102 | 155 | 108 | 110 | 131 | 113 | 116 | 117 | 238 | 122 | 53 | 117 | |||
| Capital transfer revenue (excluding taxes) | D9N | 119 | 138 | 648 | 94 | 110 | 111 | 115 | 108 | 132 | 118 | 120 | 153 | 119 | 123 | 134 | |||
| Expenditure | TE | 18,179 | 18,147 | 18,740 | 20,295 | 18,718 | 18,907 | 19,482 | 20,374 | 19,573 | 20,448 | 20,235 | 21,912 | 20,461 | 20,006 | 20,950 | |||
| Expense | Expense | 17,966 | 17,680 | 18,398 | 19,763 | 18,226 | 18,590 | 19,040 | 20,323 | 19,019 | 19,824 | 19,841 | 21,235 | 19,718 | 19,402 | 20,412 | |||
| Compensation of employees | D1 | 5,055 | 4,949 | 4,752 | 4,687 | 5,369 | 5,257 | 5,048 | 5,006 | 5,679 | 5,620 | 5,422 | 5,507 | 5,953 | 5,816 | 5,684 | |||
| Use of goods and services plus taxes payable | P2 + D5 + D29 | 2,137 | 2,276 | 2,508 | 2,715 | 2,199 | 2,342 | 2,627 | 2,837 | 2,408 | 2,663 | 2,986 | 2,930 | 2,533 | 2,751 | 3,141 | |||
| Depreciation (Consumption of fixed capital) | P51c | 922 | 922 | 922 | 922 | 976 | 976 | 976 | 976 | 1,036 | 1,036 | 1,036 | 1,036 | 1,036 | 1,036 | 1,036 | |||
| Interest (excluding FISIM) | D41 | 1,641 | 1,561 | 1,523 | 1,441 | 1,525 | 1,437 | 1,516 | 1,360 | 1,367 | 1,307 | 1,322 | 1,239 | 1,116 | 1,156 | 1,050 | |||
| Subsidies | D3 | 377 | 393 | 413 | 570 | 391 | 408 | 429 | 594 | 400 | 417 | 438 | 610 | 402 | 418 | 439 | |||
| Social benefits | D62 + D632 | 6,664 | 6,770 | 7,389 | 7,700 | 6,773 | 6,923 | 7,546 | 7,932 | 6,875 | 7,175 | 7,672 | 8,349 | 7,082 | 7,260 | 7,957 | |||
| Other current transfers | D7 | 842 | 455 | 642 | 1,067 | 669 | 893 | 680 | 928 | 956 | 966 | 767 | 1,011 | 1,271 | 599 | 893 | |||
| Capital transfers | D9 | 329 | 354 | 249 | 662 | 323 | 353 | 218 | 690 | 297 | 640 | 198 | 554 | 325 | 366 | 212 | |||
| Net operating balance | NOB | -1,567 | 680 | -1,324 | 1,883 | -842 | 122 | -1,401 | 2,517 | -1,231 | 17 | -1,157 | 4,789 | -871 | 2,132 | -55 | |||
| Net acquisition of non-financial assets | P5 + NP - P51c | 213 | 467 | 342 | 532 | 492 | 317 | 442 | 52 | 554 | 624 | 394 | 676 | 743 | 604 | 539 | |||
| General Government Surplus/Deficit | B9 | -1,780 | 213 | -1,665 | 1,351 | -1,334 | -195 | -1,843 | 2,465 | -1,785 | -607 | -1,552 | 4,113 | -1,614 | 1,529 | -594 | |||
| equals | |||||||||||||||||||
| Net acquisition of financial assets | ΔFA | 3,773 | -7,893 | 1,308 | -2,091 | 6,050 | 2,585 | -883 | -9,821 | 7,146 | 8,295 | 10,597 | -8,524 | 7,710 | -376 | -379 | |||
| Debt instruments | F2 + F3 + F4 | 3,911 | -6,151 | 1,014 | -3,931 | 7,015 | 7,021 | -797 | -11,541 | 7,509 | 4,844 | 429 | -9,898 | 8,013 | 1,645 | -487 | |||
| Equity and Investment Fund Shares | F5 | 631 | -1,508 | 554 | -56 | 17 | -4,401 | -15 | -92 | 242 | -1,358 | 4 | -123 | -10 | -2,464 | -87 | |||
| Other financial assets | F6 + F7 + F8 | -769 | -234 | -260 | 1,896 | -982 | -35 | -71 | 1,812 | -605 | 4,809 | 10,164 | 1,497 | -293 | 443 | 195 | |||
| less | |||||||||||||||||||
| Net incurrence of liabilities | ΔL | 5,553 | -8,106 | 2,973 | -3,442 | 7,384 | 2,780 | 960 | -12,286 | 8,931 | 8,902 | 12,149 | -12,637 | 9,324 | -1,905 | 215 | |||
| Debt instruments | F2 + F3 + F4 | 5,503 | -8,101 | 3,260 | -3,391 | 7,347 | 2,644 | 894 | -12,433 | 8,868 | 4,070 | 2,391 | -13,023 | 9,453 | -1,827 | 217 | |||
| Other liabilities | F5 + F6 + F7 + F8 | 50 | -5 | -287 | -51 | 37 | 136 | 66 | 147 | 63 | 4,832 | 9,758 | 386 | -129 | -78 | -2 | |||
| Memo: Net derivative flows on debt interest swap contracts | -71 | -70 | -69 | -65 | -62 | -57 | -56 | -49 | -55 | -52 | -48 | -45 | -38 | -37 | -42 | ||||
| General Government Surplus/Deficit (% of quarterly GDP) | -2.7 | 0.3 | -2.4 | 1.8 | -1.9 | -0.3 | -2.4 | 3.1 | -2.3 | -0.8 | -1.8 | 4.9 | -1.9 | 1.9 | -0.7 | ||||
| Quarterly GDP at current market prices | 65,048 | 63,789 | 68,830 | 74,017 | 68,967 | 69,742 | 77,873 | 80,549 | 78,940 | 76,858 | 84,600 | 83,640 | 83,898 | 82,433 | 90,258 | ||||
| Table 2 General Government Net Worth, Gross and Net Debt | |||||||||||||||||||||
| €million | |||||||||||||||||||||
| Description | ESA2010 code | 2016 Q1 | 2016 Q2 | 2016 Q3 | 2016 Q4 | 2017 Q1 | 2017 Q2 | 2017 Q3 | 2017 Q4 | 2018 Q1 | 2018 Q2 | 2018 Q3 | 2018 Q4 | 2019 Q1 | 2019 Q2 | 2019 Q3 | |||||
| General Government net worth | |||||||||||||||||||||
| Net worth at market value, excluding pension liabilities | NW | -52,130 | -50,988 | -51,475 | -46,990 | -45,462 | -41,066 | -40,419 | -37,173 | -36,065 | -36,078 | -35,918 | -32,800 | -31,991 | -31,681 | -33,064 | |||||
| equals | |||||||||||||||||||||
| Non-financial assets at market value | NFA | 100,407 | 102,067 | 103,603 | 105,329 | 107,173 | 108,842 | 110,636 | 112,039 | 113,811 | 115,653 | 117,265 | 119,159 | 119,902 | 120,506 | 121,044 | |||||
| plus | |||||||||||||||||||||
| Financial net worth at market value, excluding pension liabilities | FNW | -152,537 | -153,055 | -155,078 | -152,319 | -152,635 | -149,908 | -151,055 | -149,212 | -149,876 | -151,731 | -153,183 | -151,959 | -151,893 | -152,187 | -154,108 | |||||
| equals | |||||||||||||||||||||
| Financial assets at market value | FA | 87,613 | 80,295 | 81,292 | 78,735 | 83,209 | 87,693 | 87,384 | 78,953 | 86,413 | 93,198 | 102,238 | 92,143 | 101,410 | 99,669 | 96,443 | |||||
| EDP debt instruments | F2 + F3 + F4 | 32,496 | 26,399 | 27,465 | 23,669 | 30,702 | 37,651 | 36,818 | 25,313 | 32,704 | 37,593 | 38,028 | 28,117 | 36,157 | 37,831 | 37,343 | |||||
| Equity and Investment Fund Shares | F5 | 47,115 | 46,091 | 46,226 | 45,557 | 43,914 | 41,098 | 41,468 | 42,606 | 43,305 | 40,317 | 38,735 | 37,011 | 39,203 | 35,218 | 32,654 | |||||
| Other financial assets | F6 + F7 + F8 | 8,002 | 7,805 | 7,601 | 9,509 | 8,593 | 8,944 | 9,098 | 11,034 | 10,404 | 15,288 | 25,475 | 27,015 | 26,050 | 26,620 | 26,446 | |||||
| less | |||||||||||||||||||||
| Liabilities at market value | L | 240,150 | 233,350 | 236,370 | 231,054 | 235,844 | 237,601 | 238,439 | 228,165 | 236,289 | 244,929 | 255,421 | 244,102 | 253,303 | 251,856 | 250,551 | |||||
| EDP debt instruments | F2 + F3 + F4 | 229,441 | 222,798 | 226,370 | 221,123 | 225,988 | 227,915 | 228,672 | 218,334 | 226,433 | 230,177 | 231,001 | 219,379 | 228,853 | 227,567 | 226,480 | |||||
| Other liabilities | F5 + F6 + F7 + F8 | 10,709 | 10,552 | 10,000 | 9,931 | 9,856 | 9,686 | 9,767 | 9,831 | 9,856 | 14,752 | 24,420 | 24,723 | 24,450 | 24,289 | 24,071 | |||||
| Memo: Estimated pension liabilities of government | 114,500 | 114,500 | 114,500 | 114,500 | 114,500 | 114,500 | 114,500 | 114,500 | 114,500 | 114,500 | 114,500 | 114,500 | 114,500 | 114,500 | 114,500 | ||||||
| Memo: Net worth, including pension liabilities | -166,630 | -165,488 | -165,975 | -161,490 | -159,962 | -155,566 | -154,919 | -151,673 | -150,565 | -150,578 | -150,418 | -147,300 | -146,491 | -146,181 | -147,564 | ||||||
| Contingent liabilities | 9,006 | 9,006 | 9,006 | 9,006 | 5,315 | 5,315 | 5,315 | 5,315 | 5,054 | 5,054 | 5,054 | 5,054 | 5,048 | 5,048 | 5,048 | ||||||
| Memo: Net worth, including pension liabilities and contingent liabilities | -175,636 | -174,493 | -174,981 | -170,496 | -165,277 | -160,881 | -160,234 | -156,988 | -155,619 | -155,632 | -155,473 | -152,355 | -151,539 | -151,229 | -152,612 | ||||||
| General Government: changes in net worth | |||||||||||||||||||||
| Opening net worth | -51,605 | -52,130 | -50,988 | -51,475 | -46,990 | -45,462 | -41,066 | -40,419 | -37,173 | -36,065 | -36,078 | -35,918 | -32,800 | -31,991 | -31,681 | ||||||
| Change in net worth due to transactions | -1,567 | 680 | -1,324 | 1,883 | -842 | 122 | -1,401 | 2,517 | -1,231 | 17 | -1,157 | 4,789 | -871 | 2,132 | -55 | ||||||
| Net acquisition of non-financial assets | P5 + NP - P51c | 213 | 467 | 342 | 532 | 492 | 317 | 442 | 52 | 554 | 624 | 394 | 676 | 743 | 604 | 539 | |||||
| Net lending/net borrowing | B9 | -1,780 | 213 | -1,665 | 1,351 | -1,334 | -195 | -1,843 | 2,465 | -1,785 | -607 | -1,552 | 4,113 | -1,614 | 1,529 | -594 | |||||
| Change in net worth due to other economic flows | Kx | 1,042 | 463 | 836 | 2,601 | 2,370 | 4,274 | 2,048 | 729 | 2,339 | -30 | 1,317 | -1,671 | 1,680 | -1,823 | -1,327 | |||||
| Other changes in non-financial assets | 1,194 | 1,194 | 1,194 | 1,194 | 1,352 | 1,352 | 1,352 | 1,352 | 1,218 | 1,218 | 1,218 | 1,218 | 0 | 0 | 0 | ||||||
| Other changes in financial assets | 914 | 575 | -311 | -466 | -1,576 | 1,899 | 574 | 1,390 | 314 | -1,510 | -1,557 | -1,571 | 1,557 | -1,365 | -2,847 | ||||||
| Other changes in liabilities | -1,066 | -1,306 | -47 | 1,874 | 2,594 | 1,023 | 122 | -2,012 | 807 | 262 | 1,657 | -1,318 | 123 | -458 | 1,520 | ||||||
| Closing net worth | -52,130 | -50,988 | -51,475 | -46,990 | -45,462 | -41,066 | -40,419 | -37,173 | -36,065 | -36,078 | -35,918 | -32,800 | -31,991 | -31,681 | -33,064 | ||||||
| General Government Debt (GGDebt) | |||||||||||||||||||||
| Debt instrument liabilities at market value | F2 + F3 + F4 | 229,441 | 222,798 | 226,370 | 221,123 | 225,988 | 227,915 | 228,672 | 218,334 | 226,433 | 230,177 | 231,001 | 219,379 | 228,853 | 227,567 | 226,480 | |||||
| + Difference between EDP face value and market value | -22,206 | -22,356 | -23,849 | -20,414 | -17,310 | -16,594 | -17,671 | -16,971 | -16,128 | -15,540 | -15,191 | -13,401 | -13,839 | -13,867 | -13,545 | ||||||
| Gross General Government Debt (EDP face value) | GGDebt | 207,235 | 200,442 | 202,521 | 200,709 | 208,678 | 211,321 | 211,001 | 201,363 | 210,305 | 214,637 | 215,810 | 205,978 | 215,014 | 213,700 | 212,935 | |||||
| less EDP debt instrument assets | F2 + F3 + F4 | -32,496 | -26,398 | -27,465 | -23,669 | -30,701 | -37,650 | -36,817 | -25,314 | -32,704 | -37,593 | -38,029 | -28,117 | -36,157 | -37,831 | -37,344 | |||||
| Net General Government Debt | GGNetDebt | 174,739 | 174,044 | 175,056 | 177,040 | 177,977 | 173,671 | 174,184 | 176,049 | 177,601 | 177,044 | 177,781 | 177,861 | 178,857 | 175,869 | 175,591 | |||||
| Closing Net Worth (% of annualised GDP) | -19.7 | -19.2 | -19.3 | -17.3 | -16.5 | -14.6 | -13.9 | -12.5 | -11.7 | -11.5 | -11.2 | -10.1 | -9.7 | -9.5 | -9.7 | ||||||
| Gross General Government Debt (% of annualised GDP) | 78.3 | 75.5 | 76.1 | 73.9 | 75.7 | 75.1 | 72.6 | 67.8 | 68.5 | 68.3 | 67.2 | 63.6 | 65.4 | 63.9 | 62.6 | ||||||
| Net General Government Debt (% of annualised GDP) | 66.1 | 65.6 | 65.7 | 65.2 | 64.6 | 61.7 | 59.9 | 59.2 | 57.8 | 56.3 | 55.4 | 54.9 | 54.4 | 52.6 | 51.6 | ||||||
| Annualised GDP | 264,519 | 265,353 | 266,251 | 271,684 | 275,602 | 281,555 | 290,599 | 297,131 | 307,104 | 314,220 | 320,947 | 324,038 | 328,996 | 334,571 | 340,230 | ||||||
| Table 3 General Government: detailed classification of revenue and output | ||||||||||||||||||||
| €million | ||||||||||||||||||||
| Description | ESA2010 code | 2016 Q1 | 2016 Q2 | 2016 Q3 | 2016 Q4 | 2017 Q1 | 2017 Q2 | 2017 Q3 | 2017 Q4 | 2018 Q1 | 2018 Q2 | 2018 Q3 | 2018 Q4 | 2019 Q1 | 2019 Q2 | 2019 Q3 | ||||
| Total Revenue | TR | 16,400 | 18,360 | 17,074 | 21,647 | 17,384 | 18,712 | 17,639 | 22,840 | 17,788 | 19,841 | 18,684 | 26,024 | 18,847 | 21,535 | 20,356 | ||||
| Taxes and social contributions | 14,860 | 15,428 | 14,874 | 19,661 | 15,547 | 16,031 | 15,916 | 20,818 | 16,120 | 17,303 | 16,894 | 23,707 | 17,224 | 18,660 | 18,519 | |||||
| Taxes | D2 + D5 + D91 | 11,846 | 12,546 | 12,005 | 16,372 | 12,365 | 12,980 | 12,891 | 17,424 | 12,757 | 14,062 | 13,689 | 20,053 | 13,620 | 15,153 | 15,072 | ||||
| Indirect taxes (taxes on production and imports) | D2 | 6,227 | 5,222 | 6,441 | 5,536 | 6,743 | 4,960 | 6,838 | 6,053 | 6,756 | 5,221 | 7,354 | 6,140 | 7,334 | 5,740 | 7,750 | ||||
| Taxes on products | D21 | 5,565 | 4,475 | 5,722 | 4,799 | 5,837 | 4,192 | 6,109 | 5,239 | 5,828 | 4,420 | 6,575 | 5,298 | 6,371 | 4,902 | 6,867 | ||||
| of which Value-Added Tax | D211 | 3,590 | 2,235 | 3,979 | 2,797 | 3,986 | 2,158 | 4,150 | 2,765 | 4,090 | 2,416 | 4,619 | 3,033 | 4,440 | 2,601 | 4,893 | ||||
| Other taxes on production | D29 | 662 | 747 | 719 | 738 | 906 | 769 | 729 | 814 | 928 | 801 | 780 | 841 | 963 | 839 | 882 | ||||
| Direct taxes | D5 | 5,584 | 7,262 | 5,501 | 10,585 | 5,586 | 7,973 | 5,977 | 11,080 | 5,967 | 8,789 | 6,248 | 13,567 | 6,238 | 9,361 | 7,241 | ||||
| Taxes on income, profits and capital gains | D51 | 5,293 | 6,997 | 5,248 | 10,355 | 5,294 | 7,717 | 5,734 | 10,856 | 5,689 | 8,539 | 6,009 | 13,339 | 5,961 | 9,114 | 7,001 | ||||
| Other current direct taxes | D59 | 291 | 264 | 253 | 231 | 292 | 256 | 244 | 224 | 278 | 250 | 240 | 228 | 277 | 247 | 240 | ||||
| Capital taxes | D91 | 35 | 62 | 63 | 251 | 37 | 46 | 75 | 290 | 34 | 52 | 86 | 346 | 47 | 52 | 81 | ||||
| Social contributions | D61 | 3,014 | 2,882 | 2,869 | 3,289 | 3,182 | 3,052 | 3,026 | 3,394 | 3,363 | 3,241 | 3,205 | 3,654 | 3,604 | 3,506 | 3,446 | ||||
| Actual social contributions | D611 + D613 | 2,680 | 2,548 | 2,535 | 2,954 | 2,878 | 2,748 | 2,722 | 3,091 | 3,081 | 2,959 | 2,923 | 3,372 | 3,323 | 3,225 | 3,165 | ||||
| PRSI receipts | D611 + D613(pt) | 2,310 | 2,178 | 2,165 | 2,585 | 2,477 | 2,347 | 2,321 | 2,690 | 2,658 | 2,536 | 2,499 | 2,949 | 2,899 | 2,801 | 2,741 | ||||
| Government employees' social contributions | D613(pt) | 370 | 370 | 370 | 370 | 401 | 401 | 401 | 401 | 423 | 423 | 423 | 423 | 424 | 424 | 424 | ||||
| Employers' imputed social contributions | D612 | 334 | 334 | 334 | 334 | 304 | 304 | 304 | 304 | 282 | 282 | 282 | 282 | 281 | 281 | 281 | ||||
| Sales of goods and services | P1O | 1,207 | 1,345 | 1,351 | 1,530 | 1,244 | 1,370 | 1,383 | 1,536 | 1,313 | 1,458 | 1,465 | 1,654 | 1,314 | 1,455 | 1,462 | ||||
| Sales of market establishments (= market output) | P11 | 305 | 305 | 305 | 305 | 331 | 331 | 331 | 331 | 362 | 362 | 362 | 362 | 391 | 391 | 391 | ||||
| Imputed sales related to production of own-use capital assets (= output for own final use) | P12 | 5 | 5 | 5 | 5 | 5 | 5 | 5 | 5 | 5 | 5 | 5 | 5 | 6 | 6 | 6 | ||||
| Incidental sales and fees of non-market establishments | P131 | 896 | 1,034 | 1,041 | 1,220 | 907 | 1,033 | 1,046 | 1,199 | 945 | 1,091 | 1,098 | 1,286 | 918 | 1,059 | 1,065 | ||||
| Investment income | D4 | 109 | 1,339 | 118 | 260 | 329 | 1,092 | 115 | 247 | 111 | 846 | 88 | 272 | 68 | 1,244 | 125 | ||||
| Interest (excluding FISIM) | D41 | 77 | 73 | 67 | 34 | 49 | 25 | 16 | 55 | 51 | 42 | 37 | 53 | 33 | 39 | 30 | ||||
| Dividends / Other investment income | D42 + D44 | 5 | 1,239 | 24 | 199 | 253 | 1,041 | 73 | 165 | 32 | 775 | 23 | 191 | 7 | 1,176 | 66 | ||||
| Rent of land and subsoil assets | D45 | 27 | 27 | 27 | 27 | 26 | 26 | 26 | 26 | 28 | 28 | 28 | 28 | 28 | 28 | 28 | ||||
| Current transfer revenue | D39 + D7 | 105 | 110 | 84 | 102 | 155 | 108 | 110 | 131 | 113 | 116 | 117 | 238 | 122 | 53 | 117 | ||||
| Subsidies | D39 | 0 | 0 | 0 | 0 | 0 | 0 | 0 | 0 | 0 | 0 | 0 | 0 | 0 | 0 | 0 | ||||
| Other current transfers | D7 | 105 | 110 | 84 | 102 | 155 | 108 | 110 | 131 | 113 | 116 | 117 | 238 | 122 | 53 | 117 | ||||
| Non-life insurance claims | D72 | 4 | 4 | 4 | 4 | 5 | 5 | 5 | 5 | 5 | 5 | 5 | 5 | 2 | 2 | 2 | ||||
| Other Domestic - Current | D7N_S1 | 49 | 47 | 47 | 50 | 49 | 48 | 48 | 51 | 49 | 48 | 48 | 51 | 49 | 48 | 48 | ||||
| From Rest of World - Current | D7N_S2 | 51 | 58 | 32 | 47 | 101 | 55 | 58 | 75 | 59 | 64 | 65 | 183 | 71 | 4 | 68 | ||||
| Capital transfer revenue | D9N | 119 | 138 | 648 | 94 | 110 | 111 | 115 | 108 | 132 | 118 | 120 | 153 | 119 | 123 | 134 | ||||
| Output | P1 | 8,248 | 8,282 | 8,317 | 8,459 | 8,700 | 8,730 | 8,806 | 8,974 | 9,308 | 9,504 | 9,629 | 9,658 | 9,736 | 9,817 | 10,075 | ||||
| Market output (sales of market establishments) | P11 | 305 | 305 | 305 | 305 | 331 | 331 | 331 | 331 | 362 | 362 | 362 | 362 | 391 | 391 | 391 | ||||
| Output for own final use | P12 | 5 | 5 | 5 | 5 | 5 | 5 | 5 | 5 | 5 | 5 | 5 | 5 | 6 | 6 | 6 | ||||
| Non-market output | P13 | 7,937 | 7,971 | 8,006 | 8,148 | 8,363 | 8,393 | 8,469 | 8,637 | 8,941 | 9,137 | 9,262 | 9,290 | 9,340 | 9,420 | 9,679 | ||||
| = Non-market compensation of employees | D1_nonmarket | 5,049 | 4,944 | 4,747 | 4,682 | 5,364 | 5,252 | 5,043 | 5,001 | 5,674 | 5,614 | 5,417 | 5,502 | 5,947 | 5,810 | 5,678 | ||||
| = Total compensation of employees | D1 | 5,055 | 4,949 | 4,752 | 4,687 | 5,369 | 5,257 | 5,048 | 5,006 | 5,679 | 5,620 | 5,422 | 5,507 | 5,953 | 5,816 | 5,684 | ||||
| - Compensation of employees of market establishments | D1_market | 0 | 0 | 0 | 0 | 0 | 0 | 0 | 0 | 0 | 0 | 0 | 0 | 0 | 0 | 0 | ||||
| - Compensation related to production of own-use capital assets | D1_own-use | -5 | -5 | -5 | -5 | -5 | -5 | -5 | -5 | -5 | -5 | -5 | -5 | -6 | -6 | -6 | ||||
| + Non-market intermediate consumption | P2_nonmarket | 2,075 | 2,215 | 2,447 | 2,653 | 2,136 | 2,279 | 2,564 | 2,774 | 2,345 | 2,600 | 2,923 | 2,867 | 2,470 | 2,688 | 3,078 | ||||
| = Total intermediate consumption | P2 | 2,137 | 2,276 | 2,508 | 2,715 | 2,199 | 2,342 | 2,627 | 2,837 | 2,408 | 2,663 | 2,986 | 2,930 | 2,533 | 2,751 | 3,141 | ||||
| - Intermediate consumption of market establishments | P2_market | -62 | -62 | -62 | -62 | -63 | -63 | -63 | -63 | -63 | -63 | -63 | -63 | -63 | -63 | -63 | ||||
| - Intermediate consumption related to production of own-use capital assets | P2_own-use | 0 | 0 | 0 | 0 | 0 | 0 | 0 | 0 | 0 | 0 | 0 | 0 | 0 | 0 | 0 | ||||
| + Non-market consumption of fixed capital | P51c_nonmarket | 813 | 813 | 813 | 813 | 862 | 862 | 862 | 862 | 922 | 922 | 922 | 922 | 922 | 922 | 922 | ||||
| = Total consumption of fixed capital | P51c | 922 | 922 | 922 | 922 | 976 | 976 | 976 | 976 | 1,036 | 1,036 | 1,036 | 1,036 | 1,036 | 1,036 | 1,036 | ||||
| - Consumption of fixed capital by market establishments | P51c_market | -109 | -109 | -109 | -109 | -114 | -114 | -114 | -114 | -114 | -114 | -114 | -114 | -114 | -114 | -114 | ||||
| - Consumption of fixed capital related to production of own-use capital assets | P51c_own-use | 0 | 0 | 0 | 0 | 0 | 0 | 0 | 0 | 0 | 0 | 0 | 0 | 0 | 0 | 0 | ||||
| + Other taxes on production, payable | D29_pay | 0 | 0 | 0 | 0 | 0 | 0 | 0 | 0 | 0 | 0 | 0 | 0 | 0 | 0 | 0 | ||||
| - Other subsidies on production, receivable | D39_rec | 0 | 0 | 0 | 0 | 0 | 0 | 0 | 0 | 0 | 0 | 0 | 0 | 0 | 0 | 0 | ||||
| Table 4 General Government: detailed classification of expenditure and consumption | ||||||||||||||||||||
| €million | ||||||||||||||||||||
| Description | ESA2010 code | 2016 Q1 | 2016 Q2 | 2016 Q3 | 2016 Q4 | 2017 Q1 | 2017 Q2 | 2017 Q3 | 2017 Q4 | 2018 Q1 | 2018 Q2 | 2018 Q3 | 2018 Q4 | 2019 Q1 | 2019 Q2 | 2019 Q3 | ||||
| Total Expenditure | TE | 18,179 | 18,147 | 18,740 | 20,295 | 18,718 | 18,907 | 19,482 | 20,374 | 19,573 | 20,448 | 20,235 | 21,912 | 20,461 | 20,006 | 20,950 | ||||
| Expense | 17,966 | 17,680 | 18,398 | 19,763 | 18,226 | 18,590 | 19,040 | 20,323 | 19,019 | 19,824 | 19,841 | 21,235 | 19,718 | 19,402 | 20,412 | |||||
| Compensation of employees | D1 | 5,055 | 4,949 | 4,752 | 4,687 | 5,369 | 5,257 | 5,048 | 5,006 | 5,679 | 5,620 | 5,422 | 5,507 | 5,953 | 5,816 | 5,684 | ||||
| Of which: Related to production of own-use capital assets | 5 | 5 | 5 | 5 | 5 | 5 | 5 | 5 | 5 | 5 | 5 | 5 | 6 | 6 | 6 | |||||
| Use of goods and services plus taxes payable | P2 + D5 + D29 | 2,137 | 2,276 | 2,508 | 2,715 | 2,199 | 2,342 | 2,627 | 2,837 | 2,408 | 2,663 | 2,986 | 2,930 | 2,533 | 2,751 | 3,141 | ||||
| Use of goods and services [Intermediate consumption] | P2 | 2,137 | 2,276 | 2,508 | 2,715 | 2,199 | 2,342 | 2,627 | 2,837 | 2,408 | 2,663 | 2,986 | 2,930 | 2,533 | 2,751 | 3,141 | ||||
| Of which: Intermediate consumption of market establishments | 62 | 62 | 62 | 62 | 63 | 63 | 63 | 63 | 63 | 63 | 63 | 63 | 63 | 63 | 63 | |||||
| Taxes, payable | D5 | 0 | 0 | 0 | 0 | 0 | 0 | 0 | 0 | 0 | 0 | 0 | 0 | 0 | 0 | 0 | ||||
| Depreciation (Consumption of fixed capital) | P51c | 922 | 922 | 922 | 922 | 976 | 976 | 976 | 976 | 1,036 | 1,036 | 1,036 | 1,036 | 1,036 | 1,036 | 1,036 | ||||
| Of which: Depreciation by market establishments | 109 | 109 | 109 | 109 | 114 | 114 | 114 | 114 | 114 | 114 | 114 | 114 | 114 | 114 | 114 | |||||
| Interest (excluding FISIM) | D41 | 1,641 | 1,561 | 1,523 | 1,441 | 1,525 | 1,437 | 1,516 | 1,360 | 1,367 | 1,307 | 1,322 | 1,239 | 1,116 | 1,156 | 1,050 | ||||
| Other domestic interest payable | D41_S1 | 576 | 564 | 563 | 556 | 566 | 499 | 584 | 492 | 503 | 432 | 457 | 448 | 313 | 363 | 292 | ||||
| Interest payable to rest of world | D41_S2 | 1,066 | 998 | 960 | 885 | 958 | 939 | 932 | 868 | 864 | 875 | 865 | 790 | 803 | 793 | 757 | ||||
| Subsidies | D3 | 377 | 393 | 413 | 570 | 391 | 408 | 429 | 594 | 400 | 417 | 438 | 610 | 402 | 418 | 439 | ||||
| Product subsidies | D31 | 202 | 220 | 239 | 248 | 207 | 225 | 244 | 254 | 207 | 225 | 244 | 254 | 206 | 223 | 243 | ||||
| Other subsidies on production | D39 | 174 | 173 | 174 | 321 | 184 | 183 | 184 | 340 | 193 | 192 | 194 | 357 | 196 | 195 | 196 | ||||
| Social benefits | D62 + D632 | 6,664 | 6,770 | 7,389 | 7,700 | 6,773 | 6,923 | 7,546 | 7,932 | 6,875 | 7,175 | 7,672 | 8,349 | 7,082 | 7,260 | 7,957 | ||||
| Social benefits in cash | D62 | 5,754 | 5,532 | 5,493 | 6,047 | 5,792 | 5,583 | 5,534 | 6,120 | 5,805 | 5,596 | 5,547 | 6,424 | 5,969 | 5,754 | 5,705 | ||||
| Social benefits in kind (via market producers) | D632 | 910 | 1,238 | 1,896 | 1,652 | 981 | 1,340 | 2,012 | 1,812 | 1,070 | 1,579 | 2,124 | 1,925 | 1,113 | 1,505 | 2,252 | ||||
| Other current transfers | D7 | 842 | 455 | 642 | 1,067 | 669 | 893 | 680 | 928 | 956 | 966 | 767 | 1,011 | 1,271 | 599 | 893 | ||||
| Net non-life insurance premiums | D71 | 26 | 26 | 26 | 26 | 27 | 27 | 27 | 27 | 27 | 27 | 27 | 27 | 13 | 14 | 13 | ||||
| Current international cooperation | D74 | 85 | 104 | 104 | 145 | 95 | 117 | 123 | 168 | 86 | 121 | 133 | 190 | 134 | 101 | 110 | ||||
| Miscellaneous current transfers | D75 | 184 | 87 | 155 | 186 | 139 | 149 | 186 | 355 | 183 | 211 | 131 | 165 | 164 | 159 | 157 | ||||
| VAT and GNI based EU budget contribution | D76 | 546 | 238 | 357 | 709 | 408 | 601 | 344 | 378 | 661 | 608 | 477 | 629 | 961 | 325 | 612 | ||||
| VAT-based EU own resources | D761 | 79 | 33 | 53 | 55 | 63 | 73 | 63 | 63 | 75 | 43 | 62 | 65 | 109 | 54 | 69 | ||||
| GNI-based EU own resources | D762 | 468 | 205 | 304 | 655 | 345 | 528 | 282 | 315 | 585 | 565 | 414 | 565 | 851 | 271 | 543 | ||||
| Capital transfers | D9 | 329 | 354 | 249 | 662 | 323 | 353 | 218 | 690 | 297 | 640 | 198 | 554 | 325 | 366 | 212 | ||||
| Investment grants | D92 | 329 | 354 | 249 | 662 | 323 | 353 | 218 | 660 | 297 | 427 | 198 | 554 | 325 | 366 | 212 | ||||
| Other capital transfers | D99 | 0 | 0 | 0 | 0 | 0 | 0 | 0 | 30 | 0 | 213 | 0 | 0 | 0 | 0 | 0 | ||||
| Net acquisition of non-financial assets | P5 + NP - P51c | 213 | 467 | 342 | 532 | 492 | 317 | 442 | 52 | 554 | 624 | 394 | 676 | 743 | 604 | 539 | ||||
| = Gross investment in non-financial assets | P5 + NP | 1,135 | 1,389 | 1,264 | 1,454 | 1,468 | 1,293 | 1,418 | 1,028 | 1,590 | 1,660 | 1,430 | 1,712 | 1,779 | 1,639 | 1,574 | ||||
| Gross fixed capital formation | P51 | 1,120 | 1,374 | 1,249 | 1,439 | 1,453 | 1,278 | 1,403 | 1,117 | 1,575 | 1,645 | 1,415 | 1,697 | 1,764 | 1,624 | 1,699 | ||||
| Net acquisition of stocks | P52 | 15 | 15 | 15 | 15 | 15 | 15 | 15 | 15 | 15 | 15 | 15 | 15 | 15 | 15 | 15 | ||||
| Net acquisition of unproduced assets | NP | 0 | 0 | 0 | 0 | 0 | 0 | 0 | -105 | 0 | 0 | 0 | 0 | 0 | 0 | -140 | ||||
| - Consumption of fixed capital | P51c | -922 | -922 | -922 | -922 | -976 | -976 | -976 | -976 | -1,036 | -1,036 | -1,036 | -1,036 | -1,036 | -1,036 | -1,036 | ||||
| Net expenditure on current goods and services | P3 excl. D632 | 7,041 | 6,937 | 6,965 | 6,929 | 7,456 | 7,360 | 7,422 | 7,439 | 7,995 | 8,046 | 8,164 | 8,004 | 8,422 | 8,361 | 8,613 | ||||
| = Output | P1 | 8,248 | 8,282 | 8,317 | 8,459 | 8,700 | 8,730 | 8,806 | 8,974 | 9,308 | 9,504 | 9,629 | 9,658 | 9,736 | 9,817 | 10,075 | ||||
| - Sales of goods and services | P11+P12+P131 | -1,207 | -1,345 | -1,351 | -1,530 | -1,244 | -1,370 | -1,383 | -1,536 | -1,313 | -1,458 | -1,465 | -1,654 | -1,314 | -1,455 | -1,462 | ||||
| Market output (sales of market establishments) | P11 | -305 | -305 | -305 | -305 | -331 | -331 | -331 | -331 | -362 | -362 | -362 | -362 | -391 | -391 | -391 | ||||
| Output for own final use | P12 | -5 | -5 | -5 | -5 | -5 | -5 | -5 | -5 | -5 | -5 | -5 | -5 | -6 | -6 | -6 | ||||
| Incidental sales and fees of non-market establishments | P131 | -896 | -1,034 | -1,041 | -1,220 | -907 | -1,033 | -1,046 | -1,199 | -945 | -1,091 | -1,098 | -1,286 | -918 | -1,059 | -1,065 | ||||
| Final consumption expenditure | P3 | 7,951 | 8,175 | 8,861 | 8,581 | 8,437 | 8,700 | 9,434 | 9,251 | 9,065 | 9,625 | 10,288 | 9,929 | 9,535 | 9,867 | 10,866 | ||||
| = Net expenditure on current goods and services | P3 excl. D632 | 7,041 | 6,937 | 6,965 | 6,929 | 7,456 | 7,360 | 7,422 | 7,439 | 7,995 | 8,046 | 8,164 | 8,004 | 8,422 | 8,361 | 8,613 | ||||
| + Social transfers in kind via market producers | D632 | 910 | 1,238 | 1,896 | 1,652 | 981 | 1,340 | 2,012 | 1,812 | 1,070 | 1,579 | 2,124 | 1,925 | 1,113 | 1,505 | 2,252 | ||||
| made up of | ||||||||||||||||||||
| Individual consumption (= social transfers in kind) | P31 (= D63) | 5,382 | 5,550 | 5,948 | 5,786 | 5,767 | 5,948 | 6,374 | 6,201 | 6,264 | 6,460 | 6,923 | 6,735 | 6,404 | 6,605 | 6,923 | ||||
| Social transfers in kind (via market producers) | D632 | 910 | 1,238 | 1,896 | 1,652 | 981 | 1,340 | 2,012 | 1,812 | 1,070 | 1,579 | 2,124 | 1,925 | 1,113 | 1,505 | 2,252 | ||||
| Social transfers in kind (provided directly by government) | D631 | 4,472 | 4,313 | 4,052 | 4,134 | 4,786 | 4,608 | 4,362 | 4,389 | 5,194 | 4,881 | 4,799 | 4,810 | 5,291 | 5,100 | 4,671 | ||||
| Collective consumption (= actual final consumption of government) | P32 | 2,569 | 2,624 | 2,913 | 2,795 | 2,670 | 2,752 | 3,060 | 3,050 | 2,801 | 3,164 | 3,365 | 3,195 | 3,131 | 3,262 | 3,942 | ||||
| Total social transfers | D62 + D63 | 11,136 | 11,082 | 11,441 | 11,834 | 11,559 | 11,531 | 11,909 | 12,321 | 12,069 | 12,056 | 12,471 | 13,158 | 12,373 | 12,360 | 12,628 | ||||
| Social benefits in cash | D62 | 5,754 | 5,532 | 5,493 | 6,047 | 5,792 | 5,583 | 5,534 | 6,120 | 5,805 | 5,596 | 5,547 | 6,424 | 5,969 | 5,754 | 5,705 | ||||
| Social transfers in kind (= individual consumption) | D63 | 5,382 | 5,550 | 5,948 | 5,786 | 5,767 | 5,948 | 6,374 | 6,201 | 6,264 | 6,460 | 6,923 | 6,735 | 6,404 | 6,605 | 6,923 | ||||
| Table 5 General Government financial transactions | ||||||||||||||||||||
| €million | ||||||||||||||||||||
| Description | 2016 Q1 | 2016 Q2 | 2016 Q3 | 2016 Q4 | 2017 Q1 | 2017 Q2 | 2017 Q3 | 2017 Q4 | 2018 Q1 | 2018 Q2 | 2018 Q3 | 2018 Q4 | 2019 Q1 | 2019 Q2 | 2019 Q3 | |||||
| Net lending (+) / net borrowing (-) | B.9 | -1,780 | 213 | -1,665 | 1,351 | -1,334 | -195 | -1,843 | 2,465 | -1,785 | -607 | -1,552 | 4,113 | -1,614 | 1,529 | -594 | ||||
| equals | ||||||||||||||||||||
| Net acquisition of financial assets | ΔA | 3,773 | -7,893 | 1,308 | -2,091 | 6,050 | 2,585 | -883 | -9,821 | 7,146 | 8,295 | 10,597 | -8,524 | 7,710 | -376 | -379 | ||||
| EDP debt instruments | F2 + F3 + F4 | 3,911 | -6,151 | 1,014 | -3,931 | 7,015 | 7,021 | -797 | -11,541 | 7,509 | 4,844 | 429 | -9,898 | 8,013 | 1,645 | -487 | ||||
| Currency and deposits | F2 | 4,321 | -6,662 | 2,255 | -3,289 | 7,117 | 6,871 | -941 | -10,515 | 7,612 | 5,048 | 144 | -8,622 | 8,125 | 1,799 | -155 | ||||
| Debt securities | F3 | -718 | 520 | -1,232 | 13 | 15 | 72 | 47 | -234 | -73 | 32 | 272 | -312 | 235 | -130 | -177 | ||||
| Short-term | F31 | -832 | -201 | -12 | 12 | -28 | 48 | 32 | 68 | -74 | -59 | 95 | -3 | 44 | -63 | 121 | ||||
| Long-term | F32 | 114 | 721 | -1,220 | 1 | 43 | 24 | 15 | -302 | 1 | 91 | 177 | -309 | 191 | -67 | -298 | ||||
| Loans | F4 | 308 | -9 | -9 | -655 | -117 | 78 | 97 | -792 | -30 | -236 | 13 | -964 | -347 | -24 | -155 | ||||
| Short-term loans | F41 | 194 | 29 | -29 | -240 | 10 | 34 | -18 | -58 | -108 | -117 | 1 | -4 | -215 | 56 | -196 | ||||
| Long-term loans | F42 | 114 | -38 | 20 | -415 | -127 | 44 | 115 | -734 | 78 | -119 | 12 | -960 | -132 | -80 | 41 | ||||
| Equity and Investment Fund Shares | F5 | 631 | -1,508 | 554 | -56 | 17 | -4,401 | -15 | -92 | 242 | -1,358 | 4 | -123 | -10 | -2,464 | -87 | ||||
| Other financial assets | F6 + F7 + F8 | -769 | -234 | -260 | 1,896 | -982 | -35 | -71 | 1,812 | -605 | 4,809 | 10,164 | 1,497 | -293 | 443 | 195 | ||||
| Insurance, Pensions and Standardised Guarantees | F6 | 0 | 0 | 0 | 0 | 0 | 0 | 0 | 0 | 0 | 0 | 0 | 0 | 0 | 0 | 0 | ||||
| Financial derivatives and Employee Stock Options | F7 | -72 | -69 | -66 | -71 | -25 | -254 | -91 | -56 | -67 | -34 | -28 | -36 | -29 | -37 | -39 | ||||
| Other accounts receivable/payable | F8 | -697 | -165 | -194 | 1,967 | -957 | 219 | 20 | 1,868 | -538 | 4,843 | 10,192 | 1,533 | -264 | 480 | 234 | ||||
| less | ||||||||||||||||||||
| Net incurrence of liabilities | ΔL | 5,553 | -8,106 | 2,973 | -3,442 | 7,384 | 2,780 | 960 | -12,286 | 8,931 | 8,902 | 12,149 | -12,637 | 9,324 | -1,905 | 215 | ||||
| EDP debt instruments | F2 + F3 + F4 | 5,503 | -8,101 | 3,260 | -3,391 | 7,347 | 2,644 | 894 | -12,433 | 8,868 | 4,070 | 2,391 | -13,023 | 9,453 | -1,827 | 217 | ||||
| Currency and deposits | F2 | 231 | 193 | 125 | 60 | 124 | 73 | 15 | 72 | 18 | -32 | 21 | 41 | 164 | 152 | 106 | ||||
| Debt securities | F3 | 5,948 | -8,446 | 2,937 | -3,968 | 7,450 | 2,937 | 687 | -6,764 | 8,240 | 3,997 | 2,334 | -12,850 | 8,845 | -1,794 | 1,351 | ||||
| Short-term | F31 | 3,389 | -970 | 1,670 | -3,041 | 2,360 | 1,002 | -1,025 | -1,701 | 3,191 | 474 | -490 | -3,093 | 3,758 | 1,231 | -785 | ||||
| Long-term | F32 | 2,559 | -7,476 | 1,267 | -927 | 5,090 | 1,935 | 1,712 | -5,063 | 5,049 | 3,523 | 2,824 | -9,757 | 5,087 | -3,025 | 2,136 | ||||
| Loans | F4 | -676 | 152 | 198 | 517 | -227 | -366 | 192 | -5,741 | 610 | 105 | 36 | -214 | 444 | -185 | -1,240 | ||||
| Short-term loans | F41 | -372 | -2 | -139 | 169 | 111 | -371 | 184 | -124 | 391 | 359 | -343 | -254 | 235 | 335 | -558 | ||||
| Long-term loans | F42 | -304 | 154 | 337 | 348 | -338 | 5 | 8 | -5,617 | 219 | -254 | 379 | 40 | 209 | -520 | -682 | ||||
| Other liabilities | F5 + F6 + F7 + F8 | 50 | -5 | -287 | -51 | 37 | 136 | 66 | 147 | 63 | 4,832 | 9,758 | 386 | -129 | -78 | -2 | ||||
| Equity and Investment Fund Shares | F5 | 0 | 0 | 0 | 0 | 0 | 0 | 0 | 0 | 0 | 0 | 0 | 0 | 0 | 0 | 0 | ||||
| Insurance, Pensions and Standardised Guarantees | F6 | 0 | 0 | 0 | 0 | 0 | 0 | 0 | 0 | 0 | 0 | 0 | 0 | 0 | 0 | 0 | ||||
| Financial derivatives and Employee Stock Options | F7 | 0 | 0 | 0 | 0 | 0 | 0 | 0 | 5 | -5 | 0 | 0 | -1 | 0 | 0 | 0 | ||||
| Other accounts receivable/payable | F8 | 50 | -5 | -287 | -51 | 37 | 136 | 66 | 142 | 68 | 4,832 | 9,758 | 387 | -129 | -78 | -2 | ||||
| Table 6 General Government: detailed breakdown of net worth | ||||||||||||||||||||||
| €million | ||||||||||||||||||||||
| Description | ESA2010 code | 2016 Q1 | 2016 Q2 | 2016 Q3 | 2016 Q4 | 2017 Q1 | 2017 Q2 | 2017 Q3 | 2017 Q4 | 2018 Q1 | 2018 Q2 | 2018 Q3 | 2018 Q4 | 2019 Q1 | 2019 Q2 | 2019 Q3 | ||||||
| General Government balance sheet | ||||||||||||||||||||||
| Net worth at market value, excluding pension liabilities | NW | -52,130 | -50,988 | -51,475 | -46,990 | -45,462 | -41,066 | -40,419 | -37,173 | -36,065 | -36,078 | -35,918 | -32,800 | -31,991 | -31,681 | -33,064 | ||||||
| equals | ||||||||||||||||||||||
| Non-financial assets at market value | NFA | 100,407 | 102,067 | 103,603 | 105,329 | 107,173 | 108,842 | 110,636 | 112,039 | 113,811 | 115,653 | 117,265 | 119,159 | 119,902 | 120,506 | 121,044 | ||||||
| plus | ||||||||||||||||||||||
| Financial net worth at market value, excluding pension liabilities | FNW | -152,537 | -153,055 | -155,078 | -152,319 | -152,635 | -149,908 | -151,055 | -149,212 | -149,876 | -151,731 | -153,183 | -151,959 | -151,893 | -152,187 | -154,108 | ||||||
| equals | ||||||||||||||||||||||
| Financial assets at market value | FA | 87,613 | 80,295 | 81,292 | 78,735 | 83,209 | 87,693 | 87,384 | 78,953 | 86,413 | 93,198 | 102,238 | 92,143 | 101,410 | 99,669 | 96,443 | ||||||
| EDP debt instruments | F2 + F3 + F4 | 32,496 | 26,399 | 27,465 | 23,669 | 30,702 | 37,651 | 36,818 | 25,313 | 32,704 | 37,593 | 38,028 | 28,117 | 36,157 | 37,831 | 37,343 | ||||||
| Currency and deposits | F2 | 22,331 | 15,678 | 17,939 | 14,670 | 21,787 | 28,652 | 27,709 | 17,198 | 24,815 | 29,882 | 30,029 | 21,410 | 29,540 | 31,338 | 31,192 | ||||||
| Debt securities | F3 | 2,552 | 3,082 | 1,854 | 1,891 | 1,887 | 1,898 | 1,914 | 1,718 | 1,531 | 1,587 | 1,853 | 1,529 | 1,813 | 1,691 | 1,543 | ||||||
| Short-term | F31 | 352 | 149 | 136 | 143 | 178 | 221 | 249 | 378 | 303 | 237 | 330 | 322 | 363 | 296 | 419 | ||||||
| Long-term | F32 | 2,199 | 2,932 | 1,718 | 1,748 | 1,708 | 1,677 | 1,664 | 1,341 | 1,229 | 1,350 | 1,524 | 1,207 | 1,450 | 1,395 | 1,125 | ||||||
| Loans | F4 | 7,613 | 7,639 | 7,672 | 7,108 | 7,028 | 7,101 | 7,195 | 6,397 | 6,358 | 6,124 | 6,146 | 5,178 | 4,804 | 4,802 | 4,608 | ||||||
| Short-term loans | F41 | 1,180 | 1,208 | 1,179 | 939 | 949 | 983 | 966 | 907 | 799 | 683 | 684 | 680 | 465 | 522 | 326 | ||||||
| Long-term loans | F42 | 6,434 | 6,431 | 6,493 | 6,169 | 6,079 | 6,117 | 6,229 | 5,490 | 5,558 | 5,441 | 5,462 | 4,498 | 4,339 | 4,280 | 4,282 | ||||||
| Equity and Investment Fund Shares | F5 | 47,115 | 46,091 | 46,226 | 45,557 | 43,914 | 41,098 | 41,468 | 42,606 | 43,305 | 40,317 | 38,735 | 37,011 | 39,203 | 35,218 | 32,654 | ||||||
| Other financial assets | F6 + F7 + F8 | 8,002 | 7,805 | 7,601 | 9,509 | 8,593 | 8,944 | 9,098 | 11,034 | 10,404 | 15,288 | 25,475 | 27,015 | 26,050 | 26,620 | 26,446 | ||||||
| Insurance, Pensions and Standardised Guarantees | F6 | 0 | 0 | 0 | 0 | 0 | 0 | 0 | 0 | 0 | 0 | 0 | 0 | 0 | 0 | 0 | ||||||
| Financial derivatives and Employee Stock Options | F7 | 71 | 40 | 30 | 0 | 6 | 136 | 231 | 409 | 317 | 358 | 353 | 387 | 213 | 277 | 90 | ||||||
| Other accounts receivable/payable | F8 | 7,931 | 7,765 | 7,571 | 9,509 | 8,587 | 8,808 | 8,867 | 10,625 | 10,087 | 14,930 | 25,122 | 26,628 | 25,837 | 26,343 | 26,356 | ||||||
| less | ||||||||||||||||||||||
| Liabilities at market value | L | 240,150 | 233,350 | 236,370 | 231,054 | 235,844 | 237,601 | 238,439 | 228,165 | 236,289 | 244,929 | 255,421 | 244,102 | 253,303 | 251,856 | 250,551 | ||||||
| EDP debt instruments | F2 + F3 + F4 | 229,441 | 222,798 | 226,370 | 221,123 | 225,988 | 227,915 | 228,672 | 218,334 | 226,433 | 230,177 | 231,001 | 219,379 | 228,853 | 227,567 | 226,480 | ||||||
| Currency and deposits | F2 | 20,942 | 21,132 | 21,255 | 21,315 | 21,439 | 21,512 | 21,528 | 21,600 | 21,618 | 21,586 | 21,607 | 21,648 | 21,812 | 21,965 | 22,070 | ||||||
| Debt securities | F3 | 152,465 | 145,538 | 148,944 | 143,057 | 148,028 | 150,630 | 151,267 | 146,554 | 153,961 | 157,633 | 158,480 | 147,085 | 155,761 | 154,558 | 154,554 | ||||||
| Short-term | F31 | 4,688 | 3,741 | 5,413 | 2,401 | 4,739 | 5,604 | 4,613 | 2,932 | 6,146 | 6,748 | 6,245 | 3,083 | 6,841 | 7,955 | 7,173 | ||||||
| Long-term | F32 | 147,777 | 141,797 | 143,531 | 140,656 | 143,289 | 145,026 | 146,654 | 143,622 | 147,815 | 150,886 | 152,235 | 144,003 | 148,920 | 146,603 | 147,381 | ||||||
| Loans | F4 | 56,034 | 56,128 | 56,171 | 56,751 | 56,521 | 55,773 | 55,877 | 50,180 | 50,854 | 50,958 | 50,914 | 50,646 | 51,280 | 51,044 | 49,856 | ||||||
| Short-term loans | F41 | 653 | 651 | 517 | 691 | 846 | 423 | 627 | 514 | 927 | 1,326 | 947 | 651 | 948 | 1,341 | 758 | ||||||
| Long-term loans | F42 | 55,382 | 55,478 | 55,654 | 56,060 | 55,675 | 55,350 | 55,250 | 49,666 | 49,927 | 49,632 | 49,966 | 49,995 | 50,332 | 49,703 | 49,099 | ||||||
| Other liabilities | F5 + F6 + F7 + F8 | 10,709 | 10,552 | 10,000 | 9,931 | 9,856 | 9,686 | 9,767 | 9,831 | 9,856 | 14,752 | 24,420 | 24,723 | 24,450 | 24,289 | 24,071 | ||||||
| Equity and Investment Fund Shares | F5 | 0 | 0 | 0 | 0 | 0 | 0 | 0 | 0 | 0 | 0 | 0 | 0 | 0 | 0 | 0 | ||||||
| Insurance, Pensions and Standardised Guarantees | F6 | 0 | 0 | 0 | 0 | 0 | 0 | 0 | 0 | 0 | 0 | 0 | 0 | 0 | 0 | 0 | ||||||
| Financial derivatives and Employee Stock Options | F7 | 1,474 | 1,322 | 1,057 | 1,039 | 927 | 621 | 637 | 558 | 515 | 579 | 489 | 405 | 359 | 250 | 255 | ||||||
| Other accounts receivable/payable | F8 | 9,235 | 9,230 | 8,943 | 8,892 | 8,929 | 9,065 | 9,130 | 9,273 | 9,341 | 14,173 | 23,931 | 24,318 | 24,091 | 24,039 | 23,816 | ||||||
| Memo: Estimated pension liabilities of government | 114,500 | 114,500 | 114,500 | 114,500 | 114,500 | 114,500 | 114,500 | 114,500 | 114,500 | 114,500 | 114,500 | 114,500 | 114,500 | 114,500 | 114,500 | |||||||
| Memo: Net worth, including pension liabilities | -166,630 | -165,488 | -165,975 | -161,490 | -159,962 | -155,566 | -154,919 | -151,673 | -150,565 | -150,578 | -150,418 | -147,300 | -146,491 | -146,181 | -147,564 | |||||||
| Contingent liabilities | 9,006 | 9,006 | 9,006 | 9,006 | 5,315 | 5,315 | 5,315 | 5,315 | 5,054 | 5,054 | 5,054 | 5,054 | 5,048 | 5,048 | 5,048 | |||||||
| Guarantees | 3,973 | 3,973 | 3,973 | 3,973 | 282 | 282 | 282 | 282 | 7 | 7 | 7 | 7 | 0 | 0 | 0 | |||||||
| Off-balance sheet PPPs and concessions | 5,032 | 5,032 | 5,032 | 5,032 | 5,032 | 5,032 | 5,032 | 5,032 | 5,048 | 5,048 | 5,048 | 5,048 | 5,048 | 5,048 | 5,048 | |||||||
| Memo: Net worth, including pension liabilities and contingent liabilities | -175,636 | -174,493 | -174,981 | -170,496 | -165,277 | -160,881 | -160,234 | -156,988 | -155,619 | -155,632 | -155,473 | -152,355 | -151,539 | -151,229 | -152,612 | |||||||
| Change in net worth of government | ||||||||||||||||||||||
| Opening net worth | -51,605 | -52,130 | -50,988 | -51,475 | -46,990 | -45,462 | -41,066 | -40,419 | -37,173 | -36,065 | -36,078 | -35,918 | -32,800 | -31,991 | -31,681 | |||||||
| Change in net worth due to transactions | -1,567 | 680 | -1,324 | 1,883 | -842 | 122 | -1,401 | 2,517 | -1,231 | 17 | -1,157 | 4,789 | -871 | 2,132 | -55 | |||||||
| Net acquisition of non-financial assets | P5 + NP - P51c | 213 | 467 | 342 | 532 | 492 | 317 | 442 | 52 | 554 | 624 | 394 | 676 | 743 | 604 | 539 | ||||||
| Net lending/net borrowing | B9 | -1,780 | 213 | -1,665 | 1,351 | -1,334 | -195 | -1,843 | 2,465 | -1,785 | -607 | -1,552 | 4,113 | -1,614 | 1,529 | -594 | ||||||
| = Net acquisition of financial assets | 3,773 | -7,893 | 1,308 | -2,091 | 6,050 | 2,585 | -883 | -9,821 | 7,146 | 8,295 | 10,597 | -8,524 | 7,710 | -376 | -379 | |||||||
| - Net incurrence of liabilities | -5,553 | 8,106 | -2,973 | 3,442 | -7,384 | -2,780 | -960 | 12,286 | -8,931 | -8,902 | -12,149 | 12,637 | -9,324 | 1,905 | -215 | |||||||
| Change in net worth due to other economic flows | Kx | 1,042 | 463 | 836 | 2,601 | 2,370 | 4,274 | 2,048 | 729 | 2,339 | -30 | 1,317 | -1,671 | 1,680 | -1,823 | -1,327 | ||||||
| Other changes in non-financial assets | 1,194 | 1,194 | 1,194 | 1,194 | 1,352 | 1,352 | 1,352 | 1,352 | 1,218 | 1,218 | 1,218 | 1,218 | 0 | 0 | 0 | |||||||
| Other changes in financial net worth | -152 | -731 | -358 | 1,408 | 1,018 | 2,922 | 696 | -622 | 1,121 | -1,248 | 100 | -2,889 | 1,680 | -1,823 | -1,327 | |||||||
| = Other changes in financial assets | 914 | 575 | -311 | -466 | -1,576 | 1,899 | 574 | 1,390 | 314 | -1,510 | -1,557 | -1,571 | 1,557 | -1,365 | -2,847 | |||||||
| EDP debt instruments | -3 | 54 | 52 | 135 | 18 | -72 | -36 | 36 | -118 | 45 | 6 | -13 | 27 | 29 | -1 | |||||||
| Equity and Investment Fund Shares | 1,585 | 484 | -419 | -613 | -1,660 | 1,585 | 385 | 1,230 | 457 | -1,630 | -1,586 | -1,601 | 2,202 | -1,521 | -2,477 | |||||||
| Other financial assets | -668 | 37 | 56 | 12 | 66 | 386 | 225 | 124 | -25 | 75 | 23 | 43 | -672 | 127 | -369 | |||||||
| - Other changes in liabilities | -1,066 | -1,306 | -47 | 1,874 | 2,594 | 1,023 | 122 | -2,012 | 807 | 262 | 1,657 | -1,318 | 123 | -458 | 1,520 | |||||||
| EDP debt instruments | -729 | -1,458 | -312 | 1,856 | 2,482 | 717 | 137 | -2,095 | 769 | 326 | 1,567 | -1,401 | -21 | -541 | 1,304 | |||||||
| Other liabilities | -337 | 152 | 265 | 18 | 112 | 306 | -15 | 83 | 38 | -64 | 90 | 83 | 144 | 83 | 216 | |||||||
| Closing net worth | -52,130 | -50,988 | -51,475 | -46,990 | -45,462 | -41,066 | -40,419 | -37,173 | -36,065 | -36,078 | -35,918 | -32,800 | -31,991 | -31,681 | -33,064 | |||||||
| Table 7 General Government Gross and Net Debt | |||||||||||||||||||
| €million | |||||||||||||||||||
| Description | ESA2010 code | 2016 Q1 | 2016 Q2 | 2016 Q3 | 2016 Q4 | 2017 Q1 | 2017 Q2 | 2017 Q3 | 2017 Q4 | 2018 Q1 | 2018 Q2 | 2018 Q3 | 2018 Q4 | 2019 Q1 | 2019 Q2 | 2019 Q3 | |||
| General Government Debt | |||||||||||||||||||
| Debt instrument liabilities at market value | 229,441 | 222,798 | 226,370 | 221,123 | 225,988 | 227,915 | 228,672 | 218,334 | 226,433 | 230,177 | 231,001 | 219,379 | 228,853 | 227,567 | 226,480 | ||||
| + Difference between face value and market value | -22,206 | -22,356 | -23,849 | -20,414 | -17,310 | -16,594 | -17,671 | -16,971 | -16,128 | -15,540 | -15,191 | -13,401 | -13,839 | -13,867 | -13,545 | ||||
| Gross General Government Debt (face value) | GGDebt | 207,235 | 200,442 | 202,521 | 200,709 | 208,678 | 211,321 | 211,001 | 201,363 | 210,305 | 214,637 | 215,810 | 205,978 | 215,014 | 213,700 | 212,935 | |||
| By category: | |||||||||||||||||||
| Currency and deposits | F2 | 20,942 | 21,132 | 21,255 | 21,315 | 21,439 | 21,512 | 21,528 | 21,600 | 21,618 | 21,586 | 21,607 | 21,648 | 21,812 | 21,965 | 22,070 | |||
| Debt securities | F3 | 131,436 | 124,326 | 126,161 | 123,881 | 131,665 | 134,630 | 134,242 | 130,121 | 138,281 | 142,638 | 143,815 | 134,233 | 142,572 | 141,264 | 141,867 | |||
| Short-term | F31 | 4,680 | 3,734 | 5,406 | 2,395 | 4,736 | 5,598 | 4,608 | 2,929 | 6,142 | 6,742 | 6,230 | 3,075 | 6,832 | 8,032 | 7,300 | |||
| Long-term | F32 | 126,756 | 120,592 | 120,755 | 121,485 | 126,929 | 129,032 | 129,634 | 127,191 | 132,138 | 135,896 | 137,585 | 131,158 | 135,740 | 133,232 | 134,568 | |||
| Loans | F4 | 54,857 | 54,984 | 55,105 | 55,513 | 55,574 | 55,179 | 55,231 | 49,642 | 50,407 | 50,413 | 50,388 | 50,097 | 50,631 | 50,471 | 48,997 | |||
| Short-term | F41 | 653 | 651 | 517 | 691 | 846 | 423 | 627 | 514 | 927 | 1,326 | 947 | 651 | 948 | 1,341 | 757 | |||
| Long-term | F42 | 54,205 | 54,333 | 54,588 | 54,822 | 54,728 | 54,756 | 54,604 | 49,128 | 49,480 | 49,087 | 49,441 | 49,446 | 49,683 | 49,130 | 48,240 | |||
| less EDP debt instrument assets | F2 + F3 + F4 | 32,496 | 26,398 | 27,465 | 23,669 | 30,701 | 37,650 | 36,817 | 25,314 | 32,704 | 37,593 | 38,029 | 28,117 | 36,157 | 37,831 | 37,344 | |||
| By category: | |||||||||||||||||||
| Currency and deposits | F2 | 22,331 | 15,678 | 17,939 | 14,670 | 21,787 | 28,652 | 27,709 | 17,198 | 24,815 | 29,882 | 30,029 | 21,410 | 29,540 | 31,338 | 31,192 | |||
| Debt securities | F3 | 2,551 | 3,081 | 1,854 | 1,891 | 1,886 | 1,898 | 1,913 | 1,719 | 1,532 | 1,587 | 1,854 | 1,529 | 1,813 | 1,691 | 1,544 | |||
| Short-term | F31 | 352 | 149 | 136 | 143 | 178 | 221 | 249 | 378 | 303 | 237 | 330 | 322 | 363 | 296 | 419 | |||
| Long-term | F32 | 2,199 | 2,932 | 1,718 | 1,748 | 1,708 | 1,677 | 1,664 | 1,341 | 1,229 | 1,350 | 1,524 | 1,207 | 1,450 | 1,395 | 1,125 | |||
| Loans | F4 | 7,614 | 7,639 | 7,672 | 7,108 | 7,028 | 7,100 | 7,195 | 6,397 | 6,357 | 6,124 | 6,146 | 5,178 | 4,804 | 4,802 | 4,608 | |||
| Short-term | F41 | 1,180 | 1,208 | 1,179 | 939 | 949 | 983 | 966 | 907 | 799 | 683 | 684 | 680 | 465 | 522 | 326 | |||
| Long-term | F42 | 6,434 | 6,431 | 6,493 | 6,169 | 6,079 | 6,117 | 6,229 | 5,490 | 5,558 | 5,441 | 5,462 | 4,498 | 4,339 | 4,280 | 4,282 | |||
| Net General Government Debt (face value) | GGNetDebt | 174,739 | 174,044 | 175,056 | 177,040 | 177,977 | 173,671 | 174,184 | 176,049 | 177,601 | 177,044 | 177,781 | 177,861 | 178,857 | 175,869 | 175,591 | |||
| By category: | |||||||||||||||||||
| Currency and deposits | F2 | -1,389 | 5,454 | 3,316 | 6,645 | -348 | -7,140 | -6,181 | 4,402 | -3,197 | -8,296 | -8,422 | 238 | -7,728 | -9,373 | -9,122 | |||
| Debt securities | F3 | 128,885 | 121,245 | 124,307 | 121,990 | 129,779 | 132,732 | 132,329 | 128,402 | 136,749 | 141,051 | 141,961 | 132,704 | 140,759 | 139,573 | 140,323 | |||
| Short-term | F31 | 4,328 | 3,585 | 5,270 | 2,252 | 4,558 | 5,377 | 4,359 | 2,551 | 5,839 | 6,505 | 5,900 | 2,753 | 6,469 | 7,736 | 6,881 | |||
| Long-term | F32 | 124,557 | 117,660 | 119,037 | 119,737 | 125,221 | 127,355 | 127,970 | 125,850 | 130,909 | 134,546 | 136,061 | 129,951 | 134,290 | 131,837 | 133,443 | |||
| Loans | F4 | 47,243 | 47,345 | 47,433 | 48,405 | 48,546 | 48,079 | 48,036 | 43,245 | 44,050 | 44,289 | 44,242 | 44,919 | 45,827 | 45,669 | 44,389 | |||
| Short-term | F41 | -527 | -557 | -662 | -248 | -103 | -560 | -339 | -393 | 128 | 643 | 263 | -29 | 483 | 819 | 431 | |||
| Long-term | F42 | 47,771 | 47,902 | 48,095 | 48,653 | 48,649 | 48,639 | 48,375 | 43,638 | 43,922 | 43,646 | 43,979 | 44,948 | 45,344 | 44,850 | 43,958 | |||
This release comprises the latest official publication by CSO of quarterly Government Finance Statistics (GFS) for the period Q1 2016 to Q3 2019.
Data for Q1 and Q2 2019 have been revised due to increased data availability. Pre-2019 data remains unchanged to that published in the 2019 Q2 publication on 18 October 2019.
Pre-2019 data in this series are consistent with General Government Deficit and Debt levels reported at end-September 2019 under the EU regulation governing the Excessive Deficit Procedure (EDP). Consequently, they may not always be fully aligned with the National Income and Expenditure and related publications such as the Institutional Sector Accounts. Government accounts are compiled in the EU according to the European System of National Accounts framework - ESA2010.
The calculation methods for quarterly GFS are similar to those used in deriving the annual GFS. As some of the available sources are of lesser reliability than those used for annual GFS, the quarterly estimates are subject to a greater margin of error than the annual figures.
The tables provide detailed revenue, expenditure and balance sheet data for general government. These data are also available on CSO Statbank here.
The full suite of GFS tables are available on the CSO website here.
Data for all EU Member States are available on Eurostat’s data base here.
VAT MOSS (VAT Mini One Stop Shop): VAT MOSS is a way of paying VAT on supplies of certain digital services. The VAT MOSS retention fee payable to other countries is now included as a D.74 payable.
Net acquisition of unproduced assets (NP): The sale of the former DIT Kevin Street Campus for €140 million in Q3 2019 is included under the NP figure for the quarter (Table 4).
Quarterly General Government Consolidated Gross Debt fell by approximately €765 million in Q3 2019, with the decrease driven primarily by the net repayment of loan liabilities.
Loan liabilities (F.4) fell by €1.5 billion in Q3 2019. This decrease in indebtedness was mainly as a result of the repayment of part of the bilateral loan that the State has from the UK, although this was offset to a lesser extent by a net increase in borrowing from the European Investment Bank (EIB). See Tables 5 and 6.
The GDP figures used in the current publication are consistent with those in the latest National Income and Expenditure Accounts and the Quarterly National Accounts published on 13 December 2019.
The population estimates used in calculating the debt per capita data in Figure 3 are the previous years' mid-April estimates of population except for the year 2017 where the 2016 census of population figure is used (see Statbank table PEA15: Annual Population Change by Component and Year).
GFS form the basis for fiscal monitoring in Europe, in particular in relation to the Excessive Deficit Procedure (EDP).
European GFS, including EDP statistics, are produced according to the legally binding accounting rules of the European System of Accounts (ESA2010). The Manual on Government Debt and Deficit (MGDD) provides further guidance on the implementation of ESA 2010 in the context of GFS.
EU Member States are required to report government deficit/surplus and debt data biannually under the EDP - before 1 April and 1 October in year N, for years N-4 to N-1 calendar years, as well as a forecast for the current year. The data are reported in harmonised tables, which provide a consistent framework for the presentation of this data by Member States. The tables provide a structure for linking national budgetary aggregates with government deficit and debt.
In addition to the EDP transmission programme, detailed statistics on government revenue and expenditure are also provided to Eurostat under the ESA transmission programme. For quarterly data the main tables reported are:
Table 0801 Quarterly non-financial accounts by sector
Table 2500 Quarterly short term statistics (revenue and expenditure) for general government
Table 2700 Quarterly financial accounts for general government
Table 2800 Quarterly government debt
These data are available on the Eurostat website here.
The general government sector of the economy, is defined in ESA2010 paragraph 2.111: as “institutional units which are non-market producers whose output is intended for individual and collective consumption, and are financed by compulsory payments made by units belonging to other sectors, and institutional units principally engaged in the redistribution of national income and wealth”. General government comprises the sub-sectors central government (S.1311), state government (S.1312 – which does not apply in Ireland), local government (S.1313), and social security funds (S.1314 – which does not apply in Ireland).
General government deficit/surplus (GG deficit/surplus) is the standard European measure of the fiscal balance, which is used to monitor compliance with the Stability and Growth Pact.
This measure is by definition equal to both Total revenue (TR) less Total expenditure (TE), and Net acquisition of financial assets less Net incurrence of liabilities (Tables 1 and 5). In order to respect this accounting identity, a technical adjustment is made to the level of transactions recorded in liability category F32 (long-term debt securities) to eliminate any statistical discrepancy between the two approaches to the calculation of GG deficit/surplus. This adjustment has no impact on Gross debt, Net debt or Net worth.
General government gross debt (GG debt) is defined in the EU regulations implementing the Maastricht Treaty as the gross debt liabilities of the consolidated general government sector, at nominal value.
‘Gross’ means that the value of any financial assets held by general government cannot be deducted from the GG debt. In Ireland’s case, this means that the liquid assets which are deducted from the ‘Gross’ national debt in arriving at the audited national debt cannot be deducted from the GG debt.
‘Debt liabilities’ are defined as the ESA 2010 categories AF.2 (Currency and deposits), AF.3 (Debt securities), and AF.4 (Loans).
This definition excludes liabilities in derivatives, equity liabilities, pension and insurance liabilities and accounts payable.
‘Consolidated’ means that any money owed by one entity within general government to another is excluded from the total GG Debt.
‘Nominal value’ is defined in the governing regulation as face value. If debt is sold at a discount, it is the undiscounted value of the instrument, rather than the amount actually received, that is shown in the GG debt. In other statistical contexts, ‘nominal value’ means face value plus any interest accrued but not paid; however, such interest is excluded from GG Debt by definition.
General government net debt is a measure produced in accordance with the methodology of the IMF/World Bank Public Sector Debt Statistics Guide, by subtracting from the GG gross debt figure the value of the financial assets corresponding to the categories of financial liabilities which comprise GG gross debt.
General government net worth is calculated as the sum of financial and non-financial assets of general government less financial liabilities.
Detailed codes and technical definitions can be seen in the ESA 2010 manual here.
A listing of some of the main items included in this release is shown below.
P.2 Intermediate consumption – value of goods and services used in the process of production, excluding fixed assets.
P.5 Gross fixed capital formation.
P.51g Gross fixed capital formation - acquisitions, less disposals, of fixed assets during a given period plus certain additions to the value of non-produced assets realised by productive activity. Fixed assets are tangible or intangible assets produced as outputs from processes of production that are themselves used repeatedly, or continuously, in processes of production for more than one year.
P.51c Consumption of fixed capital - the amount of fixed assets used up, during the period under consideration, as a result of normal wear and tear and foreseeable obsolescence, including a provision for losses of fixed assets as a result of accidental damage which can be insured against.
P.52 Changes in inventories.
P.53 Acquisitions less disposals of valuables.
D.1 Compensation of employees (Pay) - the total remuneration of government employees.
D.29 Other taxes on production (payable) all taxes that enterprises incur as a result of engaging in production, independently of the quantity or value of the goods and services produced or sold. These include taxes on use or ownership of land or buildings, taxes on use of fixed assets, taxes on total wage bill and payroll, taxes on international transactions related to production.
D.3 Subsidies (payable) - current unrequited payments which general government or the institutions of the European Union make to resident producers, with the objective of influencing their levels of production, their prices or the remuneration of the factors of production.
D.4 Property income accrues when the owners of financial assets and natural resources put them at the disposal of other units of the economy. The income payable for the use of financial assets is called investment income, while that payable for the use of a natural resource is called rent. Property income is the sum of investment income and rent.
D.41 Interest receivable by the owners of a financial asset for putting it at the disposal of another institutional unit. Applies to deposits (AF.2), debt securities (AF.3), loans (AF.4) and other accounts payable (AF.8).
D.42 Dividends receivable by the owners of share equities. Dividends exclude "super dividends" which arise where the dividend paid is large relative to the recent level of dividends and earnings. Super dividends are recorded as withdrawal of equity (F.5). This arises, for example, in the case of dividends paid by the Central Bank in 2015.
D.45 Rent of a natural resource – income receivable by the owner of a natural resource for putting the resource at the disposal of another party.
D.5 Current taxes on income, wealth, etc., (payable) - all compulsory, unrequited payments, in cash or in kind, levied periodically by general government and by the rest of the world on the income and wealth of units in the economy, and some periodic taxes which are assessed neither on income nor wealth.
D.6 Social contributions - transfers to households, in cash or in kind, intended to relieve them from the financial burden of a number of risks or needs.
D.7 Other current transfers – includes VAT and GNI based EU budget contributions, current transfers between subsectors of government, current international co-operation and current transfers to households and non-profit institutions.
D.9 Capital transfers - involve the acquisition or disposal of an asset, or assets, by at least one of the parties to the transaction. Includes capital taxes and investment grants.
P.1 Total output of government is equal to market output, own account capital formation, and non-market output (i.e. the sum of D.1+P.2+P51c). The market output referred to in this publication is the imputed market value of social housing rented dwellings. See Table 3.
P.3 Final consumption expenditure of government is equal to the total of its output (P.1) plus the expenditure on products/services supplied to households via market producers minus the sales of goods and services (at both market and non-market prices). This is made up of individual non-market services plus collective non-market services (P.31 and P.32). See Table 4.
F.1 Monetary gold and Special drawing rights (SDRs)
F.11 Monetary gold
F.12 Special drawing rights (SDRs)
F.2 Currency and deposits
F.21 Currency
F.22 Transferable deposits
F.29 Other deposits
F.3 Debt securities
F.31 Short-term
F.32 Long-term
F.4 Loans
F.41 Short-term loans
F.42 Long-term loans
F.5 Equity and investment fund share
F.51 Equity
F.52 Investment fund shares/units
F.6 Insurance pension and standardised guarantee schemes
F.7 Financial derivatives and employee stock options
F.71 Financial derivatives
F.72 Employee stock options
F.8 Other accounts receivable/payable
F.81 Trade credits and advances
F.89 Other trade credits
 Hide Background Notes
Scan the QR code below to view this release online or go to
http://www.cso.ie/en/releasesandpublications/er/gfsq/governmentfinancestatisticsquarter32019/
 Show Table 1 General Government Transactions: Revenue, Expenditure, Financing and Deficit Q1 2016 to Q3 2019
 Hide Table 1 General Government Transactions: Revenue, Expenditure, Financing and Deficit Q1 2016 to Q3 2019