
| General Government Deficit, Debt and Net Worth Q1 2013 | ||||||||
| General Government Surplus/Deficit | General Government Gross Debt | General Government Net Worth | ||||||
| €m | % quarterly GDP | €m | % annualised GDP | €m | % annualised GDP | |||
| 2012 Q1 | -5,029 | -12.6 | 174,145 | 106.8 | -58,523 | -35.9 | ||
| 2013 Q1 | -5,387 | -13.8 | 204,054 | 125.1 | -81,126 | -49.7 | ||

Ireland’s General Government Deficit (GGDeficit) amounted to €5,387 million in the first quarter of 2013 representing 13.8% of quarterly GDP. This was almost €360 million greater than the corresponding figure for the first quarter of 2012. Government revenue for the period at €12,821 million was higher than the Q1 2012 revenue of €11,848 by €973 million (mainly due to increased revenue from taxes and social contributions). However expenditure in this quarter amounted to €18,128 million, representing an increase of €1,299 million on the Q1 2012 levels of €16,829 million. This was mainly due to increases in capital transfers (in particular, payments under the Eligible Liabilities Guarantee Scheme related to the liquidation of IBRC) and interest expenditure.
| A full description of the concepts and definitions used in the production of these figures is provided in the Background Notes. These notes also include a section detailing specific issues relevant to the data for the current release. |
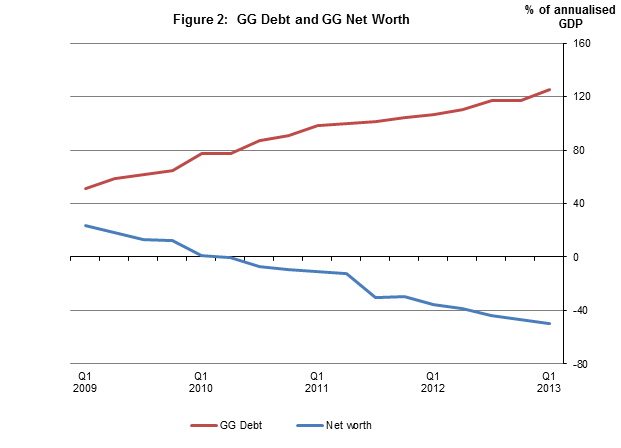
Increase in Government Debt
Ireland’s General Government Gross Debt (GGDebt) stood at €204.1 billion or 125.1% of annualised GDP at the end of Q1 2013, an increase of €11.6 billon since the previous quarter when GGDebt amounted to €192.5 billion representing 117.4% of GDP (Table 2).
General Government Net Debt for the corresponding period amounted to €154.9 billion or 95.0% of GDP. This net debt figure is obtained by deducting the value of the financial assets corresponding to those categories of financial liabilities which comprise GGDebt from the gross debt figure.
Fall in Government Net Worth
Net Worth (non-financial assets plus financial assets less liabilities) of General Government continued its recent decline in Q1 2013, falling to -€81.1 billion from -€77.2 billion at the end of the previous quarter (Table 2).
This change is explained primarily by the -€5,387 million GGDeficit incurred in the quarter, offset by holding gains on equity assets of General Government amounting to +€1,368 million (see Table 6 of detailed tables).
Tables 1 and 2 set out the main components of Government revenue and expenditure as well as details of government assets and liabilities. Additional, more detailed tables are available at http://www.cso.ie/en/releasesandpublications/nationalaccounts/governmentfinancestatistics/.
| Table 1 General Government Transactions: Revenue, Expenditure, Financing and Deficit | € million | |||||||||||||||||
| Description | ESA code | 2009 Q1 | 2009 Q2 | 2009 Q3 | 2009 Q4 | 2010 Q1 | 2010 Q2 | 2010 Q3 | 2010 Q4 | 2011 Q1 | 2011 Q2 | 2011 Q3 | 2011 Q4 | 2012 Q1 | 2012 Q2 | 2012 Q3 | 2012 Q4 | 2013 Q1 |
| General Government transactions | ||||||||||||||||||
| Revenue | TR | 12,174 | 13,522 | 13,219 | 17,105 | 11,634 | 14,185 | 12,644 | 16,657 | 11,764 | 14,062 | 13,105 | 16,482 | 11,848 | 14,269 | 13,697 | 16,781 | 12,821 |
| Taxes and social contributions | 10,646 | 11,603 | 11,490 | 14,171 | 9,747 | 11,402 | 11,167 | 14,002 | 10,310 | 11,663 | 11,576 | 14,327 | 10,393 | 11,734 | 12,056 | 15,018 | 11,625 | |
| Taxes | D2 + D5 + D91 | 8,006 | 8,829 | 8,299 | 10,790 | 6,983 | 8,679 | 8,484 | 10,696 | 7,669 | 9,235 | 9,057 | 11,665 | 8,138 | 9,398 | 9,701 | 12,457 | 9,195 |
| Social contributions | D61 | 2,640 | 2,774 | 3,191 | 3,381 | 2,764 | 2,722 | 2,683 | 3,305 | 2,641 | 2,429 | 2,519 | 2,662 | 2,255 | 2,336 | 2,355 | 2,562 | 2,430 |
| Sales of goods and services | P1O | 910 | 969 | 1,104 | 1,561 | 1,087 | 926 | 1,050 | 2,179 | 1,107 | 1,232 | 1,242 | 1,505 | 1,036 | 1,127 | 1,222 | 1,483 | 833 |
| Investment income | D4 | 391 | 741 | 415 | 438 | 270 | 1,116 | 337 | 389 | 263 | 1,134 | 258 | 346 | 280 | 1,376 | 392 | 208 | 296 |
| Current transfer revenue | D7 | 71 | 28 | 26 | 27 | 63 | 22 | 20 | 21 | 28 | 12 | 7 | 17 | 21 | 11 | 6 | 26 | 21 |
| Capital transfer revenue | D9N | 156 | 181 | 185 | 909 | 466 | 721 | 69 | 67 | 56 | 22 | 22 | 287 | 117 | 21 | 20 | 45 | 45 |
| Expenditure | TE | 17,598 | 21,196 | 20,187 | 19,404 | 28,183 | 19,187 | 26,873 | 29,161 | 16,676 | 16,770 | 24,661 | 18,442 | 16,829 | 16,840 | 17,275 | 17,889 | 18,128 |
| Expense | 17,180 | 20,431 | 19,160 | 18,187 | 27,831 | 18,796 | 26,287 | 27,711 | 16,525 | 16,741 | 24,342 | 17,420 | 16,655 | 16,784 | 17,135 | 17,983 | 18,001 | |
| Compensation of employees | D1 | 5,181 | 5,023 | 5,046 | 5,455 | 4,827 | 4,634 | 4,762 | 5,062 | 4,874 | 4,680 | 4,720 | 4,839 | 4,889 | 4,617 | 4,653 | 4,625 | 4,791 |
| Use of goods and services plus taxes payable | P2 + D5 + D29 | 2,693 | 2,338 | 2,447 | 2,744 | 2,171 | 1,992 | 1,933 | 3,157 | 1,950 | 2,260 | 2,222 | 2,339 | 1,847 | 2,039 | 2,179 | 2,364 | 1,684 |
| Depreciation (Consumption of fixed capital) | K1 | 664 | 664 | 664 | 664 | 662 | 662 | 662 | 662 | 656 | 656 | 656 | 656 | 606 | 606 | 606 | 606 | 560 |
| Interest (excluding FISIM) | D41 | 809 | 819 | 802 | 859 | 1,139 | 1,177 | 1,456 | 1,211 | 1,223 | 1,289 | 1,447 | 1,231 | 1,298 | 1,433 | 1,646 | 1,534 | 1,841 |
| Subsidies | D3 | 403 | 411 | 412 | 464 | 378 | 333 | 367 | 499 | 304 | 300 | 326 | 419 | 325 | 344 | 366 | 504 | 318 |
| Social benefits | D62 + D631 | 6,633 | 7,123 | 7,873 | 7,382 | 6,477 | 7,318 | 7,509 | 7,139 | 6,722 | 7,227 | 7,645 | 7,350 | 6,934 | 6,921 | 7,092 | 7,591 | 7,094 |
| Other current transfers | D7 | 587 | 497 | 317 | 363 | 561 | 320 | 407 | 287 | 530 | 243 | 357 | 428 | 521 | 351 | 398 | 342 | 553 |
| Capital transfers | D9 | 209 | 3,554 | 1,598 | 255 | 11,617 | 2,360 | 9,192 | 9,695 | 266 | 87 | 6,968 | 157 | 235 | 473 | 194 | 416 | 1,161 |
| Net operating balance | -5,006 | -6,909 | -5,941 | -1,082 | -16,197 | -4,611 | -13,643 | -11,054 | -4,760 | -2,678 | -11,237 | -938 | -4,807 | -2,515 | -3,438 | -1,202 | -5,340 | |
| Net acquisition of non-financial assets | P5 + NP - K1 | 418 | 765 | 1,027 | 1,216 | 352 | 391 | 586 | 1,449 | 151 | 29 | 319 | 1,022 | 174 | 56 | 140 | -94 | 127 |
| Net lending (+) / net borrowing (-) | B9 | -5,424 | -7,673 | -6,968 | -2,299 | -16,549 | -5,001 | -14,229 | -12,503 | -4,912 | -2,707 | -11,556 | -1,960 | -4,981 | -2,571 | -3,579 | -1,108 | -5,308 |
| equals | ||||||||||||||||||
| Net acquisition of financial assets | 4,960 | 3,385 | -4,211 | -1,025 | 3,906 | -6,492 | 2,393 | -7,421 | 7,506 | -972 | -6,680 | 3,306 | 1,723 | 2,037 | 8,924 | -2,347 | 8,980 | |
| Debt instruments | F2 + F33 + F4 | 6,071 | 3,321 | -2,580 | -1,768 | 4,491 | -9,348 | 2,249 | -6,264 | 11,013 | -1,563 | -12,702 | 2,610 | 2,187 | 331 | 9,949 | -3,862 | 8,728 |
| Shares and other equity | F5 | 71 | -349 | -859 | -1,220 | 604 | 2,129 | 698 | -2,001 | -3,791 | 788 | 7,440 | -854 | -50 | 1,388 | 4 | 473 | 28 |
| Other financial assets | F34 + F61 + F62 + F7 | -1,182 | 413 | -772 | 1,963 | -1,189 | 727 | -554 | 844 | 284 | -197 | -1,418 | 1,550 | -414 | 318 | -1,029 | 1,042 | 224 |
| less | ||||||||||||||||||
| Net incurrence of liabilities | 10,383 | 11,058 | 2,757 | 1,273 | 20,456 | -1,490 | 16,621 | 5,083 | 12,417 | 1,735 | 4,876 | 5,266 | 6,703 | 4,608 | 12,503 | -1,240 | 14,288 | |
| Debt instruments | F2 + F33 + F4 | 10,621 | 11,005 | 2,669 | 1,768 | 20,146 | -1,341 | 16,574 | 5,820 | 11,161 | 1,975 | 5,086 | 6,245 | 5,258 | 4,931 | 12,782 | -282 | 12,852 |
| Other liabilities | F34 + F5 + F61 + F62 + F7 | -238 | 53 | 88 | -495 | 310 | -149 | 47 | -737 | 1,256 | -240 | -210 | -979 | 1,445 | -323 | -279 | -958 | 1,436 |
| General Government Deficit | ||||||||||||||||||
| Net lending / net borrowing | B9 | -5,423 | -7,673 | -6,968 | -2,298 | -16,550 | -5,002 | -14,228 | -12,504 | -4,911 | -2,707 | -11,556 | -1,960 | -4,980 | -2,571 | -3,579 | -1,107 | -5,308 |
| Adjustment for swaps | -1 | -1 | -1 | -1 | 2 | 2 | 2 | 2 | -34 | -34 | -34 | -34 | -49 | -54 | -55 | -63 | -80 | |
| General Government Surplus/Deficit | EDP_B9 | -5,424 | -7,674 | -6,969 | -2,299 | -16,548 | -5,000 | -14,226 | -12,502 | -4,945 | -2,741 | -11,590 | -1,994 | -5,029 | -2,625 | -3,634 | -1,170 | -5,387 |
| General Government Surplus/Deficit (% of quarterly GDP) | -13.1 | -18.6 | -17.3 | -5.8 | -42.0 | -12.4 | -35.4 | -32.9 | -12.5 | -6.6 | -28.2 | -4.9 | -12.6 | -6.2 | -8.8 | -2.9 | -13.8 | |
| Table 2 General Government Net Worth, Gross and Net Debt | € million | |||||||||||||||||
| Description | ESA code | 2009 Q1 | 2009 Q2 | 2009 Q3 | 2009 Q4 | 2010 Q1 | 2010 Q2 | 2010 Q3 | 2010 Q4 | 2011 Q1 | 2011 Q2 | 2011 Q3 | 2011 Q4 | 2012 Q1 | 2012 Q2 | 2012 Q3 | 2012 Q4 | 2013 Q1 |
| General Government net worth | ||||||||||||||||||
| Net worth at market value, excluding pension liabilities | NW | 40,878 | 31,424 | 21,414 | 19,644 | 2,137 | -1,248 | -11,835 | -14,684 | -16,990 | -19,507 | -48,412 | -47,618 | -58,523 | -62,934 | -71,854 | -77,203 | -81,126 |
| equals | ||||||||||||||||||
| Non-financial assets at market value | NFA | 66,789 | 64,628 | 62,730 | 61,020 | 60,029 | 59,076 | 58,319 | 58,425 | 57,877 | 57,207 | 56,826 | 57,148 | 57,322 | 57,378 | 57,519 | 57,425 | 57,552 |
| plus | ||||||||||||||||||
| Financial net worth at market value, excluding pension liabilities | FNW | -25,911 | -33,204 | -41,316 | -41,376 | -57,892 | -60,324 | -70,154 | -73,109 | -74,867 | -76,714 | -105,238 | -104,766 | -115,845 | -120,312 | -129,373 | -134,628 | -138,678 |
| equals | ||||||||||||||||||
| Financial assets at market value | FA | 70,576 | 74,676 | 72,080 | 72,382 | 77,948 | 69,820 | 72,108 | 64,965 | 71,028 | 66,780 | 58,737 | 62,357 | 64,612 | 66,098 | 75,231 | 73,154 | 83,546 |
| EDP debt instruments | AF2 + AF33 + AF4 | 42,823 | 46,216 | 43,711 | 41,950 | 46,697 | 37,419 | 39,689 | 32,908 | 42,726 | 40,902 | 28,214 | 30,839 | 33,175 | 33,627 | 43,602 | 40,249 | 49,137 |
| Shares and other equity | AF5 | 20,410 | 20,814 | 21,497 | 21,712 | 23,288 | 24,040 | 24,854 | 23,750 | 19,702 | 17,437 | 23,158 | 22,581 | 22,991 | 23,157 | 23,266 | 24,398 | 25,794 |
| Other financial assets | AF34 + AF61 + AF62 + AF7 | 7,343 | 7,646 | 6,872 | 8,720 | 7,963 | 8,361 | 7,565 | 8,307 | 8,600 | 8,441 | 7,365 | 8,937 | 8,446 | 9,314 | 8,363 | 8,507 | 8,615 |
| less | ||||||||||||||||||
| Liabilities at market value | 96,487 | 107,880 | 113,396 | 113,758 | 135,840 | 130,144 | 142,262 | 138,074 | 145,895 | 143,494 | 163,975 | 167,123 | 180,457 | 186,410 | 204,604 | 207,782 | 222,224 | |
| EDP debt instruments | AF2 + AF33 + AF4 | 90,157 | 101,350 | 106,606 | 107,816 | 129,590 | 124,048 | 136,031 | 132,639 | 139,187 | 137,023 | 157,295 | 161,089 | 172,994 | 179,041 | 197,314 | 201,104 | 214,512 |
| Other liabilities | AF34 + AF61 + AF62 + AF7 | 6,330 | 6,530 | 6,790 | 5,942 | 6,250 | 6,096 | 6,231 | 5,435 | 6,708 | 6,471 | 6,680 | 6,034 | 7,463 | 7,369 | 7,290 | 6,678 | 7,712 |
| Memo: Estimated pension liabilities of government | 116,000 | 116,000 | 116,000 | 116,000 | 116,000 | 116,000 | 116,000 | 116,000 | 116,000 | 116,000 | 116,000 | 116,000 | 116,000 | 116,000 | 116,000 | 116,000 | 116,000 | |
| Memo: Net worth, including pension liabilities | -75,122 | -84,576 | -94,586 | -96,356 | -113,863 | -117,248 | -127,835 | -130,684 | -132,990 | -135,507 | -164,412 | -163,618 | -174,523 | -178,934 | -187,854 | -193,203 | -197,127 | |
| Contingent liabilities | 286,370 | 286,370 | 286,370 | 286,370 | 162,076 | 162,076 | 162,076 | 162,076 | 147,241 | 147,241 | 147,241 | 147,241 | 119,306 | 119,306 | 119,306 | 119,306 | 119,306 | |
| Memo: Net worth, including pension liabilities and contingent liabilities | -361,492 | -370,946 | -380,957 | -382,726 | -275,940 | -279,324 | -289,911 | -292,760 | -280,231 | -282,749 | -311,653 | -310,859 | -293,829 | -298,240 | -307,160 | -312,509 | -316,433 | |
| General Government: changes in net worth | ||||||||||||||||||
| Opening net worth | 46,749 | 40,878 | 31,424 | 21,414 | 19,644 | 2,137 | -1,248 | -11,835 | -14,684 | -16,990 | -19,507 | -48,412 | -47,618 | -58,523 | -62,934 | -71,854 | -77,203 | |
| Change in net worth due to transactions | -5,005 | -6,908 | -5,941 | -1,082 | -16,198 | -4,611 | -13,642 | -11,055 | -4,760 | -2,678 | -11,237 | -938 | -4,806 | -2,515 | -3,439 | -1,201 | -5,180 | |
| Net acquisition of non-financial assets | P5 + NP - K1 | 418 | 765 | 1,027 | 1,216 | 352 | 391 | 586 | 1,449 | 151 | 29 | 319 | 1,022 | 174 | 56 | 140 | -94 | 127 |
| Net lending/net borrowing | B9 | -5,423 | -7,673 | -6,968 | -2,298 | -16,550 | -5,002 | -14,228 | -12,504 | -4,911 | -2,707 | -11,556 | -1,960 | -4,980 | -2,571 | -3,579 | -1,107 | -5,308 |
| Change in net worth due to other economic flows | Kx | -866 | -2,546 | -4,070 | -688 | -1,309 | 1,227 | 3,055 | 8,206 | 2,453 | 160 | -17,668 | 1,732 | -6,099 | -1,896 | -5,482 | -4,148 | 1,258 |
| Other changes in non-financial assets | -2,926 | -2,926 | -2,926 | -2,926 | -1,343 | -1,343 | -1,343 | -1,343 | -700 | -700 | -700 | -700 | 0 | 0 | 0 | 0 | 0 | |
| Other changes in financial assets | -665 | 715 | 1,615 | 1,327 | 1,660 | -1,636 | -105 | 278 | -1,443 | -3,276 | -1,363 | 314 | 532 | -551 | 209 | 270 | 1,412 | |
| Other changes in liabilities | 2,725 | -335 | -2,759 | 911 | -1,626 | 4,206 | 4,503 | 9,271 | 4,596 | 4,136 | -15,605 | 2,118 | -6,631 | -1,345 | -5,691 | -4,418 | -155 | |
| Closing net worth | 40,878 | 31,424 | 21,414 | 19,644 | 2,137 | -1,248 | -11,835 | -14,684 | -16,990 | -19,507 | -48,412 | -47,618 | -58,523 | -62,934 | -71,854 | -77,203 | -81,126 | |
| General Government Debt (GGDebt) | ||||||||||||||||||
| Debt instrument liabilities at market value | 90,157 | 101,350 | 106,606 | 107,816 | 129,590 | 124,048 | 136,031 | 132,639 | 139,187 | 137,023 | 157,295 | 161,089 | 172,994 | 179,041 | 197,314 | 201,104 | 214,512 | |
| + Difference between EDP face value and market value | -639 | -19 | -3,632 | -3,272 | -5,401 | -324 | 2,993 | 11,525 | 16,676 | 21,762 | 5,081 | 8,137 | 1,151 | 1,725 | -5,523 | -8,645 | -10,458 | |
| Gross General Government Debt (EDP face value) | 89,518 | 101,331 | 102,974 | 104,544 | 124,189 | 123,724 | 139,024 | 144,164 | 155,863 | 158,785 | 162,376 | 169,226 | 174,145 | 180,766 | 191,791 | 192,459 | 204,054 | |
| less EDP debt instrument assets | -42,823 | -46,216 | -43,711 | -41,950 | -46,697 | -37,419 | -39,689 | -32,908 | -42,726 | -40,902 | -28,214 | -30,839 | -33,175 | -33,627 | -43,602 | -40,249 | -49,137 | |
| Net General Government Debt | 46,695 | 55,115 | 59,263 | 62,594 | 77,492 | 86,305 | 99,335 | 111,256 | 113,137 | 117,883 | 134,162 | 138,387 | 140,970 | 147,139 | 148,189 | 152,210 | 154,917 | |
| General Government Net Worth (% of annualised GDP) | 23.3 | 18.3 | 12.8 | 12.1 | 1.3 | -0.8 | -7.4 | -9.3 | -10.7 | -12.2 | -30.2 | -29.3 | -35.9 | -38.5 | -43.9 | -47.1 | -49.7 | |
| General Government Debt (% of annualised GDP) | 51.0 | 59.0 | 61.7 | 64.4 | 77.4 | 77.5 | 87.2 | 91.2 | 98.6 | 99.7 | 101.4 | 104.1 | 106.8 | 110.5 | 117.1 | 117.4 | 125.1 | |
| Net General Government Debt (% of annualised GDP) | 26.6 | 32.1 | 35.5 | 38.6 | 48.3 | 54.1 | 62.3 | 70.4 | 71.6 | 74.0 | 83.8 | 85.1 | 86.5 | 89.9 | 90.5 | 92.8 | 95.0 |
Government Finance Statistics – Concepts and Definitions
Government Finance Statistics (GFS) form the basis for fiscal monitoring in Europe, in particular in relation to the Excessive Deficit Procedure (EDP).
European GFS, including EDP statistics are produced according to the legally binding accounting rules of the European System of Accounts 1995 (ESA95). The Manual on Government Debt and Deficit (MGDD) provides further guidance on the implementation of ESA95 in the context of GFS.
The ESA95 regulation sets out both a methodology for the compilation of National Accounts and a programme of transmission of key economic aggregates which are a subset of the full set of accounts set out in ESA95. In relation to GFS aggregates of interest include: general government revenue and expenditure, general government surplus/deficit, general government consolidated gross debt, and general government net worth as well as the main components of these measures
EU Member States are required to report government deficit/surplus and debt data biannually under the EDP (before 1 April and 1 October in year N) for years N-4 to N-1 calendar years as well as a forecast for the current year. The data are reported in harmonised tables, which provide a consistent framework for the presentation of this data by Member States. The tables provide a structure for linking national budgetary aggregates with government deficit and debt.
Detailed statistics on Government revenue, expenditure and financial flows and stock positions are also provided to Eurostat under the ESA95 transmission programme. For quarterly data the main tables reported are:
Table 2500 Quarterly non-financial accounts for general government,
Table 2700 Quarterly financial accounts for general government
Table 2800 Quarterly government debt.
Total general government expenditure and revenue are defined according to Commission Regulation (EC) No 1500/2000 of 10 July 2000 on general government expenditure and revenue. They comprise specific categories of ESA95.
Definition of general government and its subsectors
The general government sector of the economy, is defined in ESA95, paragraph 2.68: 'All institutional units which are other non-market producers [institutional units whose sales do not cover more than the 50% of the production costs, see ESA95 paragraph 3.26] whose output is intended for individual and collective consumption, and mainly financed by compulsory payments made by units belonging to other sectors, and/or all institutional units principally engaged in the redistribution of national income and wealth'. General government comprises the sub-sectors central government (S.1311), state government (S.1312 - where applicable), local government (S.1313), and social security funds (S.1314).
As part of the GFS production process CSO is required to define the General Government and public sectors for Ireland. In this context, the public sector includes all bodies that are directly or indirectly controlled by a Government department or office, or by a local authority. General Government, in turn, includes all public sector bodies that are also mainly financed by Government bodies. The decision rules governing the classification of bodies to the public and General Government sectors are set out in detail in the Manual on Government Deficit and Debt. A detailed explanation of the application of these rules and the most up-to-date list of public sector and (including general government bodies) for Ireland are shown at
http://www.cso.ie/en/media/csoie/surveysandmethodologies/documents/pdfdocs/RegPublicSectorBodies.pdf
General Government Deficit/Surplus (GGDeficit) is the standard European measure of the fiscal balance, which is used to monitor compliance with the Stability and Growth Pact. It is the difference between the revenue and the expenditure of the general government sector. The government deficit data related to the EDP (EDP B.9) differs from the deficit according to ESA95 (B.9) in the treatment of interest relating to swaps and forward rate agreements.
General Government Debt (GGDebt) is defined in the EU regulations implementing the Maastricht Treaty as the gross debt liabilities of the consolidated General Government sector, at nominal value.
‘Gross’ means that the value of any financial assets held by General Government cannot be deducted from the GGDebt. In Ireland’s case, this means that the liquid assets which are deducted from the ‘gross’ National Debt in arriving at the audited National Debt cannot be deducted from the GGDebt.
‘Debt liabilities’ are defined as the ESA categories AF.2 (Currency and deposits), AF.33 (Securities other than shares, excluding financial derivatives), and AF.4 (loans).
This definition excludes liabilities in derivatives (AF.34), equity liabilities (AF.5), pension and insurance liabilities (AF.6) and accounts payable (AF.7).
‘Consolidated’ means that any money owed by one entity within General Government to another is excluded from the total GGDebt.
‘Nominal value’ is defined in the governing regulation as face value. If debt is sold at a discount, it is the undiscounted value of the instrument, rather than the amount actually received, that is shown in the GGDebt. In other statistical contexts, ‘nominal value’ means face value plus any interest accrued but not paid; however, such interest is excluded from GGDebt by definition.
General Government Net Worth is calculated as the value of the non-financial assets of General Government plus financial net worth of General Government (financial net worth equals the difference between the financial assets and liabilities of the sector). The net worth figures presented in this release are shown at market value.
ESA95 codes as given in the tables of this release and an explanation of each code are shown below for the main components of Government revenue and expenditure as well as for types of financial flows. More detailed codes and technical definitions can be seen in the ESA95 manual available at http://circa.europa.eu/irc/dsis/nfaccount/info/data/esa95/en/esa95en.htm.
Main Components of General Government Expenditure and Revenue
P.2 Intermediate consumption – value of goods and services used in the process of production, excluding
fixed assets
P.5 Gross capital formation
P.51 Gross fixed capital formation - acquisitions, less disposals, of fixed assets during a given period
plus certain additions to the value of non-produced assets realised by productive activity. Fixed assets
are tangible or intangible assets produced as outputs from processes of production that are
themselves used repeatedly, or continuously, in processes of production for more than one year
P.52 Changes in inventories
P.53 Acquisitions less disposals of valuables
D.1 Compensation of employees – the total remuneration of government employees
D.11 Wages and salaries, in cash and in kind
D.12 Employers social contributions – actual (D.121) and imputed (D.122)
D.29 Other taxes on production (payable) all taxes that enterprises incur as a result of engaging in
production, independently of the quantity or value of the goods and services produced or sold. These
include taxes on use or ownership of land or buildings, taxes on use of fixed assets, taxes on total
wage bill and payroll, taxes on international transactions related to production.
D.3 Subsidies (payable) - current unrequited payments which general government or the Institutions of
the European Union make to resident producers, with the objective of influencing their levels of
production, their prices or the remuneration of the factors of production
D.4 Property income (payable) - the income receivable by the owner of a financial asset or a tangible
non-produced asset in return for providing funds to, or putting the tangible non-produced asset at
the disposal of, another unit
D.41 Interest (payable) - excludes settlements under swaps and forward rate arrangements,
as these are treated as financial transactions in the ESA95
D.5 Current taxes on income, wealth, etc, (payable) - all compulsory, unrequited payments, in cash or in
kind, levied periodically by general government and by the rest of the world on the income and wealth
of units in the economy, and some periodic taxes which are assessed neither on income nor wealth
D.6 Social contributions - transfers to households, in cash or in kind, intended to relieve them from the
financial burden of a number of risks or needs, made through collectively organised schemes, or
outside such schemes by government and non-profit institutions. These include payments from
general government to producers which individually benefit households and which are made in the
context of social risks or needs
D.62 Social benefits in cash - social benefits and pensions paid in cash;
D.631 Social transfers in kind, via market producers - can be subdivided into those where beneficiary
households actually purchase the goods and services themselves and are then reimbursed, and those
where the relevant services are provided directly to the beneficiaries
D.7 Other current transfers
D.9 Capital transfers - involve the acquisition or disposal of an asset, or assets, by at least one of the
parties to the transaction.
K.1 Consumption of fixed capital - the amount of fixed assets used up, during the period under
consideration, as a result of normal wear and tear and foreseeable obsolescence, including a provision
for losses of fixed assets as a result of accidental damage which can be insured against.
Categories of Financial Flows
F.1 Monetary gold and special drawing rights (SDRs)
F.11 Monetary gold
F.12 Special drawing rights (SDRs)
F.2 Currency and deposits
F.21 Currency
F.22 Transferable deposits
F.29 Other deposits
F.3 Securities other than shares
F.33 Securities other than shares, excluding financial derivatives
(F.331 - Short-term, F.332 - Long-term)
F.34 Financial derivatives
F.4 Loans
F.41 - Short-term, F.42 - Long-term
F.5 Shares and other equity
F.51 Shares and other equity, excluding mutual funds shares (F.511 - Quoted shares,
F.512 - Unquoted shares, F.513 - Other equity )
F.52 Mutual funds shares
F.6 Insurance technical reserves
F.61 Net equity of households in life insurance reserves and in pension funds reserves
(F.611 - Net equity of households in life insurance reserves, F.612 - Net equity of households
in pension funds reserves,
F.62 - Prepayments of insurance premiums and reserves for outstanding claims
F.7 Other accounts receivable/payable
F.71 Trade credits and advances
F.79 Other
Adjustments specific to Quarter 1 2013 results
Redemption of Promissory Notes – Impact on General Government Debt and Deficit
The redemption of the promissory notes previously assigned to the Irish Bank Resolution Corporation (IBRC) in February 2013 has led to very significant changes in the composition of the GGDebt between Q4 2012 and Q1 2013.
Under the Excessive Deficit Procedure which sets out the rules for calculating GGDebt, the promissory notes were classified as long-term loans (F.42). Following IBRC’s liquidation in February 2013, the Central Bank acquired IBRC’s promissory note claim on the State (€25,261 million at face value). This claim was subsequently redeemed by the State in exchange for newly created long term government bonds (‘securities other than shares’, F.332).
This transaction took place at face value, so that it did not change the overall GGDebt. However, it resulted in an immediate shift in the composition of GGDebt of €25,261 million from long-term loans (F.42) to long-term bonds (F.332).
Promissory notes with an outstanding face value of €227 million assigned originally to EBS and now held by AIB were not affected by the redemption of IBRC’s promissory notes, and continue to be classified in the GGDebt as long-term loan liabilities.
Further changes in these categories have also arisen due to Ireland receiving further monies under the Troika Programme (long term loan – F.42) and to National Treasury Management Agency activity on the bond markets in Q1 2013.
As a consequence of all of these changes, the total debt under the category Long Term Loans has reduced by some €23,622 million while the total debt under the category Long Term Bonds has increased by €32,197 million (see Table 2 of this release and the more detailed tables available at http://www.cso.ie/en/releasesandpublications/nationalaccounts/governmentfinancestatistics/).
Meanwhile, the only impact on the GGDeficit for Q1 2013 is a minor change in interest payable arising from the difference between the interest rates payable on the promissory notes and those payable on the replacement bonds.
Reclassification of Public Universities and Fee-Paying Schools
The seven public universities and certain publicly funded fee-paying secondary schools have been reclassified from the Non-profit institutions serving households (NPISH) economic sector to the Non-financial corporations economic sector. This change has been made following an analysis by the CSO that these entities are ‘market producers’ – that is, they cover a majority of their costs through their own sales of education and research services – and has resulted in a number of reclassifications within the expenditure of General Government. Specifically, the changes shift expenditure from D.7 (transfers to NPISH) to a combination of
These changes have been applied retroactively to all quarters, and are consistent with those seen in the recently published CSO National Income and Expenditure 2012 and Quarterly Institutional Sector Accounts releases.
 Hide Background Notes
Scan the QR code below to view this release online or go to
http://www.cso.ie/en/releasesandpublications/er/gfsq/governmentfinancestatisticsquarter12013/
 Show Table 1 General Government Transactions: Revenue, Expenditure, Financing and Deficit Q1 2009 to Q1 2013
 Hide Table 1 General Government Transactions: Revenue, Expenditure, Financing and Deficit Q1 2009 to Q1 2013