
| General Government | ||||||
| Balance | Gross Debt | Net Debt | ||||
| Year | €bn | % GDP | €bn | % GDP | €bn | % GDP |
| 2017 | -0.9 | -0.3 | 201.3 | 67.8 | 175.0 | 58.9 |
| 2018 | 0.5 | 0.1 | 205.9 | 63.1 | 177.2 | 54.3 |
| 2019 | 1.8 | 0.5 | 204.0 | 57.2 | 174.6 | 49.0 |
| 2020 | -18.4 | -4.9 | 217.9 | 58.4 | 185.9 | 49.9 |
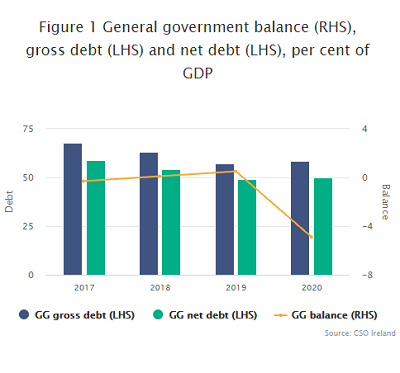
Provisional data for 2020 shows a general government deficit of €18.4 billion (4.9% of GDP / 8.8% of GNI*). In 2020 revenue decreased by €4.5 billion (5.1%) while expenditure increased by €15.7 billion (18.2%) resulting in a reduction of €20.2 billion over the 2019 surplus - see Table 1.
Government debt increases to 58.4% of GDP in 2020
Provisional data indicates that general government gross debt (GG Debt) stood at €217.9 billion at the end of 2020 (58.4% of GDP / 104.7% of GNI*) compared with the 2019 figure of €204.0 billion (57.2% of GDP / 94.6% of GNI*).
|
These annual results are provisional as the data is subject to a clarification process by Eurostat as part of Excessive Deficit Procedure reporting requirements. This process is due to be completed by 16 October 2021. It is envisaged that the detailed release and tables will be published by the CSO no later than 21 October 2020. The CSO PxStat is not updated with this provisional data. It will be updated when the detailed release and tables are published. The changes to the previously published tables under the EDP in April 2021 reflect updated data sources. The main EDP notification tables for Ireland, details of government guarantees, PPPs and concessions and tables showing the impact of government interventions in the financial sector on government accounts will be published on 21 October, the same day as Eurostat's EDP statistics release. Government accounts are compiled in the EU according to the European System of National Accounts 2010 (ESA2010) framework. |
| Table 1 General Government transactions: revenue, expenditure and deficit | ||||||||
| €million | ||||||||
| Description | ESA2010 code | 2017 | 2018 | 2019 | 2020 | |||
| General Government transactions | ||||||||
| Revenue | TR | 76,925 | 83,074 | 88,109 | 83,616 | |||
| Taxes and social contributions | D2 + D5 + D91 + D61 | 69,405 | 75,174 | 80,512 | 77,259 | |||
| Taxes | D2 + D5 + D91 | 55,714 | 60,549 | 64,677 | 62,289 | |||
| Social contributions | D61 | 13,691 | 14,625 | 15,834 | 14,970 | |||
| Sales of goods and services | P1O | 4,637 | 4,928 | 4,910 | 4,007 | |||
| Investment income | D4 | 1,779 | 1,533 | 1,579 | 1,119 | |||
| Current transfer revenue (excluding taxes) | D7 | 660 | 865 | 647 | 695 | |||
| Capital transfer revenue (excluding taxes) | D9N | 444 | 573 | 461 | 536 | |||
| Expenditure | TE | 77,802 | 82,587 | 86,286 | 102,033 | |||
| Expense | Expense | 76,403 | 79,951 | 82,644 | 98,217 | |||
| Compensation of employees | D1 | 21,112 | 22,124 | 23,435 | 24,510 | |||
| Use of goods and services plus taxes payable | P2 + D5 + D29 | 10,448 | 11,216 | 12,639 | 14,908 | |||
| Depreciation (Consumption of fixed capital) | P51c | 4,104 | 4,374 | 4,737 | 5,030 | |||
| Interest (excluding FISIM) | D41 | 5,906 | 5,315 | 4,623 | 3,829 | |||
| Subsidies | D3 | 1,857 | 1,948 | 1,709 | 5,652 | |||
| Social benefits | D62 + D632 | 28,579 | 29,397 | 30,644 | 38,530 | |||
| Other current transfers | D7 | 2,902 | 3,664 | 3,307 | 4,039 | |||
| Capital transfers | D9 | 1,494 | 1,912 | 1,551 | 1,720 | |||
| Net operating balance | NOB | 522 | 3,123 | 5,465 | -14,602 | |||
| Net acquisition of non-financial assets | P5 + NP - P51c | 1,399 | 2,636 | 3,642 | 3,815 | |||
| General Government Surplus/Deficit | B9 | -877 | 487 | 1,823 | -18,417 | |||
| General Government Surplus/Deficit (% of GDP) | -0.3 | 0.1 | 0.5 | -4.9 | ||||
| General Government Surplus/Deficit (% of GNI*) | -0.5 | 0.2 | 0.8 | -8.8 | ||||
| GDP at current market prices | 296,925 | 326,043 | 356,526 | 372,869 | ||||
| GNI* | 185,125 | 197,820 | 215,555 | 208,178 | ||||
Scan the QR code below to view this release online or go to
http://www.cso.ie/en/releasesandpublications/er/gfsap/governmentfinancestatisticsprovisionaloctober2021/
 Show Table 1 General Government Transactions: Revenue, Expenditure, Financing and Deficit
 Hide Table 1 General Government Transactions: Revenue, Expenditure, Financing and Deficit
 Hide Table