
| General Government and GDP | |||||||
| GG Deficit | GG Gross Debt | GG Net Debt | GDP | ||||
| End of year | €m | % GDP | €m | % GDP | €m | % GDP | €m |
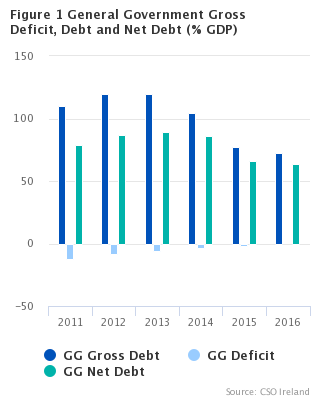
| 2011 | -21,886 | -12.7 | 189,725 | 110.3 | 135,093 | 78.6 | 171,939 |
| 2012 | -14,112 | -8.0 | 210,016 | 119.6 | 152,111 | 86.6 | 175,561 |
| 2013 | -11,020 | -6.1 | 215,296 | 119.4 | 161,460 | 89.6 | 180,298 |
| 2014 | -7,099 | -3.6 | 203,326 | 104.5 | 167,206 | 86.0 | 194,537 |
| 2015 | -4,968 | -1.9 | 201,589 | 76.9 | 172,514 | 65.8 | 262,037 |
| 2016 | -1,907 | -0.7 | 200,592 | 72.8 | 175,617 | 63.7 | 275,567 |
For 2016 the government deficit was €1.9 billion (-0.7% of GDP) an improvement on the 2015 deficit of €5 billion (-1.9% of GDP). The change was driven by an increase of 2.9% in government revenues to €72.6 billion in 2016 coupled with a 1.4% decrease in expenditure to €74.6 billion between 2015 and 2016 (Table 1). The upward trend in tax and social contribution revenue continues with increases of €2.1 billion (+4.2%) in Taxes and €0.7 billion (+5.8%) in Social contributions. These increases were partially offset by a reduction in Investment income of €0.9 billion (-32.8%) (Table 1).
Although total government expenditure fell in 2016, the comparison with 2015 is impacted by a once-off capital transfer of €2.1 billion in 2015. Excluding this item results in an increase of €0.7 billion in other expenditure categories between 2015 and 2016. There were increases in Compensation of employees/Pay (+2.4%), Use of goods and services (+2.5%) and Gross fixed capital formation (+12.8%). Debt service costs, or Interest, continued to decrease in 2016 with a reduction of 9.8% (Tables 1 and 4).
Interventions to support financial institutions were almost neutral in their effect on the deficit in 2016 with associated interest costs largely offset by dividend and income. Investment income fell over the period 2012-2016 as the State reduced its holdings in financial institutions (Table 1).
Government debt falls to 72.8% of GDP in 2016
The general government gross debt (GG Debt) stood at €200.6 billion at the end of 2016 (72.8% of GDP), down from the 2015 figure of €201.6 billion (76.9% of GDP). The increase in GDP in 2016 coupled with the decrease in GG Debt contributed to the decrease in the debt to GDP ratio (Table 2).
There was a reduction in all categories of GG Debt, except that of Currency and deposits (F2) and Short term debt securities (F31). On the financial assets side, reductions in all categories of assets were observed, except Other accounts receivable/payable (F8) (Table 6). At the end of 2016 general government net debt increased by €3.1 billion to €175.6 billion (63.7% of GDP). This increase was composed of a €1 billion reduction in GG Debt and a fall of €4.1 billion in cash deposits and debt security assets over the same period (Tables 2 and 7).
|
National accounts are compiled in the EU according to the European System of National Accounts 2010 (ESA2010) framework. The data in this release are subject to the normal EDP verification process by Eurostat until 23 October 2017 and are therefore provisional.The changes to the previously published tables under the Excessive Debt Procedure in April 2017 reflect updated data sources which become available between the April and October publications as well as a change to methodology for the treatment of the sale of mobile phone licences - see Background Notes. Tables included in the release show a reconciliation of the Exchequer balance to the General Government balance (Table 8) and a central/local government breakdown of revenue and expenditure (Tables 10-15). GFS annual results are benchmarked to the most recent EDP notification. Consequently, they may not always be fully aligned with the National Income and Expenditure and related publications such as the Institutional Sector Accounts. The main EDP notification tables for Ireland, details of government guarantees, PPPs and concessions and tables showing the impact of government interventions in the financial sector on government accounts will be published on 23 October, the same day as the Eurostat release.
|
| Total Revenue | Total Expenditure | |
| 2011 | 33.57 | 46.3 |
| 2012 | 33.88 | 41.92 |
| 2013 | 34.11 | 40.22 |
| 2014 | 33.89 | 37.54 |
| 2015 | 26.94 | 28.84 |
| 2016 | 26.36 | 27.05 |
| Table 1 General Government transactions: revenue, expenditure, financing and deficit | ||||||||||
| €million | ||||||||||
| Description | ESA2010 code | 2011 | 2012 | 2013 | 2014 | 2015 | 2016 | |||
| General Government transactions | ||||||||||
| Revenue | TR | 57,736 | 59,493 | 61,513 | 65,943 | 70,603 | 72,645 | |||
| Taxes and social contributions | D2 + D5 + D91 + D61 | 49,231 | 50,818 | 52,925 | 57,450 | 62,174 | 64,976 | |||
| Taxes | D2 + D5 + D91 | 38,863 | 40,944 | 42,516 | 46,467 | 50,786 | 52,928 | |||
| Social contributions | D61 | 10,368 | 9,874 | 10,410 | 10,983 | 11,388 | 12,048 | |||
| Sales of goods and services | P1O | 5,163 | 5,057 | 4,868 | 4,739 | 5,119 | 4,692 | |||
| Investment income | D4 | 2,471 | 3,065 | 3,272 | 3,068 | 2,710 | 1,822 | |||
| Current transfer revenue (excluding taxes) | D7 | 262 | 254 | 150 | 282 | 292 | 231 | |||
| Capital transfer revenue (excluding taxes) | D9N | 610 | 299 | 298 | 405 | 308 | 925 | |||
| Expenditure | TE | 79,622 | 73,603 | 72,533 | 73,042 | 75,572 | 74,553 | |||
| Expense | Expense | 78,395 | 73,161 | 72,095 | 72,141 | 74,691 | 73,328 | |||
| Compensation of employees | D1 | 19,389 | 18,996 | 18,594 | 18,344 | 18,898 | 19,354 | |||
| Use of goods and services plus taxes payable | P2 + D5 + D29 | 8,801 | 8,343 | 8,196 | 8,906 | 9,179 | 9,406 | |||
| Depreciation (Consumption of fixed capital) | P51c | 3,049 | 3,111 | 3,175 | 3,330 | 3,526 | 3,738 | |||
| Interest (excluding FISIM) | D41 | 5,768 | 7,298 | 7,774 | 7,604 | 6,858 | 6,187 | |||
| Subsidies | D3 | 1,725 | 1,910 | 1,906 | 1,863 | 1,766 | 1,674 | |||
| Social benefits | D62 + D632 | 28,827 | 29,454 | 28,526 | 28,076 | 28,422 | 28,494 | |||
| Other current transfers | D7 | 2,614 | 2,531 | 2,908 | 2,784 | 2,564 | 3,012 | |||
| Capital transfers | D9 | 8,222 | 1,519 | 1,016 | 1,234 | 3,478 | 1,462 | |||
| Net operating balance | NOB | -20,659 | -13,670 | -10,581 | -6,197 | -4,088 | -683 | |||
| Net acquisition of non-financial assets | P5 + NP - P51c | 1,228 | 442 | 438 | 901 | 881 | 1,225 | |||
| General Government Surplus/Deficit | B9 | -21,886 | -14,112 | -11,020 | -7,099 | -4,968 | -1,907 | |||
| equals | ||||||||||
| Net acquisition of financial assets | ΔFA | 3,770 | 5,640 | -5,676 | -18,871 | -7,489 | -4,207 | |||
| Debt instruments | F2 + F3 + F4 | -436 | 4,105 | -4,322 | -19,597 | -7,222 | -4,305 | |||
| Equity and Investment Fund Shares | F5 | 3,703 | 1,826 | -1,307 | -91 | 240 | -385 | |||
| Other financial assets | F6 + F7 + F8 | 503 | -291 | -47 | 817 | -507 | 483 | |||
| less | ||||||||||
| Net incurrence of liabilities | ΔL | 25,656 | 19,752 | 5,344 | -11,772 | -2,521 | -2,300 | |||
| Debt instruments | F2 + F3 + F4 | 25,302 | 19,662 | 5,501 | -12,559 | -2,831 | -2,057 | |||
| Other liabilities | F5 + F6 + F7 + F8 | 354 | 90 | -157 | 787 | 310 | -243 | |||
| Memo: Net derivative flows on debt interest swap contracts | -132 | -221 | -274 | -264 | -240 | -275 | ||||
| General Government Surplus/Deficit (% of GDP) | -12.7 | -8.0 | -6.1 | -3.6 | -1.9 | -0.7 | ||||
| Government interventions to support financial institutions | ||||||||||
| Revenue (a+b+c+d) | 3,065 | 3,036 | 2,809 | 2,295 | 2,174 | 1,711 | ||||
| Guarantee fees receivable (a) | P131(part) | 1,215 | 934 | 420 | 155 | 53 | 42 | |||
| Interest receivable (b) | D4(part) | 1,041 | 1,539 | 1,090 | 712 | 505 | 135 | |||
| Dividends receivable (c) | D4(part) | 333 | 502 | 760 | 761 | 962 | 749 | |||
| Other (d) | P131(part) | 476 | 61 | 539 | 668 | 653 | 785 | |||
| Expenditure (e+f+g+h) | 9,436 | 2,681 | 2,370 | 2,281 | 4,008 | 1,732 | ||||
| Interest payable (e) | D4(part) | 2,150 | 2,047 | 1,864 | 1,528 | 1,211 | 1,050 | |||
| Capital injections recorded as deficit-increasing (capital transfer)(f) | D9(part) | 7,114 | 280 | 0 | 0 | 2,111 | 0 | |||
| Calls on guarantees (g) | D9(part) | 0 | 0 | 0 | 0 | 0 | 0 | |||
| Other (h) | various | 172 | 353 | 506 | 753 | 686 | 682 | |||
| Impact of the above interventions on General Government Surplus/Deficit | -6,370 | 355 | 439 | 15 | -1,834 | -21 | ||||
| General Government Surplus/Deficit excluding interventions to support financial institutions | -15,516 | -14,466 | -11,458 | -7,113 | -3,135 | -1,886 | ||||
| Table 2 General Government Net Worth, Gross and Net Debt | ||||||||||||
| €million | ||||||||||||
| Description | ESA2010 code | 2011 | 2012 | 2013 | 2014 | 2015 | 2016 | |||||
| General Government net worth | ||||||||||||
| Net worth at market value, excluding pension liabilities | NW | -20,490 | -49,476 | -53,504 | -58,050 | -48,227 | -44,025 | |||||
| equals | ||||||||||||
| Non-financial assets at market value | NFA | 85,016 | 87,371 | 90,081 | 95,053 | 100,877 | 107,059 | |||||
| plus | ||||||||||||
| Financial net worth at market value, excluding pension liabilities | FNW | -105,506 | -136,847 | -143,585 | -153,103 | -149,104 | -151,084 | |||||
| equals | ||||||||||||
| Financial assets at market value | FA | 88,214 | 92,609 | 94,292 | 84,008 | 84,294 | 79,839 | |||||
| EDP debt instruments | F2 + F3 + F4 | 54,631 | 57,905 | 53,837 | 36,120 | 29,076 | 24,975 | |||||
| Equity and Investment Fund Shares | F5 | 22,975 | 25,098 | 30,795 | 38,201 | 45,260 | 45,230 | |||||
| Other financial assets | F6 + F7 + F8 | 10,608 | 9,606 | 9,660 | 9,687 | 9,958 | 9,634 | |||||
| less | ||||||||||||
| Liabilities at market value | L | 193,720 | 229,456 | 237,877 | 237,111 | 233,398 | 230,923 | |||||
| EDP debt instruments | F2 + F3 + F4 | 182,594 | 218,412 | 228,858 | 227,779 | 223,144 | 221,003 | |||||
| Other liabilities | F5 + F6 + F7 + F8 | 11,126 | 11,044 | 9,019 | 9,332 | 10,254 | 9,920 | |||||
| Memo: Estimated pension liabilities of government | 116,000 | 98,000 | 98,000 | 98,000 | 98,000 | 98,000 | ||||||
| Memo: Net worth, including pension liabilities | -136,490 | -147,476 | -151,504 | -156,050 | -146,227 | -142,025 | ||||||
| Contingent liabilities | 141,994 | 118,926 | 59,522 | 29,412 | 17,255 | 10,325 | ||||||
| Memo: Net worth, including pension liabilities and contingent liabilities | -278,484 | -266,402 | -211,026 | -185,462 | -163,482 | -152,350 | ||||||
| General Government: changes in net worth | ||||||||||||
| Opening net worth | 6,378 | -20,490 | -49,476 | -53,504 | -58,050 | -48,227 | ||||||
| Change in net worth due to transactions | -20,658 | -13,670 | -10,581 | -6,197 | -4,088 | -683 | ||||||
| Net acquisition of non-financial assets | P5 + NP - P51c | 1,228 | 442 | 438 | 901 | 881 | 1,225 | |||||
| Net lending/net borrowing | B9 | -21,886 | -14,112 | -11,020 | -7,099 | -4,968 | -1,907 | |||||
| Change in net worth due to other economic flows | Kx | -6,210 | -15,316 | 6,554 | 1,651 | 13,911 | 4,884 | |||||
| Other changes in non-financial assets | -604 | 1,913 | 2,272 | 4,070 | 4,944 | 4,957 | ||||||
| Other changes in financial assets | 22,385 | -1,245 | 7,359 | 8,587 | 7,775 | -248 | ||||||
| Other changes in liabilities | -27,991 | -15,984 | -3,077 | -11,006 | 1,192 | 175 | ||||||
| Closing net worth | -20,490 | -49,476 | -53,504 | -58,050 | -48,227 | -44,025 | ||||||
| General Government Debt (GGDebt) | ||||||||||||
| Debt instrument liabilities at market value | F2 + F3 + F4 | 182,594 | 218,412 | 228,858 | 227,779 | 223,144 | 221,003 | |||||
| + Difference between EDP face value and market value | 7,131 | -8,396 | -13,562 | -24,453 | -21,555 | -20,411 | ||||||
| Gross General Government Debt (EDP face value) | GGDebt | 189,725 | 210,016 | 215,296 | 203,326 | 201,589 | 200,592 | |||||
| less EDP debt instrument assets | F2 + F3 + F4 | -54,632 | -57,905 | -53,836 | -36,120 | -29,075 | -24,975 | |||||
| Net General Government Debt | GGNetDebt | 135,093 | 152,111 | 161,460 | 167,206 | 172,514 | 175,617 | |||||
| Closing Net Worth (% of GDP) | -11.9 | -28.2 | -29.7 | -29.8 | -18.4 | -16.0 | ||||||
| Gross General Government Debt (% of GDP) | 110.3 | 119.6 | 119.4 | 104.5 | 76.9 | 72.8 | ||||||
| Net General Government Debt (% of GDP) | 78.6 | 86.6 | 89.6 | 86.0 | 65.8 | 63.7 | ||||||
| Table 3 General Government: detailed classification of revenue and output | |||||||||||
| €million | |||||||||||
| Description | ESA2010 code | 2011 | 2012 | 2013 | 2014 | 2015 | 2016 | ||||
| Total Revenue | TR | 57,736 | 59,493 | 61,513 | 65,943 | 70,603 | 72,645 | ||||
| Taxes and social contributions | 49,231 | 50,818 | 52,925 | 57,450 | 62,174 | 64,976 | |||||
| Taxes | D2 + D5 + D91 | 38,863 | 40,944 | 42,516 | 46,467 | 50,786 | 52,928 | ||||
| Indirect taxes (taxes on production and imports) | D2 | 17,779 | 18,359 | 19,302 | 21,210 | 22,525 | 23,431 | ||||
| Taxes on products | D21 | 15,705 | 16,099 | 16,749 | 18,237 | 19,441 | 20,773 | ||||
| of which Value-Added Tax | D211 | 9,755 | 10,219 | 10,372 | 11,521 | 11,955 | 12,826 | ||||
| Other taxes on production | D29 | 2,074 | 2,259 | 2,553 | 2,973 | 3,084 | 2,658 | ||||
| Direct taxes | D5 | 20,842 | 22,300 | 22,935 | 24,898 | 27,860 | 29,087 | ||||
| Taxes on income, profits and capital gains | D51 | 19,435 | 20,837 | 21,298 | 23,016 | 26,588 | 28,039 | ||||
| Other current direct taxes | D59 | 1,407 | 1,463 | 1,637 | 1,882 | 1,272 | 1,047 | ||||
| Capital taxes | D91 | 242 | 285 | 278 | 359 | 401 | 411 | ||||
| Social contributions | D61 | 10,368 | 9,874 | 10,410 | 10,983 | 11,388 | 12,048 | ||||
| Actual social contributions | D611 + D613 | 9,039 | 8,482 | 9,007 | 9,594 | 10,207 | 10,773 | ||||
| PRSI receipts | D611 + D613(pt) | 7,268 | 6,799 | 7,299 | 7,947 | 8,512 | 9,226 | ||||
| Government employees' social contributions | D613(pt) | 1,770 | 1,682 | 1,709 | 1,647 | 1,695 | 1,547 | ||||
| Employers' imputed social contributions | D612 | 1,330 | 1,393 | 1,402 | 1,389 | 1,181 | 1,275 | ||||
| Sales of goods and services | P1O | 5,163 | 5,057 | 4,868 | 4,739 | 5,119 | 4,692 | ||||
| Sales of market establishments (= market output) | P11 | 905 | 956 | 991 | 1,039 | 1,117 | 1,208 | ||||
| Imputed sales related to production of own-use capital assets (= output for own final use) | P12 | 58 | 38 | 33 | 33 | 21 | 21 | ||||
| Incidental sales and fees of non-market establishments | P131 | 4,200 | 4,063 | 3,845 | 3,666 | 3,981 | 3,464 | ||||
| Investment income | D4 | 2,471 | 3,065 | 3,272 | 3,068 | 2,710 | 1,822 | ||||
| Interest (excluding FISIM) | D41 | 1,367 | 1,606 | 1,396 | 1,042 | 665 | 240 | ||||
| Dividends | D42 | 1,077 | 1,428 | 1,772 | 1,923 | 1,942 | 1,478 | ||||
| Rent of land and subsoil assets | D45 | 28 | 31 | 103 | 103 | 103 | 103 | ||||
| Current transfer revenue | D39 + D7 | 262 | 254 | 150 | 282 | 292 | 231 | ||||
| Subsidies | D39 | 0 | 0 | 0 | 0 | 0 | 0 | ||||
| Other current transfers | D7 | 262 | 254 | 150 | 282 | 292 | 231 | ||||
| Non-life insurance claims | D72 | 13 | 8 | 9 | 7 | 6 | 6 | ||||
| Other Domestic - Current | D7N_S1 | 204 | 200 | 131 | 239 | 193 | 193 | ||||
| From Rest of World - Current | D7N_S2 | 45 | 46 | 11 | 36 | 93 | 32 | ||||
| Capital transfer revenue | D9N | 610 | 299 | 298 | 405 | 308 | 925 | ||||
| Output | P1 | 31,533 | 30,802 | 30,339 | 30,983 | 32,072 | 33,046 | ||||
| Market output (sales of market establishments) | P11 | 905 | 956 | 991 | 1,039 | 1,117 | 1,208 | ||||
| Output for own final use | P12 | 58 | 38 | 33 | 33 | 21 | 21 | ||||
| Non-market output | P13 | 30,570 | 29,808 | 29,315 | 29,911 | 30,934 | 31,818 | ||||
| = Non-market compensation of employees | D1_nonmarket | 19,331 | 18,958 | 18,561 | 18,311 | 18,878 | 19,333 | ||||
| = Total compensation of employees | D1 | 19,389 | 18,996 | 18,594 | 18,344 | 18,898 | 19,354 | ||||
| - Compensation of employees of market establishments | D1_market | ||||||||||
| - Compensation related to production of own-use capital assets | D1_own-use | -58 | -38 | -33 | -33 | -21 | -21 | ||||
| + Non-market intermediate consumption | P2_nonmarket | 8,573 | 8,129 | 7,976 | 8,686 | 8,954 | 9,181 | ||||
| = Total intermediate consumption | P2 | 8,800 | 8,342 | 8,196 | 8,906 | 9,179 | 9,406 | ||||
| - Intermediate consumption of market establishments | P2_market | -227 | -212 | -219 | -219 | -225 | -225 | ||||
| - Intermediate consumption related to production of own-use capital assets | P2_own-use | ||||||||||
| + Non-market consumption of fixed capital | P51c_nonmarket | 2,665 | 2,721 | 2,778 | 2,914 | 3,102 | 3,304 | ||||
| = Total consumption of fixed capital | P51c | 3,049 | 3,111 | 3,175 | 3,330 | 3,526 | 3,738 | ||||
| - Consumption of fixed capital by market establishments | P51c_market | -384 | -390 | -397 | -416 | -424 | -434 | ||||
| - Consumption of fixed capital related to production of own-use capital assets | P51c_own-use | ||||||||||
| + Other taxes on production, payable | D29_pay | 0 | 0 | 0 | 0 | 0 | 0 | ||||
| - Other subsidies on production, receivable | D39_rec | 0 | 0 | 0 | 0 | 0 | 0 | ||||
| Table 4 General Government: detailed classification of expenditure and consumption | |||||||||||
| €million | |||||||||||
| Description | ESA2010 code | 2011 | 2012 | 2013 | 2014 | 2015 | 2016 | ||||
| Total Expenditure | TE | 79,622 | 73,603 | 72,533 | 73,042 | 75,572 | 74,553 | ||||
| Expense | 78,395 | 73,161 | 72,095 | 72,141 | 74,691 | 73,328 | |||||
| Compensation of employees | D1 | 19,389 | 18,996 | 18,594 | 18,344 | 18,898 | 19,354 | ||||
| Of which: Related to production of own-use capital assets | 58 | 38 | 33 | 33 | 21 | 21 | |||||
| Use of goods and services plus taxes payable | P2 + D5 + D29 | 8,801 | 8,343 | 8,196 | 8,906 | 9,179 | 9,406 | ||||
| Use of goods and services [Intermediate consumption] | P2 | 8,800 | 8,342 | 8,196 | 8,906 | 9,179 | 9,406 | ||||
| Of which: Intermediate consumption of market establishments | 227 | 212 | 219 | 219 | 225 | 225 | |||||
| Taxes, payable | D5 | 1 | 1 | 0 | 0 | 0 | 0 | ||||
| Depreciation (Consumption of fixed capital) | P51c | 3,049 | 3,111 | 3,175 | 3,330 | 3,526 | 3,738 | ||||
| Of which: Depreciation by market establishments | 384 | 390 | 397 | 416 | 424 | 434 | |||||
| Interest (excluding FISIM) | D41 | 5,768 | 7,298 | 7,774 | 7,604 | 6,858 | 6,187 | ||||
| Other domestic interest payable | D41_S1 | 1,419 | 2,677 | 3,136 | 2,914 | 2,461 | 2,279 | ||||
| Interest payable to rest of world | D41_S2 | 4,349 | 4,621 | 4,638 | 4,690 | 4,397 | 3,908 | ||||
| Subsidies | D3 | 1,725 | 1,910 | 1,906 | 1,863 | 1,766 | 1,674 | ||||
| Product subsidies | D31 | 1,060 | 1,063 | 1,071 | 957 | 882 | 847 | ||||
| Other subsidies on production | D39 | 665 | 847 | 835 | 906 | 884 | 827 | ||||
| Social benefits | D62 + D632 | 28,827 | 29,454 | 28,526 | 28,076 | 28,422 | 28,494 | ||||
| Social benefits in cash | D62 | 23,868 | 24,235 | 23,540 | 22,973 | 23,010 | 22,727 | ||||
| Social benefits in kind (via market producers) | D632 | 4,958 | 5,219 | 4,986 | 5,102 | 5,412 | 5,767 | ||||
| Other current transfers | D7 | 2,614 | 2,531 | 2,908 | 2,784 | 2,564 | 3,012 | ||||
| Net non-life insurance premiums | D71 | 47 | 77 | 58 | 74 | 79 | 79 | ||||
| Current international cooperation | D74 | 547 | 546 | 531 | 435 | 473 | 438 | ||||
| Miscellaneous current transfers | D75 | 870 | 718 | 764 | 793 | 505 | 644 | ||||
| VAT and GNI based EU budget contribution | D76 | 1,150 | 1,190 | 1,556 | 1,483 | 1,507 | 1,851 | ||||
| VAT-based EU own resources | D761 | 194 | 191 | 194 | 203 | 215 | 219 | ||||
| GNI-based EU own resources | D762 | 956 | 999 | 1,361 | 1,280 | 1,292 | 1,632 | ||||
| Capital transfers | D9 | 8,222 | 1,519 | 1,016 | 1,234 | 3,478 | 1,462 | ||||
| Investment grants | D92 | 1,101 | 1,239 | 978 | 1,041 | 1,367 | 1,462 | ||||
| Other capital transfers | D99 | 7,121 | 280 | 38 | 193 | 2,111 | 0 | ||||
| Net acquisition of non-financial assets | P5 + NP - P51c | 1,228 | 442 | 438 | 901 | 881 | 1,225 | ||||
| = Gross investment in non-financial assets | P5 + NP | 4,277 | 3,553 | 3,613 | 4,231 | 4,406 | 4,963 | ||||
| Gross fixed capital formation | P51 | 4,166 | 3,470 | 3,530 | 4,171 | 4,346 | 4,903 | ||||
| Net acquisition of stocks | P52 | 111 | 83 | 83 | 60 | 60 | 60 | ||||
| Net acquisition of unproduced assets | NP | 0 | 0 | 0 | 0 | 0 | 0 | ||||
| - Consumption of fixed capital | P51c | -3,049 | -3,111 | -3,175 | -3,330 | -3,526 | -3,738 | ||||
| Net expenditure on current goods and services | P3 excl. D632 | 26,370 | 25,745 | 25,471 | 26,244 | 26,953 | 28,354 | ||||
| = Output | P1 | 31,533 | 30,802 | 30,339 | 30,983 | 32,072 | 33,046 | ||||
| - Sales of goods and services | P11+P12+P131 | -5,163 | -5,057 | -4,868 | -4,739 | -5,119 | -4,692 | ||||
| Market output (sales of market establishments) | P11 | -905 | -956 | -991 | -1,039 | -1,117 | -1,208 | ||||
| Output for own final use | P12 | -58 | -38 | -33 | -33 | -21 | -21 | ||||
| Incidental sales and fees of non-market establishments | P131 | -4,200 | -4,063 | -3,845 | -3,666 | -3,981 | -3,464 | ||||
| Final consumption expenditure | P3 | 31,328 | 30,964 | 30,456 | 31,347 | 32,365 | 34,121 | ||||
| = Net expenditure on current goods and services | P3 excl. D632 | 26,370 | 25,745 | 25,471 | 26,244 | 26,953 | 28,354 | ||||
| + Social transfers in kind via market producers | D632 | 4,958 | 5,219 | 4,986 | 5,102 | 5,412 | 5,767 | ||||
| made up of | |||||||||||
| Individual consumption (= social transfers in kind) | P31 (= D63) | 20,634 | 20,487 | 20,424 | 21,160 | 21,773 | 22,955 | ||||
| Social transfers in kind (via market producers) | D632 | 4,958 | 5,219 | 4,986 | 5,102 | 5,412 | 5,767 | ||||
| Social transfers in kind (provided directly by government) | D631 | 15,676 | 15,268 | 15,438 | 16,058 | 16,361 | 17,188 | ||||
| Collective consumption (= actual final consumption of government) | P32 | 10,694 | 10,477 | 10,032 | 10,186 | 10,592 | 11,166 | ||||
| Total social transfers | D62 + D63 | 44,502 | 44,722 | 43,964 | 44,134 | 44,783 | 45,682 | ||||
| Social benefits in cash | D62 | 23,868 | 24,235 | 23,540 | 22,973 | 23,010 | 22,727 | ||||
| Social transfers in kind (= individual consumption) | D63 | 20,634 | 20,487 | 20,424 | 21,160 | 21,773 | 22,955 | ||||
| Table 5 General Government financial transactions | |||||||||||
| €million | |||||||||||
| Description | 2011 | 2012 | 2013 | 2014 | 2015 | 2016 | |||||
| Net lending (+) / net borrowing (-) | B.9 | -21,886 | -14,112 | -11,020 | -7,099 | -4,968 | -1,907 | ||||
| equals | |||||||||||
| Net acquisition of financial assets | ΔA | 3,770 | 5,640 | -5,676 | -18,871 | -7,489 | -4,207 | ||||
| EDP debt instruments | F2 + F3 + F4 | -436 | 4,105 | -4,322 | -19,597 | -7,222 | -4,305 | ||||
| Currency and deposits | F2 | -1,035 | 5,823 | -1,219 | -6,378 | -338 | -2,921 | ||||
| Debt securities | F3 | -648 | 957 | -757 | -1,429 | -5,834 | -1,133 | ||||
| Short-term | F31 | -36 | 1,034 | 2,697 | -1,373 | -1,184 | -1,034 | ||||
| Long-term | F32 | -612 | -77 | -3,454 | -56 | -4,650 | -99 | ||||
| Loans | F4 | 1,247 | -2,675 | -2,346 | -11,790 | -1,050 | -251 | ||||
| Short-term loans | F41 | 885 | 1,069 | 349 | -788 | -530 | -46 | ||||
| Long-term loans | F42 | 362 | -3,744 | -2,695 | -11,002 | -520 | -205 | ||||
| Equity and Investment Fund Shares | F5 | 3,703 | 1,826 | -1,307 | -91 | 240 | -385 | ||||
| Other financial assets | F6 + F7 + F8 | 503 | -291 | -47 | 817 | -507 | 483 | ||||
| Insurance, Pensions and Standardised Guarantees | F6 | 0 | -1 | 0 | 1 | -1 | 0 | ||||
| Financial derivatives and Employee Stock Options | F7 | -271 | -105 | 171 | 143 | -288 | 0 | ||||
| Other accounts receivable/payable | F8 | 774 | -185 | -218 | 673 | -218 | 483 | ||||
| less | |||||||||||
| Net incurrence of liabilities | ΔL | 25,656 | 19,752 | 5,344 | -11,772 | -2,521 | -2,300 | ||||
| EDP debt instruments | F2 + F3 + F4 | 25,302 | 19,662 | 5,501 | -12,559 | -2,831 | -2,057 | ||||
| Currency and deposits | F2 | 2,893 | 3,802 | -30,707 | -10,474 | -247 | 609 | ||||
| Debt securities | F3 | -8,650 | -7,427 | 26,178 | 6,068 | 7,378 | -2,600 | ||||
| Short-term | F31 | -3,460 | -1,234 | -172 | 1,327 | -2,409 | 1,046 | ||||
| Long-term | F32 | -5,190 | -6,193 | 26,350 | 4,741 | 9,787 | -3,646 | ||||
| Loans | F4 | 31,059 | 23,287 | 10,030 | -8,153 | -9,962 | -66 | ||||
| Short-term loans | F41 | -173 | 1,301 | -482 | -138 | -244 | -340 | ||||
| Long-term loans | F42 | 31,232 | 21,986 | 10,512 | -8,015 | -9,718 | 274 | ||||
| Other liabilities | F5 + F6 + F7 + F8 | 354 | 90 | -157 | 787 | 310 | -243 | ||||
| Equity and Investment Fund Shares | F5 | 0 | 0 | 0 | 0 | 0 | 0 | ||||
| Insurance, Pensions and Standardised Guarantees | F6 | 0 | 1 | -1 | 0 | 0 | 0 | ||||
| Financial derivatives and Employee Stock Options | F7 | 3 | 1 | -1 | -1 | -1 | 0 | ||||
| Other accounts receivable/payable | F8 | 351 | 88 | -155 | 788 | 311 | -243 | ||||
| Table 6 General Government: detailed breakdown of net worth | |||||||||||||
| €million | |||||||||||||
| Description | ESA2010 code | 2011 | 2012 | 2013 | 2014 | 2015 | 2016 | ||||||
| General Government balance sheet | |||||||||||||
| Net worth at market value, excluding pension liabilities | NW | -20,490 | -49,476 | -53,504 | -58,050 | -48,227 | -44,025 | ||||||
| equals | |||||||||||||
| Non-financial assets at market value | NFA | 85,016 | 87,371 | 90,081 | 95,053 | 100,877 | 107,059 | ||||||
| plus | |||||||||||||
| Financial net worth at market value, excluding pension liabilities | FNW | -105,506 | -136,847 | -143,585 | -153,103 | -149,104 | -151,084 | ||||||
| equals | |||||||||||||
| Financial assets at market value | FA | 88,214 | 92,609 | 94,292 | 84,008 | 84,294 | 79,839 | ||||||
| EDP debt instruments | F2 + F3 + F4 | 54,631 | 57,905 | 53,837 | 36,120 | 29,076 | 24,975 | ||||||
| Currency and deposits | F2 | 18,868 | 24,852 | 23,631 | 17,323 | 17,207 | 14,286 | ||||||
| Debt securities | F3 | 7,919 | 9,470 | 10,249 | 9,646 | 3,289 | 2,162 | ||||||
| Short-term | F31 | 13 | 1,046 | 3,744 | 2,369 | 1,184 | 143 | ||||||
| Long-term | F32 | 7,907 | 8,424 | 6,505 | 7,277 | 2,104 | 2,019 | ||||||
| Loans | F4 | 27,844 | 23,583 | 19,957 | 9,151 | 8,580 | 8,527 | ||||||
| Short-term loans | F41 | 885 | 1,954 | 2,303 | 1,516 | 986 | 939 | ||||||
| Long-term loans | F42 | 26,959 | 21,629 | 17,653 | 7,635 | 7,594 | 7,588 | ||||||
| Equity and Investment Fund Shares | F5 | 22,975 | 25,098 | 30,795 | 38,201 | 45,260 | 45,230 | ||||||
| Other financial assets | F6 + F7 + F8 | 10,608 | 9,606 | 9,660 | 9,687 | 9,958 | 9,634 | ||||||
| Insurance, Pensions and Standardised Guarantees | F6 | 1 | 0 | 0 | 1 | 0 | 0 | ||||||
| Financial derivatives and Employee Stock Options | F7 | 1,694 | 897 | 1,135 | 352 | 811 | 2 | ||||||
| Other accounts receivable/payable | F8 | 8,913 | 8,709 | 8,525 | 9,334 | 9,147 | 9,632 | ||||||
| less | |||||||||||||
| Liabilities at market value | L | 193,720 | 229,456 | 237,877 | 237,111 | 233,398 | 230,923 | ||||||
| EDP debt instruments | F2 + F3 + F4 | 182,594 | 218,412 | 228,858 | 227,779 | 223,144 | 221,003 | ||||||
| Currency and deposits | F2 | 58,388 | 62,099 | 31,356 | 20,918 | 20,713 | 21,315 | ||||||
| Debt securities | F3 | 85,192 | 94,161 | 126,146 | 141,988 | 146,317 | 144,254 | ||||||
| Short-term | F31 | 3,795 | 2,566 | 2,391 | 3,763 | 1,386 | 2,400 | ||||||
| Long-term | F32 | 81,397 | 91,595 | 123,755 | 138,225 | 144,931 | 141,853 | ||||||
| Loans | F4 | 39,014 | 62,152 | 71,356 | 64,873 | 56,114 | 55,434 | ||||||
| Short-term loans | F41 | 558 | 1,884 | 1,440 | 1,290 | 1,029 | 683 | ||||||
| Long-term loans | F42 | 38,456 | 60,268 | 69,917 | 63,583 | 55,085 | 54,751 | ||||||
| Other liabilities | F5 + F6 + F7 + F8 | 11,126 | 11,044 | 9,019 | 9,332 | 10,254 | 9,920 | ||||||
| Equity and Investment Fund Shares | F5 | 0 | 0 | 0 | 0 | 0 | 0 | ||||||
| Insurance, Pensions and Standardised Guarantees | F6 | 0 | 1 | 0 | 0 | 0 | 0 | ||||||
| Financial derivatives and Employee Stock Options | F7 | 2,974 | 2,802 | 932 | 457 | 1,067 | 976 | ||||||
| Other accounts receivable/payable | F8 | 8,152 | 8,241 | 8,087 | 8,875 | 9,187 | 8,944 | ||||||
| Memo: Estimated pension liabilities of government | 116,000 | 98,000 | 98,000 | 98,000 | 98,000 | 98,000 | |||||||
| Memo: Net worth, including pension liabilities | -136,490 | -147,476 | -151,504 | -156,050 | -146,227 | -142,025 | |||||||
| Contingent liabilities | 141,994 | 118,926 | 59,522 | 29,412 | 17,255 | 10,325 | |||||||
| Guarantees | 138,723 | 115,555 | 56,020 | 25,145 | 12,604 | 5,273 | |||||||
| Off-balance sheet PPPs and concessions | 3,271 | 3,371 | 3,502 | 4,266 | 4,651 | 5,052 | |||||||
| Memo: Net worth, including pension liabilities and contingent liabilities | -278,484 | -266,402 | -211,026 | -185,462 | -163,482 | -152,350 | |||||||
| Change in net worth of government | |||||||||||||
| Opening net worth | 6,378 | -20,490 | -49,476 | -53,504 | -58,050 | -48,227 | |||||||
| Change in net worth due to transactions | -20,658 | -13,670 | -10,581 | -6,197 | -4,088 | -683 | |||||||
| Net acquisition of non-financial assets | P5 + NP - P51c | 1,228 | 442 | 438 | 901 | 881 | 1,225 | ||||||
| Net lending/net borrowing | B9 | -21,886 | -14,112 | -11,020 | -7,099 | -4,968 | -1,907 | ||||||
| = Net acquisition of financial assets | 3,770 | 5,640 | -5,676 | -18,871 | -7,489 | -4,207 | |||||||
| - Net incurrence of liabilities | -25,656 | -19,752 | -5,344 | 11,772 | 2,521 | 2,300 | |||||||
| Change in net worth due to other economic flows | Kx | -6,210 | -15,316 | 6,554 | 1,651 | 13,911 | 4,884 | ||||||
| Other changes in non-financial assets | -604 | 1,913 | 2,272 | 4,070 | 4,944 | 4,957 | |||||||
| Other changes in financial net worth | -5,606 | -17,229 | 4,282 | -2,419 | 8,967 | -73 | |||||||
| = Other changes in financial assets | 22,385 | -1,245 | 7,359 | 8,587 | 7,775 | -248 | |||||||
| EDP debt instruments | 21,723 | -831 | 254 | 1,880 | 178 | 204 | |||||||
| Equity and Investment Fund Shares | -858 | 297 | 7,004 | 7,497 | 6,819 | 355 | |||||||
| Other financial assets | 1,520 | -711 | 101 | -790 | 778 | -807 | |||||||
| - Other changes in liabilities | -27,991 | -15,984 | -3,077 | -11,006 | 1,192 | 175 | |||||||
| EDP debt instruments | -24,916 | -16,156 | -4,945 | -11,480 | 1,804 | 84 | |||||||
| Other liabilities | -3,075 | 172 | 1,868 | 474 | -612 | 91 | |||||||
| Closing net worth | -20,490 | -49,476 | -53,504 | -58,050 | -48,227 | -44,025 | |||||||
| Table 7 General Government Gross and Net Debt | ||||||||||
| €million | ||||||||||
| Description | ESA2010 code | 2011 | 2012 | 2013 | 2014 | 2015 | 2016 | |||
| General Government Debt | ||||||||||
| Debt instrument liabilities at market value | 182,594 | 218,412 | 228,858 | 227,779 | 223,144 | 221,003 | ||||
| + Difference between face value and market value | 7,131 | -8,396 | -13,562 | -24,453 | -21,555 | -20,411 | ||||
| Gross General Government Debt (face value) | GGDebt | 189,725 | 210,016 | 215,296 | 203,326 | 201,589 | 200,592 | |||
| By category: | ||||||||||
| Currency and deposits | F2 | 58,386 | 62,092 | 31,356 | 20,918 | 20,713 | 21,315 | |||
| Debt securities | F3 | 94,031 | 87,326 | 112,665 | 119,078 | 125,763 | 124,148 | |||
| Short-term | F31 | 3,794 | 2,564 | 2,389 | 3,760 | 1,380 | 2,395 | |||
| Long-term | F32 | 90,236 | 84,762 | 110,276 | 115,318 | 124,383 | 121,752 | |||
| Loans | F4 | 37,308 | 60,597 | 71,275 | 63,330 | 55,113 | 55,129 | |||
| Short-term | F41 | 558 | 1,884 | 1,440 | 1,290 | 1,026 | 681 | |||
| Long-term | F42 | 36,750 | 58,713 | 69,836 | 62,040 | 54,087 | 54,448 | |||
| less EDP debt instrument assets | F2 + F3 + F4 | 54,632 | 57,905 | 53,836 | 36,120 | 29,075 | 24,975 | |||
| By category: | ||||||||||
| Currency and deposits | F2 | 18,868 | 24,852 | 23,631 | 17,323 | 17,207 | 14,286 | |||
| Debt securities | F3 | 7,920 | 9,470 | 10,249 | 9,646 | 3,288 | 2,162 | |||
| Short-term | F31 | 13 | 1,046 | 3,744 | 2,369 | 1,184 | 143 | |||
| Long-term | F32 | 7,907 | 8,424 | 6,505 | 7,277 | 2,104 | 2,019 | |||
| Loans | F4 | 27,844 | 23,583 | 19,956 | 9,151 | 8,580 | 8,527 | |||
| Short-term | F41 | 885 | 1,954 | 2,303 | 1,516 | 986 | 939 | |||
| Long-term | F42 | 26,959 | 21,629 | 17,653 | 7,635 | 7,594 | 7,588 | |||
| Net General Government Debt (face value) | GGNetDebt | 135,093 | 152,111 | 161,460 | 167,206 | 172,514 | 175,617 | |||
| By category: | ||||||||||
| Currency and deposits | F2 | 39,518 | 37,240 | 7,725 | 3,595 | 3,506 | 7,029 | |||
| Debt securities | F3 | 86,111 | 77,856 | 102,416 | 109,432 | 122,475 | 121,986 | |||
| Short-term | F31 | 3,781 | 1,518 | -1,355 | 1,391 | 196 | 2,252 | |||
| Long-term | F32 | 82,329 | 76,338 | 103,771 | 108,041 | 122,279 | 119,733 | |||
| Loans | F4 | 9,464 | 37,014 | 51,319 | 54,179 | 46,533 | 46,602 | |||
| Short-term | F41 | -327 | -70 | -863 | -226 | 40 | -258 | |||
| Long-term | F42 | 9,791 | 37,084 | 52,183 | 54,405 | 46,493 | 46,860 | |||
| Table 8 Reconciliation of Exchequer Balance to General Government Deficit | ||||||
| € million | ||||||
| Description | ESA2010 code | 2013 | 2014 | 2015 | 2016 | |
| Exchequer balance | -11,503 | -8,189 | -64 | -1,012 | ||
| Deduct cash inflows which do not increase financial net worth | -2,682 | -4,287 | -9,149 | -4,042 | ||
| Inflows from sale or redemption of financial assets | -2,678 | -4,274 | -9,139 | -4,037 | ||
| Incurrence of Exchequer liability to Central Bank for notes and coins in circulation | -5 | -13 | -10 | -5 | ||
| Exclude cash outflows which do not reduce financial net worth | 2,316 | 4,612 | 4,911 | 1,572 | ||
| Acquisition of financial assets | 2,303 | 4,599 | 4,676 | 1,572 | ||
| Repayment of promissory notes notional loan principal | 13 | 13 | 234 | 0 | ||
| Redemption of Exchequer liability to Central Bank for notes and coins in circulation | 0 | 0 | 0 | 0 | ||
| Impact on financial net worth of Exchequer cash transactions | -11,870 | -7,863 | -4,302 | -3,482 | ||
| Adjust for impact of non-cash revenue and disposals of non-financial asset (+) | 115 | 490 | 202 | 597 | ||
| Difference between Exchequer cash tax revenue and time-adjusted Revenue Net Receipts | 161 | 473 | 227 | 491 | ||
| Receipts due from EU (Agriculture grants, Cohesion Fund, ESF and ERDF) | -41 | -87 | -134 | 104 | ||
| Accrual of interest due on contingent capital assets assigned to banks | -45 | 0 | 10 | -69 | ||
| Licence sales | 40 | 103 | 98 | 71 | ||
| Other accrued revenue | 0 | 0 | 0 | 0 | ||
| Adjust for impact of non-cash expenditure (-) | 46 | -239 | 237 | 651 | ||
| Capital transfers to financial institutions financed by promissory notes | 12 | 12 | 16 | 459 | ||
| Difference between interest paid and accrued | -60 | 60 | 148 | 516 | ||
| Difference between Exchequer cash issues and accrued net spending of departments and offices | -4 | 198 | -137 | -300 | ||
| Other accrued expenditure | 98 | -509 | 210 | -23 | ||
| Surplus/Deficit of Exchequer | B9_exchequer | -11,708 | -7,612 | -3,864 | -2,234 | |
| Surplus/Deficit of extra-budgetary bodies, funds and accounts consolidated with Exchequer | -136 | 148 | 133 | -130 | ||
| Social Insurance Fund | -11 | 83 | 72 | 63 | ||
| Bank & Deposit Guarantee Schemes | -191 | -12 | -19 | -242 | ||
| Capital Services Redemption Account | 0 | 0 | 0 | 0 | ||
| Small Savings Reserve Fund | 0 | 0 | 0 | 0 | ||
| Other Extra-Budgetary Funds | 55 | 17 | 166 | 25 | ||
| Health Service Executive | 11 | 60 | -86 | 25 | ||
| Surplus/Deficit of Budgetary Central Government | B9_bcg | -11,844 | -7,464 | -3,731 | -2,363 | |
| Surplus/Deficit of other Central Government bodies | 834 | 262 | -1,816 | 191 | ||
| National Pensions Reserve Fund | 431 | 221 | 640 | 63 | ||
| Non-market State corporations and agencies | 369 | 38 | -348 | 128 | ||
| Voluntary and joint board hospitals | 34 | 4 | 3 | 0 | ||
| Other adjustments | 0 | 0 | -2,111 | 0 | ||
| Conversion of AIB Preference shares into Ordinary shares | 0 | 0 | -2,111 | 0 | ||
| Surplus/Deficit of Central Government | B9_S1311 | -11,011 | -7,202 | -5,547 | -2,172 | |
| Surplus/Deficit of Local Government | B9_S1313 | -9 | 103 | 578 | 265 | |
| Surplus/Deficit of General Government | B9_S13 | -11,020 | -7,099 | -4,968 | -1,907 | |
| Table 9 Reconciliation of National Debt to General Government Debt | |||||||||||
| € million | |||||||||||
| Description | 2011 | 2012 | 2013 | 2014 | 2015 | 2016 | |||||
| Audited National Debt | 119,082 | 137,632 | 173,947 | 182,310 | 183,066 | 185,604 | |||||
| Composed of | |||||||||||
| Gross National Debt | 136,774 | 161,482 | 197,547 | 197,069 | 196,620 | 196,723 | |||||
| Medium/long term debt | 119,625 | 144,524 | 178,722 | 176,011 | 175,974 | 173,620 | |||||
| Irish Government Bonds | 85,912 | 88,455 | 111,609 | 116,941 | 125,688 | 122,347 | |||||
| EU/IMF Programme Funding | 33,676 | 53,200 | 61,350 | 54,478 | 45,183 | 45,722 | |||||
| EIB and bilateral loans | 483 | 3,071 | 4,971 | 5,463 | 5,958 | 5,760 | |||||
| Miscellaneous (including derivatives) | -445 | -202 | 792 | -871 | -854 | -209 | |||||
| Short term debt | 5,603 | 3,476 | 3,320 | 4,672 | 3,953 | 5,916 | |||||
| Commercial Paper | 348 | 1,299 | 482 | 2,254 | 1,046 | 363 | |||||
| Treasury Bills | 0 | 1,014 | 0 | 500 | 0 | 1,008 | |||||
| Borrowings from Funds under the control of the Minister for Finance | 1,696 | 786 | 676 | 523 | 1,579 | 2,519 | |||||
| Miscellaneous (including EFSF interim funding in 2011) | 3,559 | 377 | 2,163 | 1,395 | 1,327 | 2,025 | |||||
| State Savings Schemes | 11,546 | 13,482 | 15,505 | 16,386 | 16,692 | 17,187 | |||||
| Less Liquid assets | -17,692 | -23,850 | -23,601 | -14,759 | -13,554 | -11,119 | |||||
| Reverse deduction of liquid assets and EFSF prepaid margin held by Exchequer | 18,222 | 24,380 | 24,131 | 15,289 | 14,084 | 11,119 | |||||
| Outstanding principal value of promissory notes | 28,333 | 25,261 | 215 | 201 | 0 | 0 | |||||
| Liability for coinage in circulation | 694 | 670 | 675 | 693 | 701 | 707 | |||||
| Accrual adjustments (Small Savings Reserve Fund) | 464 | 548 | 604 | 599 | 504 | 451 | |||||
| Adjustment from discounted to nominal value | 4 | 6 | 4 | 2 | 8 | -2 | |||||
| National Loans Advance Interest | 12 | 12 | 5 | 49 | 24 | 29 | |||||
| Gross treatment of collaterals | 170 | 1,431 | 948 | 1,004 | 783 | 522 | |||||
| Other adjustments (repurchase agreements, OPW contracts and exclusion of financial derivatives) | -17 | 9 | 48 | 38 | 26 | 20 | |||||
| Unconsolidated Exchequer Debt (Maastricht definition) | 166,963 | 189,950 | 200,575 | 200,185 | 199,196 | 198,449 | |||||
| of which: Liabilities to other Central Government bodies | 2,615 | 2,301 | 2,316 | 2,529 | 3,372 | 3,987 | |||||
| Exchequer contribution to Central Government debt | 164,348 | 187,649 | 198,259 | 197,656 | 195,824 | 194,463 | |||||
| of which: Liabilities to Local Government | 19 | 30 | 29 | 22 | 0 | 0 | |||||
| Exchequer contribution to General Government debt | 164,329 | 187,619 | 198,230 | 197,634 | 195,824 | 194,463 | |||||
| Housing Finance Agency (HFA) | |||||||||||
| Gross debt of HFA | 4,414 | 4,501 | 4,423 | 4,209 | 3,615 | 3,612 | |||||
| of which: Liabilities to other Central Government bodies | 3,851 | 3,987 | 3,711 | 3,152 | 2,427 | 2,056 | |||||
| HFA contribution to Central Government debt | 563 | 514 | 712 | 1,057 | 1,189 | 1,556 | |||||
| of which: Liabilities to Local Authorities | 179 | 119 | 286 | 644 | 965 | 1,295 | |||||
| HFA contribution to General Government debt | 384 | 394 | 427 | 413 | 224 | 261 | |||||
| Other Central Government | |||||||||||
| IBRC Consolidated | 20,927 | 17,797 | 12,660 | 1,237 | 735 | 698 | |||||
| Liabilities of Post Office Savings Bank Fund to Post Office Savings Bank | 2,506 | 2,774 | 2,646 | 2,672 | 2,765 | 2,919 | |||||
| Health Service Executive and Voluntary Hospitals | 149 | 138 | 148 | 158 | 127 | 127 | |||||
| National Oil Reserves Agency | 327 | 258 | 166 | 111 | 63 | 15 | |||||
| Irish Rail | 17 | 25 | 8 | 2 | 0 | 0 | |||||
| Westlink buyout: imputed loan from National Toll Roads to National Roads Authority | 410 | 360 | 310 | 260 | 221 | 171 | |||||
| All other bodies | 43 | 35 | 57 | 243 | 1,018 | 1,263 | |||||
| Other bodies' contribution to Central and General Government debt | 24,378 | 21,387 | 15,995 | 4,684 | 4,929 | 5,194 | |||||
| Total Central Government debt | 189,288 | 209,550 | 214,966 | 203,397 | 201,941 | 201,213 | |||||
| of which: Liabilities to Local Government | 197 | 149 | 314 | 666 | 965 | 1,295 | |||||
| Central Government contribution to General Government debt | 189,091 | 209,401 | 214,652 | 202,731 | 200,977 | 199,918 | |||||
| Local Government - Local Authorities | |||||||||||
| Borrowing from Housing Finance Agency | 4,358 | 4,431 | 4,306 | 4,153 | 3,577 | 3,466 | |||||
| Borrowing from other Central Government bodies | 62 | 61 | 77 | 271 | 70 | 28 | |||||
| Other borrowing | 634 | 614 | 537 | 596 | 611 | 674 | |||||
| Local Authorities' contribution to Local Government debt | 5,054 | 5,106 | 4,920 | 5,020 | 4,258 | 4,169 | |||||
| VECs / ETBs | 0 | 0 | 0 | 0 | 0 | 0 | |||||
| Total Local Government debt | 5,054 | 5,106 | 4,920 | 5,020 | 4,258 | 4,169 | |||||
| of which: Liabilities to Central Government | 4,420 | 4,492 | 4,276 | 4,424 | 3,647 | 3,495 | |||||
| Local Government contribution to General Government debt | 634 | 614 | 644 | 596 | 611 | 674 | |||||
| General Government Debt | 189,725 | 210,015 | 215,296 | 203,326 | 201,588 | 200,592 | |||||
| Table 10 Central Government transactions: revenue, expenditure, financing and deficit | ||||||||||
| €million | ||||||||||
| Description | ESA2010 code | 2011 | 2012 | 2013 | 2014 | 2015 | 2016 | |||
| Central Government transactions | ||||||||||
| Revenue | TR | 54,179 | 55,847 | 58,058 | 62,625 | 67,289 | 69,365 | |||
| Taxes and social contributions | D2 + D5 + D91 + D61 | 47,554 | 49,008 | 51,193 | 55,749 | 60,582 | 63,553 | |||
| Taxes | D2 + D5 + D91 | 37,518 | 39,462 | 41,109 | 45,064 | 49,439 | 51,758 | |||
| Social contributions | D61 | 10,036 | 9,545 | 10,083 | 10,685 | 11,144 | 11,795 | |||
| Sales of goods and services | P1O | 3,573 | 3,479 | 3,318 | 3,363 | 3,672 | 3,154 | |||
| Investment income | D4 | 2,470 | 3,065 | 3,322 | 3,098 | 2,724 | 1,835 | |||
| Current transfer revenue (excluding taxes) | D7 | 218 | 211 | 124 | 241 | 255 | 194 | |||
| Capital transfer revenue (excluding taxes) | D9N | 364 | 83 | 102 | 173 | 56 | 629 | |||
| Expenditure | TE | 75,909 | 69,865 | 69,069 | 69,826 | 72,835 | 71,537 | |||
| Expense | Expense | 75,014 | 69,050 | 67,993 | 67,900 | 71,085 | 69,236 | |||
| Compensation of employees | D1 | 17,204 | 16,849 | 16,568 | 16,790 | 17,407 | 17,827 | |||
| Use of goods and services plus taxes payable | P2 + D5 + D29 | 6,777 | 6,464 | 6,796 | 7,205 | 7,497 | 7,796 | |||
| Depreciation (Consumption of fixed capital) | P51c | 1,266 | 1,301 | 1,342 | 1,636 | 1,769 | 1,905 | |||
| Interest (excluding FISIM) | D41 | 5,746 | 7,275 | 7,752 | 7,591 | 6,843 | 6,172 | |||
| Subsidies | D3 | 1,725 | 1,910 | 1,906 | 1,863 | 1,766 | 1,674 | |||
| Social benefits | D62 + D632 | 27,354 | 27,904 | 27,057 | 26,834 | 27,077 | 27,072 | |||
| Other current transfers | D7 | 5,058 | 4,743 | 4,661 | 4,337 | 4,166 | 4,665 | |||
| Capital transfers | D9 | 9,885 | 2,604 | 1,913 | 1,644 | 4,561 | 2,126 | |||
| Net operating balance | NOB | -20,835 | -13,203 | -9,935 | -5,276 | -3,795 | 129 | |||
| Net acquisition of non-financial assets | P5 + NP - P51c | 895 | 814 | 1,076 | 1,926 | 1,750 | 2,301 | |||
| Central Government Surplus/Deficit | B9 | -21,730 | -14,017 | -11,012 | -7,202 | -5,545 | -2,172 | |||
| Table 11 Central Government: detailed classification of revenue and output | |||||||||||
| €million | |||||||||||
| Description | ESA2010 code | 2011 | 2012 | 2013 | 2014 | 2015 | 2016 | ||||
| Total Revenue | TR | 54,179 | 55,847 | 58,058 | 62,625 | 67,289 | 69,365 | ||||
| Taxes and social contributions | 47,554 | 49,008 | 51,193 | 55,749 | 60,582 | 63,553 | |||||
| Taxes | D2 + D5 + D91 | 37,518 | 39,462 | 41,109 | 45,064 | 49,439 | 51,758 | ||||
| Indirect taxes (taxes on production and imports) | D2 | 16,437 | 16,881 | 17,895 | 19,807 | 21,178 | 22,261 | ||||
| Taxes on products | D21 | 15,705 | 16,099 | 16,749 | 18,237 | 19,441 | 20,773 | ||||
| of which Value-Added Tax | D211 | 9,755 | 10,219 | 10,372 | 11,521 | 11,955 | 12,826 | ||||
| Other taxes on production | D29 | 732 | 781 | 1,147 | 1,571 | 1,737 | 1,488 | ||||
| Direct taxes | D5 | 20,842 | 22,300 | 22,935 | 24,898 | 27,860 | 29,087 | ||||
| Taxes on income, profits and capital gains | D51 | 19,435 | 20,837 | 21,298 | 23,016 | 26,588 | 28,039 | ||||
| Other current direct taxes | D59 | 1,407 | 1,463 | 1,637 | 1,882 | 1,272 | 1,047 | ||||
| Capital taxes | D91 | 239 | 282 | 278 | 359 | 401 | 411 | ||||
| Social contributions | D61 | 10,036 | 9,545 | 10,083 | 10,685 | 11,144 | 11,795 | ||||
| Actual social contributions | D611 + D613 | 8,839 | 8,292 | 8,821 | 9,464 | 10,081 | 10,647 | ||||
| PRSI receipts | D611 + D613(pt) | 7,268 | 6,799 | 7,299 | 7,947 | 8,512 | 9,226 | ||||
| Government employees' social contributions | D613(pt) | 1,571 | 1,493 | 1,523 | 1,517 | 1,568 | 1,421 | ||||
| Employers' imputed social contributions | D612 | 1,197 | 1,253 | 1,262 | 1,221 | 1,063 | 1,147 | ||||
| Sales of goods and services | P1O | 3,573 | 3,479 | 3,318 | 3,363 | 3,672 | 3,154 | ||||
| Sales of market establishments (= market output) | P11 | 0 | 0 | 0 | 0 | 0 | 0 | ||||
| Imputed sales related to production of own-use capital assets (= output for own final use) | P12 | 58 | 38 | 33 | 33 | 21 | 21 | ||||
| Incidental sales and fees of non-market establishments | P131 | 3,515 | 3,441 | 3,285 | 3,330 | 3,651 | 3,134 | ||||
| Investment income | D4 | 2,470 | 3,065 | 3,322 | 3,098 | 2,724 | 1,835 | ||||
| Interest (excluding FISIM) | D41 | 1,366 | 1,606 | 1,447 | 1,072 | 678 | 254 | ||||
| of which received from local government | D41_LG | 118 | 97 | 99 | 71 | 50 | 50 | ||||
| Dividends | D42 | 1,077 | 1,428 | 1,772 | 1,923 | 1,942 | 1,478 | ||||
| Rent of land and subsoil assets | D45 | 28 | 31 | 103 | 103 | 103 | 103 | ||||
| Current transfer revenue | D39 + D7 | 218 | 211 | 124 | 241 | 255 | 194 | ||||
| Subsidies | D39 | 0 | 0 | 0 | 0 | 0 | 0 | ||||
| Other current transfers | D7 | 218 | 211 | 124 | 241 | 255 | 194 | ||||
| Non-life insurance claims | D72 | 13 | 8 | 9 | 7 | 6 | 6 | ||||
| Grants from local government | D73 | 3 | 3 | 3 | 3 | 3 | 3 | ||||
| Other Domestic - Current | D7N_S1 | 158 | 155 | 102 | 196 | 153 | 153 | ||||
| From Rest of World - Current | D7N_S2 | 45 | 46 | 11 | 36 | 93 | 32 | ||||
| Capital transfer revenue | D9N | 364 | 83 | 102 | 173 | 56 | 629 | ||||
| Output | P1 | 25,245 | 24,613 | 24,705 | 25,631 | 26,673 | 27,526 | ||||
| Market output (sales of market establishments) | P11 | 0 | 0 | 0 | 0 | 0 | 0 | ||||
| Output for own final use | P12 | 58 | 38 | 33 | 33 | 21 | 21 | ||||
| Non-market output | P13 | 25,187 | 24,575 | 24,672 | 25,598 | 26,653 | 27,505 | ||||
| = Non-market compensation of employees | D1_nonmarket | 17,146 | 16,811 | 16,535 | 16,757 | 17,386 | 17,805 | ||||
| = Total compensation of employees | D1 | 17,204 | 16,849 | 16,568 | 16,790 | 17,407 | 17,827 | ||||
| - Compensation of employees of market establishments | D1_market | 0 | 0 | 0 | 0 | 0 | -1 | ||||
| - Compensation related to production of own-use capital assets | D1_own-use | -58 | -38 | -33 | -33 | -21 | -21 | ||||
| + Non-market intermediate consumption | P2_nonmarket | 6,775 | 6,463 | 6,796 | 7,205 | 7,497 | 7,796 | ||||
| = Total intermediate consumption | P2 | 6,775 | 6,463 | 6,796 | 7,205 | 7,497 | 7,796 | ||||
| - Intermediate consumption of market establishments | P2_market | 0 | 0 | 0 | 0 | 0 | 0 | ||||
| - Intermediate consumption related to production of own-use capital assets | P2_own-use | 0 | 0 | 0 | 0 | 0 | 0 | ||||
| + Non-market consumption of fixed capital | P51c_nonmarket | 1,266 | 1,301 | 1,342 | 1,636 | 1,769 | 1,905 | ||||
| = Total consumption of fixed capital | P51c | 1,266 | 1,301 | 1,342 | 1,636 | 1,769 | 1,905 | ||||
| - Consumption of fixed capital by market establishments | P51c_market | 0 | 0 | 0 | 0 | 0 | 0 | ||||
| - Consumption of fixed capital related to production of own-use capital assets | P51c_own-use | 0 | 0 | 0 | 0 | 0 | 0 | ||||
| + Other taxes on production, payable | D29_pay | 0 | 0 | 0 | 0 | 0 | 0 | ||||
| - Other subsidies on production, receivable | D39_rec | 0 | 0 | 0 | 0 | 0 | 0 | ||||
| Table 12 Central Government: detailed classification of expenditure and consumption | |||||||||||
| €million | |||||||||||
| Description | ESA2010 code | 2011 | 2012 | 2013 | 2014 | 2015 | 2016 | ||||
| Total Expenditure | TE | 75,909 | 69,865 | 69,069 | 69,826 | 72,835 | 71,537 | ||||
| Expense | 75,014 | 69,050 | 67,993 | 67,900 | 71,085 | 69,236 | |||||
| Compensation of employees | D1 | 17,204 | 16,849 | 16,568 | 16,790 | 17,407 | 17,827 | ||||
| Of which: Related to production of own-use capital assets | 58 | 38 | 33 | 33 | 21 | 21 | |||||
| Use of goods and services plus taxes payable | P2 + D5 + D29 | 6,777 | 6,464 | 6,796 | 7,205 | 7,497 | 7,796 | ||||
| Use of goods and services [Intermediate consumption] | P2 | 6,775 | 6,463 | 6,796 | 7,205 | 7,497 | 7,796 | ||||
| Of which: Intermediate consumption of market establishments | 0 | 0 | 0 | 0 | 0 | 0 | |||||
| Taxes, payable | D5 | 1 | 1 | 0 | 0 | 0 | 0 | ||||
| Depreciation (Consumption of fixed capital) | P51c | 1,266 | 1,301 | 1,342 | 1,636 | 1,769 | 1,905 | ||||
| Of which: Depreciation by market establishments | 0 | 0 | 0 | 0 | 0 | 0 | |||||
| Interest (excluding FISIM) | D41 | 5,746 | 7,275 | 7,752 | 7,591 | 6,843 | 6,172 | ||||
| Other domestic interest payable | D41_S1 | 1,397 | 2,654 | 3,114 | 2,900 | 2,446 | 2,264 | ||||
| Interest payable to rest of world | D41_S2 | 4,349 | 4,621 | 4,638 | 4,690 | 4,397 | 3,908 | ||||
| Subsidies | D3 | 1,725 | 1,910 | 1,906 | 1,863 | 1,766 | 1,674 | ||||
| Product subsidies | D31 | 1,060 | 1,063 | 1,071 | 957 | 882 | 847 | ||||
| Other subsidies on production | D39 | 665 | 847 | 835 | 906 | 884 | 827 | ||||
| Social benefits | D62 + D632 | 27,354 | 27,904 | 27,057 | 26,834 | 27,077 | 27,072 | ||||
| Social benefits in cash | D62 | 23,099 | 23,456 | 22,885 | 22,608 | 22,644 | 22,415 | ||||
| Social benefits in kind (via market producers) | D632 | 4,255 | 4,448 | 4,172 | 4,226 | 4,433 | 4,657 | ||||
| Other current transfers | D7 | 5,058 | 4,743 | 4,661 | 4,337 | 4,166 | 4,665 | ||||
| Net non-life insurance premiums | D71 | 47 | 77 | 58 | 74 | 79 | 79 | ||||
| Current grants to local government | D73 _LG | 2,490 | 2,257 | 1,798 | 1,600 | 1,649 | 1,699 | ||||
| Current international cooperation | D74 | 547 | 546 | 531 | 435 | 473 | 438 | ||||
| Miscellaneous current transfers | D75 | 824 | 673 | 719 | 746 | 458 | 597 | ||||
| VAT and GNI based EU budget contribution | D76 | 1,150 | 1,190 | 1,556 | 1,483 | 1,507 | 1,851 | ||||
| VAT-based EU own resources | D761 | 194 | 191 | 194 | 203 | 215 | 219 | ||||
| GNI-based EU own resources | D762 | 956 | 999 | 1,361 | 1,280 | 1,292 | 1,632 | ||||
| Capital transfers | D9 | 9,885 | 2,604 | 1,913 | 1,644 | 4,561 | 2,126 | ||||
| Capital grants to local government | D9_LG | 1,851 | 1,357 | 1,132 | 641 | 1,300 | 881 | ||||
| Investment grants | D92 | 913 | 966 | 743 | 810 | 1,150 | 1,245 | ||||
| Other capital transfers | D99 | 7,121 | 280 | 38 | 193 | 2,111 | 0 | ||||
| Net acquisition of non-financial assets | P5 + NP - P51c | 895 | 814 | 1,076 | 1,926 | 1,750 | 2,301 | ||||
| = Gross investment in non-financial assets | P5 + NP | 2,161 | 2,116 | 2,418 | 3,562 | 3,519 | 4,205 | ||||
| Gross fixed capital formation | P51 | 2,050 | 2,033 | 2,335 | 3,502 | 3,519 | 4,145 | ||||
| Net acquisition of stocks | P52 | 111 | 83 | 83 | 60 | 60 | 60 | ||||
| Net acquisition of unproduced assets | NP | 0 | 0 | 0 | 0 | -60 | 0 | ||||
| - Consumption of fixed capital | P51c | -1,266 | -1,301 | -1,342 | -1,636 | -1,769 | -1,905 | ||||
| Net expenditure on current goods and services | P3 excl. D632 | 21,672 | 21,134 | 21,387 | 22,268 | 23,001 | 24,371 | ||||
| = Output | P1 | 25,245 | 24,613 | 24,705 | 25,631 | 26,673 | 27,526 | ||||
| - Sales of goods and services | P11+P12+P131 | -3,573 | -3,479 | -3,318 | -3,363 | -3,672 | -3,154 | ||||
| Market output (sales of market establishments) | P11 | 0 | 0 | 0 | 0 | 0 | 0 | ||||
| Output for own final use | P12 | -58 | -38 | -33 | -33 | -21 | -21 | ||||
| Incidental sales and fees of non-market establishments | P131 | -3,515 | -3,441 | -3,285 | -3,330 | -3,651 | -3,134 | ||||
| Final consumption expenditure | P3 | 25,927 | 25,582 | 25,559 | 26,494 | 27,434 | 29,029 | ||||
| = Net expenditure on current goods and services | P3 excl. D632 | 21,672 | 21,134 | 21,387 | 22,268 | 23,001 | 24,371 | ||||
| + Social transfers in kind via market producers | D632 | 4,255 | 4,448 | 4,172 | 4,226 | 4,433 | 4,657 | ||||
| made up of | |||||||||||
| Individual consumption (= social transfers in kind) | P31 (= D63) | 18,283 | 18,121 | 18,059 | 18,824 | 19,387 | 20,474 | ||||
| Social transfers in kind (via market producers) | D632 | 4,255 | 4,448 | 4,172 | 4,226 | 4,433 | 4,657 | ||||
| Social transfers in kind (provided directly by government) | D631 | 14,028 | 13,673 | 13,887 | 14,598 | 14,954 | 15,816 | ||||
| Collective consumption (= actual final consumption of government) | P32 | 7,644 | 7,461 | 7,500 | 7,670 | 8,047 | 8,555 | ||||
| Total social transfers | D62 + D63 | 41,382 | 41,577 | 40,943 | 41,432 | 42,031 | 42,889 | ||||
| Social benefits in cash | D62 | 23,099 | 23,456 | 22,885 | 22,608 | 22,644 | 22,415 | ||||
| Social transfers in kind (= individual consumption) | D63 | 18,283 | 18,121 | 18,059 | 18,824 | 19,387 | 20,474 | ||||
| Table 13 Local Government transactions: revenue, expenditure, financing and deficit | ||||||||||
| €million | ||||||||||
| Description | ESA2010 code | 2011 | 2012 | 2013 | 2014 | 2015 | 2016 | |||
| Local Government transactions | ||||||||||
| Revenue | TR | 8,019 | 7,361 | 6,487 | 5,634 | 6,316 | 5,914 | |||
| Taxes and social contributions | D2 + D5 + D91 + D61 | 1,678 | 1,810 | 1,733 | 1,701 | 1,591 | 1,424 | |||
| Taxes | D2 + D5 + D91 | 1,345 | 1,481 | 1,407 | 1,403 | 1,347 | 1,170 | |||
| Social contributions | D61 | 333 | 329 | 326 | 298 | 244 | 254 | |||
| Sales of goods and services | P1O | 1,590 | 1,578 | 1,551 | 1,376 | 1,447 | 1,538 | |||
| Investment income | D4 | 119 | 97 | 49 | 41 | 36 | 36 | |||
| Current transfer revenue (excluding taxes) | D7 | 2,536 | 2,302 | 1,827 | 1,643 | 1,689 | 1,739 | |||
| Capital transfer revenue (excluding taxes) | D9N | 2,096 | 1,573 | 1,328 | 873 | 1,552 | 1,177 | |||
| Expenditure | TE | 8,175 | 7,453 | 6,496 | 5,531 | 5,738 | 5,649 | |||
| Expense | Expense | 7,843 | 7,826 | 7,134 | 6,556 | 6,607 | 6,725 | |||
| Compensation of employees | D1 | 2,185 | 2,147 | 2,027 | 1,554 | 1,491 | 1,527 | |||
| Use of goods and services plus taxes payable | P2 + D5 + D29 | 2,025 | 1,879 | 1,400 | 1,701 | 1,683 | 1,610 | |||
| Depreciation (Consumption of fixed capital) | P51c | 1,783 | 1,809 | 1,834 | 1,694 | 1,756 | 1,834 | |||
| Interest (excluding FISIM) | D41 | 141 | 120 | 122 | 85 | 65 | 65 | |||
| Subsidies | D3 | 0 | 0 | 0 | 0 | 0 | 0 | |||
| Social benefits | D62 + D632 | 1,473 | 1,550 | 1,469 | 1,242 | 1,344 | 1,422 | |||
| Other current transfers | D7 | 48 | 48 | 48 | 50 | 50 | 50 | |||
| Capital transfers | D9 | 188 | 273 | 235 | 231 | 217 | 217 | |||
| Net operating balance | NOB | 177 | -465 | -647 | -922 | -291 | -811 | |||
| Net acquisition of non-financial assets | P5 + NP - P51c | 333 | -372 | -638 | -1,025 | -869 | -1,076 | |||
| Local Government Surplus/Deficit | B9 | -156 | -93 | -9 | 103 | 578 | 265 | |||
| Table 14 Local Government: detailed classification of revenue and output | |||||||||||
| €million | |||||||||||
| Description | ESA2010 code | 2011 | 2012 | 2013 | 2014 | 2015 | 2016 | ||||
| Total Revenue | TR | 8,019 | 7,361 | 6,487 | 5,634 | 6,316 | 5,914 | ||||
| Taxes and social contributions | 1,678 | 1,810 | 1,733 | 1,701 | 1,591 | 1,424 | |||||
| Taxes | D2 + D5 + D91 | 1,345 | 1,481 | 1,407 | 1,403 | 1,347 | 1,170 | ||||
| Indirect taxes (taxes on production and imports) | D2 | 1,342 | 1,478 | 1,407 | 1,403 | 1,347 | 1,170 | ||||
| Other taxes on production | D29 | 1,342 | 1,478 | 1,407 | 1,403 | 1,347 | 1,170 | ||||
| Capital taxes | D91 | 3 | 3 | 0 | 0 | 0 | 0 | ||||
| Social contributions | D61 | 333 | 329 | 326 | 298 | 244 | 254 | ||||
| Actual social contributions | D611 + D613 | 200 | 190 | 186 | 130 | 126 | 126 | ||||
| Employers' imputed social contributions | D612 | 133 | 139 | 140 | 168 | 118 | 127 | ||||
| Sales of goods and services | P1O | 1,590 | 1,578 | 1,551 | 1,376 | 1,447 | 1,538 | ||||
| Sales of market establishments (= market output) | P11 | 905 | 956 | 991 | 1,039 | 1,117 | 1,208 | ||||
| Imputed sales related to production of own-use capital assets (= output for own final use) | P12 | 0 | 0 | 0 | 0 | 0 | 0 | ||||
| Incidental sales and fees of non-market establishments | P131 | 685 | 622 | 560 | 337 | 330 | 330 | ||||
| Investment income | D4 | 119 | 97 | 49 | 41 | 36 | 36 | ||||
| Interest (excluding FISIM) | D41 | 119 | 97 | 49 | 41 | 36 | 36 | ||||
| of which received from Central Government | D41_CG | 0 | 0 | 0 | 0 | 0 | 0 | ||||
| Dividends | D42 | 0 | 0 | 0 | 0 | 0 | 0 | ||||
| Current transfer revenue | D39 + D7 | 2,536 | 2,302 | 1,827 | 1,643 | 1,689 | 1,739 | ||||
| Subsidies | D39 | 0 | 0 | 0 | 0 | 0 | 0 | ||||
| Other current transfers | D7 | 2,536 | 2,302 | 1,827 | 1,643 | 1,689 | 1,739 | ||||
| Grants from central government | D73 | 2,490 | 2,257 | 1,798 | 1,600 | 1,649 | 1,699 | ||||
| Other Domestic - Current | D7N_S1 | 46 | 45 | 29 | 43 | 40 | 40 | ||||
| Capital transfer revenue | D9N | 2,096 | 1,573 | 1,328 | 873 | 1,552 | 1,177 | ||||
| Grants from central government | D9N_CG | 1,851 | 1,357 | 1,132 | 641 | 1,300 | 881 | ||||
| Other capital transfers receivable | D99 | 246 | 216 | 196 | 232 | 252 | 296 | ||||
| Output | P1 | 6,287 | 6,189 | 5,634 | 5,352 | 5,398 | 5,521 | ||||
| Market output (sales of market establishments) | P11 | 905 | 956 | 991 | 1,039 | 1,117 | 1,208 | ||||
| Output for own final use | P12 | 0 | 0 | 0 | 0 | 0 | 0 | ||||
| Non-market output | P13 | 5,382 | 5,233 | 4,644 | 4,313 | 4,281 | 4,313 | ||||
| = Non-market compensation of employees | D1_nonmarket | 2,185 | 2,147 | 2,027 | 1,554 | 1,491 | 1,528 | ||||
| = Total compensation of employees | D1 | 2,185 | 2,147 | 2,027 | 1,554 | 1,491 | 1,527 | ||||
| - Compensation of employees of market establishments | D1_market | 0 | 0 | 0 | 0 | 0 | 1 | ||||
| - Compensation related to production of own-use capital assets | D1_own-use | 0 | 0 | 0 | 0 | 0 | 0 | ||||
| + Non-market intermediate consumption | P2_nonmarket | 1,798 | 1,667 | 1,181 | 1,481 | 1,457 | 1,385 | ||||
| = Total intermediate consumption | P2 | 2,025 | 1,879 | 1,400 | 1,701 | 1,683 | 1,610 | ||||
| - Intermediate consumption of market establishments | P2_market | -227 | -212 | -219 | -219 | -225 | -225 | ||||
| - Intermediate consumption related to production of own-use capital assets | P2_own-use | 0 | 0 | 0 | 0 | 0 | 0 | ||||
| + Non-market consumption of fixed capital | P51c_nonmarket | 1,399 | 1,420 | 1,436 | 1,278 | 1,333 | 1,400 | ||||
| = Total consumption of fixed capital | P51c | 1,783 | 1,809 | 1,834 | 1,694 | 1,756 | 1,834 | ||||
| - Consumption of fixed capital by market establishments | P51c_market | -384 | -390 | -397 | -416 | -424 | -434 | ||||
| - Consumption of fixed capital related to production of own-use capital assets | P51c_own-use | 0 | 0 | 0 | 0 | 0 | 0 | ||||
| + Other taxes on production, payable | D29_pay | 0 | 0 | 0 | 0 | 0 | 0 | ||||
| - Other subsidies on production, receivable | D39_rec | 0 | 0 | 0 | 0 | 0 | 0 | ||||
| Table 15 Local Government: detailed classification of expenditure and consumption | |||||||||||
| €million | |||||||||||
| Description | ESA2010 code | 2011 | 2012 | 2013 | 2014 | 2015 | 2016 | ||||
| Total Expenditure | TE | 8,175 | 7,453 | 6,496 | 5,531 | 5,738 | 5,649 | ||||
| Expense | 7,843 | 7,826 | 7,134 | 6,556 | 6,607 | 6,725 | |||||
| Compensation of employees | D1 | 2,185 | 2,147 | 2,027 | 1,554 | 1,491 | 1,527 | ||||
| Of which: Related to production of own-use capital assets | 0 | 0 | 0 | 0 | 0 | 0 | |||||
| Use of goods and services plus taxes payable | P2 + D5 + D29 | 2,025 | 1,879 | 1,400 | 1,701 | 1,683 | 1,610 | ||||
| Use of goods and services [Intermediate consumption] | P2 | 2,025 | 1,879 | 1,400 | 1,701 | 1,683 | 1,610 | ||||
| Of which: Intermediate consumption of market establishments | 227 | 212 | 219 | 219 | 225 | 225 | |||||
| Taxes, payable | D5 + D29 | 0 | 0 | 0 | 0 | 0 | 0 | ||||
| Depreciation (Consumption of fixed capital) | P51c | 1,783 | 1,809 | 1,834 | 1,694 | 1,756 | 1,834 | ||||
| Of which: Depreciation by market establishments | 384 | 390 | 397 | 416 | 424 | 434 | |||||
| Interest (excluding FISIM) | D41 | 141 | 120 | 122 | 85 | 65 | 65 | ||||
| Interest payable to central government | D41_CG | 118 | 97 | 99 | 71 | 50 | 50 | ||||
| Other domestic interest payable | D41_S1 | 22 | 22 | 22 | 13 | 15 | 15 | ||||
| Subsidies | D3 | 0 | 0 | 0 | 0 | 0 | 0 | ||||
| Social benefits | D62 + D632 | 1,473 | 1,550 | 1,469 | 1,242 | 1,344 | 1,422 | ||||
| Social benefits in cash | D62 | 770 | 779 | 656 | 366 | 365 | 312 | ||||
| Social benefits in kind (via market producers) | D632 | 704 | 771 | 814 | 876 | 979 | 1,110 | ||||
| Other current transfers | D7 | 48 | 48 | 48 | 50 | 50 | 50 | ||||
| Grants to central government | D73_CG | 3 | 3 | 3 | 3 | 3 | 3 | ||||
| Miscellaneous current transfers | D75 | 46 | 45 | 45 | 47 | 47 | 47 | ||||
| Capital transfers | D9 | 188 | 273 | 235 | 231 | 217 | 217 | ||||
| Investment grants | D92 | 188 | 273 | 235 | 231 | 217 | 217 | ||||
| Net acquisition of non-financial assets | P5 + NP - P51c | 333 | -372 | -638 | -1,025 | -869 | -1,076 | ||||
| = Gross investment in non-financial assets | P5 + NP | 2,116 | 1,437 | 1,195 | 669 | 887 | 758 | ||||
| Gross fixed capital formation | P51 | 2,116 | 1,437 | 1,195 | 669 | 828 | 758 | ||||
| Net acquisition of stocks | P52 | 0 | 0 | 0 | 0 | 0 | 0 | ||||
| Net acquisition of unproduced assets | NP | 0 | 0 | 0 | 0 | 60 | 0 | ||||
| - Consumption of fixed capital | P51c | -1,783 | -1,809 | -1,834 | -1,694 | -1,756 | -1,834 | ||||
| Net expenditure on current goods and services | P3 excl. D632 | 4,697 | 4,611 | 4,084 | 3,976 | 3,951 | 3,983 | ||||
| = Output | P1 | 6,287 | 6,189 | 5,634 | 5,352 | 5,398 | 5,521 | ||||
| - Sales of goods and services | P11+P12+P131 | -1,590 | -1,578 | -1,551 | -1,376 | -1,447 | -1,538 | ||||
| Market output (sales of market establishments) | P11 | -905 | -956 | -991 | -1,039 | -1,117 | -1,208 | ||||
| Output for own final use | P12 | 0 | 0 | 0 | 0 | 0 | 0 | ||||
| Incidental sales and fees of non-market establishments | P131 | -685 | -622 | -560 | -337 | -330 | -330 | ||||
| Final consumption expenditure | P3 | 5,401 | 5,382 | 4,898 | 4,853 | 4,931 | 5,092 | ||||
| = Net expenditure on current goods and services | P3 excl. D632 | 4,697 | 4,611 | 4,084 | 3,976 | 3,951 | 3,983 | ||||
| + Social transfers in kind via market producers | D632 | 704 | 771 | 814 | 876 | 979 | 1,110 | ||||
| made up of | |||||||||||
| Individual consumption (= social transfers in kind) | P31 (= D63) | 2,351 | 2,367 | 2,365 | 2,336 | 2,386 | 2,481 | ||||
| Social transfers in kind (via market producers) | D632 | 704 | 771 | 814 | 876 | 979 | 1,110 | ||||
| Social transfers in kind (provided directly by government) | D631 | 1,647 | 1,595 | 1,551 | 1,460 | 1,407 | 1,372 | ||||
| Collective consumption (= actual final consumption of government) | P32 | 3,050 | 3,016 | 2,532 | 2,516 | 2,544 | 2,611 | ||||
| Total social transfers | D62 + D63 | 3,121 | 3,146 | 3,021 | 2,702 | 2,752 | 2,793 | ||||
| Social benefits in cash | D62 | 770 | 779 | 656 | 366 | 365 | 312 | ||||
| Social transfers in kind (= individual consumption) | D63 | 2,351 | 2,367 | 2,365 | 2,336 | 2,386 | 2,481 | ||||
Introduction
This release comprises the latest official publication by CSO of annual Government Finance Statistics (GFS) results for years 2011 to 2016. The data in this release are subject to the normal verification process by Eurostat until 23 October 2017 and are therefore provisional.
The full suite of GFS tables are available on the CSO’s website by following the link:
http://www.cso.ie/en/statistics/nationalaccounts/
The data published in this series are consistent with the General Government Deficit and Debt levels reported at end-September 2017 under the EU regulation governing the Excessive Deficit Procedure (EDP). Consequently they may not always be fully aligned with the National Income and Expenditure and related publications such as the Institutional Sector Accounts.
The official publication by Eurostat of deficit and debt levels for all EU member states is due on 23 October 2017.
Changed treatment of sale of mobile telephony (UMTS) licences
On 27 March 2017 Eurostat published a Guidance Note on the treatment of mobile phone licences, exploration rights and other licences on the recording of revenues arising from the sale of licences by government see - http://ec.europa.eu/eurostat/documents/1015035/7959867/Mobile-phone-licences-exploration-rights-and-other-licences.pdf.
This clarifies the rules for whether sales of licences by government for use of natural resources (e.g. use of the electromagnetic spectrum for mobile phone transmissions) should be treated as the direct sale of an asset, resulting in a once-off revenue or as the rent of an asset over a prolonged period resulting in a series of revenue over the period of the licence.
The CSO have amended the treatment of past sales of mobile phone licences to bring these in line with the March 2017 guidance note on the treatment of the sales of UMTS licences in 2002, 2007 and 2013. The transactions in question are no longer treated as disposals of non-produced assets but as payments for rent of natural resources by the relevant operators over the period of the licence. Under this treatment the deficit benefit accruing from the transaction is spread over the period of the licence rather than entering the accounts in the year of the transaction. Up front lump sum payments are treated as a prepayment, and enter the balance sheet of government as a liability under “accounts payable” and are unwound over the period of the licence.
The changes in key revenue and expenditure aggregates following this revised treatment are as follows:
Treatment of pre-paid margin on borrowing from the European Financial Stability Facility (EFSF)
The general government debt (GG Debt) of Ireland includes borrowings from the European Financial Stability Facility (EFSF). The terms of the agreement establishing the EFSF were that it was a facility to make loans to euro area Member States and to finance such loans by issuing or entering into funding instruments backed by guarantees. The financing was made available in the context of the financial crisis as a facility for Member States “in difficulties caused by exceptional circumstances beyond such Member States' control”.
The first of these loans to Ireland was drawn down in February 2011 and had an original maturity date of 18 July 2016. In accordance with the arrangements for EFSF borrowing at that time, a pre-paid margin of €530 million was deducted from the loan amount on disbursement and held as a cash reserve, essentially as a form of security.
The total amount shown on the GG Debt for Ireland in relation to this loan was €4,194 million. This sum includes the full pre-paid margin of €530 million. There was also a counterbalancing asset in the amount of the margin shown in the accounts.
Following a decision of the relevant Heads of State and Government on 21 July 2011 the margin was no longer applicable to new loans, and the reimbursement of the prepaid margin plus interest earned over the period fell due to Ireland and the member state guarantors (€485 million and €45 million respectively) in proportion to the duration of the loan before and after 21 July 2011. For Ireland, therefore, this reimbursement fell due on 18 July 2016 *. On this date a payment of €554.9 million was received. This payment comprises the portion of the pre-paid margin due to the Exchequer (covering the period from 21 July 2011 onwards) plus interest income.
*In 2013 the original loan was extended and split into two separate loans, with maturity dates in 2032 and 2033. However, the agreement to reimburse the prepaid margin on the maturity date of the original loan held under the new arrangements.
Following clarification from Eurostat the original margin of €530 million has been recorded as interest expenditure over the period of the loan (2011-2016) and the rebate of €554.9 million has been treated as one-off capital transfer revenue in 2016. This treatment is specific to this particular loan and applies to all Member States involved in this type of borrowing from the EFSF. It does not apply to other loans drawn down from the EFSF or other programme funding accessed by Ireland during the financial crisis. This treatment was applied in the April version of these figures and is unchanged in the current release.
GDP figures used in publication
The GDP figures used in this publication are consistent with those published in the National Income and Expenditure 2016 published on 14 July 2017.
Revisions to General Government Deficit/Surplus (GG Deficit/Surplus)
Estimates of the general government deficit for years 2002 to 2016 have been revised since April 2017. The changes reflect the changes due to the revised methodology following the updated Eurostat guidance on the sale of licences along with changes in the estimation of financial intermediation services indirectly measured (FISIM). Changes to recent years also reflect the availability of more up-to-date and detailed data sources.
Revisions to General Government Debt (GG Debt)
Estimates of the general government debt have been revised since April 2017. Revisions are due to improved compilation processes and, in recent years, also reflect the availability of more up-to-date and detailed data sources.
Government Finance Statistics – Concepts and Definitions
Government Finance Statistics (GFS) form the basis for fiscal monitoring in Europe, in particular in relation to the Excessive Deficit Procedure (EDP).
European GFS, including EDP statistics, are produced according to the legally binding accounting rules of the European System of Accounts (ESA2010). The Manual on Government Debt and Deficit (MGDD) provides further guidance on the implementation of ESA 2010 in the context of GFS.
EU Member States are required to report government deficit/surplus and debt data biannually under the EDP (before 1 April and 1 October in year N) for years N-4 to N-1 calendar years as well as a forecast for the current year. The data are reported in harmonised tables, which provide a consistent framework for the presentation of this data by Member States. The tables provide a structure for linking national budgetary aggregates with government deficit and debt.
Detailed statistics on government revenue and expenditure are also provided to Eurostat under the ESA transmission programme. For annual data the main tables reported are:
Table 0200 Revenue and expenditure of general government and sub-sectors
Tables 0900 and 0999 Taxes and national tax list
These data are available on the Eurostat website.
http://ec.europa.eu/eurostat/web/government-finance-statistics/data/main-tables
Definition of General Government and its subsectors
The general government sector of the economy, is defined in ESA2010 paragraph 2.111: as “institutional units which are non-market producers whose output is intended for individual and collective consumption, and are financed by compulsory payments made by units belonging to other sectors, and institutional units principally engaged in the redistribution of national income and wealth.” General government comprises the sub-sectors central government (S.1311), state government (S.1312 – which does not apply in Ireland), local government (S.1313), and social security funds (S.1314 – which does not apply in Ireland),
General Government Deficit/Surplus (GG Deficit/Surplus) is the standard European measure of the fiscal balance, which is used to monitor compliance with the Stability and Growth Pact.
This measure is by definition equal to both Total Revenue (TR) less Total Expenditure (TE), and Net Acquisition of Financial Assets less Net Incurrence of Liabilities as shown in the GFS release.
A listing of some of the main items included in this release is shown below
Main Components of General Government Expenditure and Revenue
P.2 Intermediate consumption – value of goods and services used in the process of production, excluding fixed assets
P.5 Gross capital formation
P.51g Gross fixed capital formation - acquisitions, less disposals, of fixed assets during a given period plus certain additions to the value of non-produced assets realised by productive activity. Fixed assets are tangible or intangible assets produced as outputs from processes of production that are themselves used repeatedly, or continuously, in processes of production for more than one year
P.51c Consumption of fixed capital - the amount of fixed assets used up, during the period under consideration, as a result of normal wear and tear and foreseeable obsolescence, including a provision for losses of fixed assets as a result of accidental damage which can be insured against.
P.52 Changes in inventories
P.53 Acquisitions less disposals of valuables
D.1 Compensation of employees – the total remuneration of government employees
D.29 Other taxes on production (payable) all taxes that enterprises incur as a result of engaging in production, independently of the quantity or value of the goods and services produced or sold. These include taxes on use or ownership of land or buildings, taxes on use of fixed assets, taxes on total wage bill and payroll, taxes on international transactions related to production.
D.3 Subsidies (payable) - current unrequited payments which general government or the institutions of the European Union make to resident producers, with the objective of influencing their levels of production, their prices or the remuneration of the factors of production
D.4 Property income accrues when the owners of financial assets and natural resources put them at the disposal of other units of the economy. The income payable for the use of financial assets is called investment income, while that payable for the use of a natural resource is called rent. Property income is the sum of investment income and rent.
D.41 Interest receivable by the owners of a financial asset for putting it at the disposal of another institutional unit - applies to deposits (AF.2), debt securities (AF.3), loans (AF.4) and other accounts payable (AF.8)
D.42 Dividends receivable by the owners of share equities. Dividends exclude "super dividends" which arise where the dividend paid is large relative to the recent level of dividends and earnings. Super dividends are recorded as withdrawal of equity (F.5). This arises, for example, in the case of dividends paid by the Central Bank in 2015.
D.45 Rent of a natural resource – income receivable by the owner of a natural resource for putting the resource at the disposal of another party.
D.5 Current taxes on income, wealth, etc., (payable) - all compulsory, unrequited payments, in cash or in kind, levied periodically by general government and by the rest of the world on the income and wealth of units in the economy, and some periodic taxes which are assessed neither on income nor wealth
D.6 Social contributions - transfers to households, in cash or in kind, intended to relieve them from the financial burden of a number of risks or needs.
D.7 Other current transfers – includes VAT and GNI based EU budget contributions, current transfers between subsectors of government, current international co-operation and current transfers to households and non-profit institutions.
D.9 Capital transfers - involve the acquisition or disposal of an asset, or assets, by at least one of the parties to the transaction. Includes capital taxes and investment grants.
P.1 Total output of Government is equal to market output, own account capital formation, and non-market output (i.e. the sum of D.1+P.2+P51c). The market output referred to in this publication is the imputed market value of social housing rented dwellings. See Table 3.
P.3 Final consumption expenditure of Government is equal to the total of its output (P.1) plus the expenditure on products/services supplied to households via market producers minus the sales of goods and services (at both market and non-market prices). This is made up of individual non-market services plus collective non-market services (P.31 and P.32). See Table 4.
Categories of Financial Flows
F.1 Monetary gold and special drawing rights (SDRs)
F.11 Monetary gold
F.12 Special drawing rights (SDRs)
F.2 Currency and deposits
F.21 Currency
F.22 Transferable deposits
F.29 Other deposits
F.3 Debt securities
F.31 Short-term
F.32 Long-term
F.4 Loans
F.41 - Short-term loans
F.42 - Long-term loans
F.5 Equity and investment fund shares
F.51 Equity
F.52 Investment fund shares/units
F.6 Insurance pension and standardised guarantee schemes
F.7 Financial derivatives and employee stock options
F.71 Financial derivatives
F.72 Employee stock options
F.8 Other accounts receivable/payable
F.81 Trade credits and advances
F.89 Other trade credits
 Hide Background Notes
Scan the QR code below to view this release online or go to
http://www.cso.ie/en/releasesandpublications/er/gfsa/governmentfinancestatisticsoctober2017/
 Show Table 1 General Government transactions: revenue, expenditure, financing and deficit
 Hide Table 1 General Government transactions: revenue, expenditure, financing and deficit