
| General Government Deficit, Gross Debt , Net Debt and GDP | |||||||
| GG Deficit | GG Gross Debt | GG Net Debt | GDP | ||||
| End of year | €m | % GDP | €m | % GDP | €m | % GDP | €m |
| 2010 | -53,677 | -32.1 | 144,227 | 86.3 | 110,711 | 66.2 | 167,124 |
| 2011 | -21,842 | -12.6 | 189,707 | 109.6 | 134,537 | 77.7 | 173,070 |
| 2012 | -14,014 | -8.0 | 209,986 | 119.5 | 151,268 | 86.1 | 175,754 |
| 2013 | -10,193 | -5.7 | 215,298 | 119.5 | 160,708 | 89.2 | 180,209 |
| 2014 | -7,197 | -3.7 | 203,299 | 105.2 | 166,491 | 86.2 | 193,160 |
| 2015 | -4,786 | -1.9 | 201,134 | 78.6 | 171,533 | 67.1 | 255,815 |
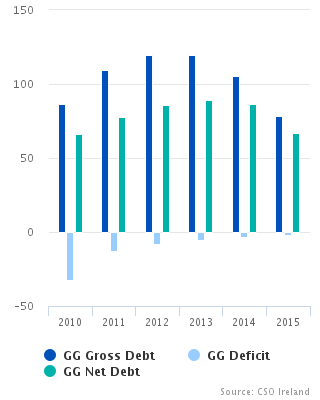
In 2015, the General Government Deficit was -€4.8 billion, or 1.9% of GDP, an improvement on the 2014 position of -€7.2 billion, or 3.7% of GDP. The main driving factor behind this improvement was an increase of over 7% in Government revenue to €70.5 billion which was partially offset by an increase of over 3% in Government expenditure to €75.3 billion (see Table 1).
Taxes were the main drivers in revenue growth, increasing by over 9% in 2015 to €50.7 billion. Other increases in revenue, in social contributions and sales in goods and services, were partially offset by reductions in other income, in particular, investment income (see Table 1).
The 3.2% increase in Government expenditure in 2015 was mainly due to a once-off capital injection related to the redemption of AIB preference shares held by Government at the end of 2015 (see Table 1).
The General Government Deficit excluding interventions to support financial institutions would have been €3 billion in 2015, or 1.5% of GDP. Interest on preference shares and contingent capital in the main pillar banks reduced over the period 2012-2015 as the State reduced these holdings (see Table 1).
Government Debt falls to 78.6% of GDP in 2015
The General Government Gross Debt (GG Debt) stood at €201.1 billion at the end of 2015, or 78.6% of GDP, down from €203.3 billion at the end of 2014, or 105.2% of GDP (see Table 2). The significant increase in GDP in 2015, coupled with the decrease in GG Debt, led to the decrease in the debt to GDP ratio.
The composition of GG Debt changed in 2015, driven in part by a repayment of IMF loans in the first quarter of the year. This reduction in loan liabilities was largely offset in the same quarter by a more conventional means of financing through the issuance of long-term debt securities (see Table 6).
General Government Net Debt increased by some €5 billion in 2015, and stood at €171.5 billion, or 67.1% of GDP. This increase was composed of a €2.2 billion reduction in GG Debt and a fall of €7.2 billion in EDP debt instrument assets over the same period (see Tables 2 & 7).
|
National accounts are compiled in the EU according to the European System of National and Regional Accounts (ESA) framework. In 2014, the new ESA 2010 framework replaced the previous ESA 95 version and all EU member states were required to adopt ESA 2010 by September 2014. The results in this release are presented under the ESA 2010 standards. See Background Notes for further information. GFS annual results are benchmarked to the most recent Excessive Deficit Procedure (EDP) notification. Consequently they may not always be fully aligned with the National Income and Expenditure and related publications such as the Institutional Sector Accounts. The data in this release are subject to the normal EDP verification process by Eurostat until 21st October 2016 and are therefore provisional. |
| Total Revenue | Total Expenditure | |
| 2010 | 33.2 | 65.3 |
| 2011 | 33.3 | 46 |
| 2012 | 33.9 | 41.8 |
| 2013 | 34.1 | 39.8 |
| 2014 | 34.1 | 37.8 |
| 2015 | 27.6 | 29.4 |
| Table 1 General Government transactions: revenue, expenditure, financing and deficit | ||||||||||
| €million | ||||||||||
| Description | ESA2010 code | 2010 | 2011 | 2012 | 2013 | 2014 | 2015 | |||
| General Government transactions | ||||||||||
| Revenue | TR | 55,407 | 57,716 | 59,493 | 61,522 | 65,803 | 70,534 | |||
| Taxes and social contributions | D2 + D5 + D91 + D61 | 47,377 | 49,231 | 50,803 | 52,908 | 57,431 | 62,123 | |||
| Taxes | D2 + D5 + D91 | 37,891 | 38,863 | 40,929 | 42,499 | 46,448 | 50,735 | |||
| Social contributions | D61 | 9,485 | 10,368 | 9,874 | 10,410 | 10,983 | 11,388 | |||
| Sales of goods and services | P1O | 5,284 | 5,163 | 5,113 | 4,938 | 4,705 | 5,296 | |||
| Investment income | D4 | 2,112 | 2,454 | 3,027 | 3,181 | 2,964 | 2,661 | |||
| Current transfer revenue (excluding taxes) | D7 | 313 | 258 | 250 | 196 | 298 | 253 | |||
| Capital transfer revenue (excluding taxes) | D9N | 322 | 610 | 299 | 298 | 405 | 201 | |||
| Expenditure | TE | 109,084 | 79,557 | 73,506 | 71,715 | 73,000 | 75,320 | |||
| Expense | Expense | 106,786 | 78,585 | 73,254 | 72,092 | 72,201 | 74,540 | |||
| Compensation of employees | D1 | 19,293 | 19,389 | 18,996 | 18,594 | 18,344 | 18,874 | |||
| Use of goods and services plus taxes payable | P2 + D5 + D29 | 9,168 | 8,801 | 8,343 | 8,196 | 8,906 | 9,193 | |||
| Depreciation (Consumption of fixed capital) | P51c | 3,186 | 3,305 | 3,301 | 3,267 | 3,433 | 3,627 | |||
| Interest (excluding FISIM) | D41 | 4,743 | 5,719 | 7,179 | 7,614 | 7,449 | 6,693 | |||
| Subsidies | D3 | 1,828 | 1,725 | 1,921 | 1,913 | 1,853 | 1,785 | |||
| Social benefits | D62 + D632 | 28,774 | 28,827 | 29,476 | 28,583 | 28,209 | 28,249 | |||
| Other current transfers | D7 | 2,664 | 2,598 | 2,519 | 2,892 | 2,773 | 2,565 | |||
| Capital transfers | D9 | 37,130 | 8,222 | 1,519 | 1,033 | 1,234 | 3,554 | |||
| Net operating balance | NOB | -51,381 | -20,871 | -13,762 | -10,570 | -6,398 | -4,007 | |||
| Net acquisition of non-financial assets | P5 + NP - P51c | 2,298 | 972 | 252 | -377 | 798 | 779 | |||
| General Government Surplus/Deficit | B9 | -53,677 | -21,842 | -14,014 | -10,193 | -7,197 | -4,786 | |||
| equals | ||||||||||
| Net acquisition of financial assets | ΔFA | -11,638 | 3,665 | 6,059 | -5,526 | -18,856 | -7,284 | |||
| Debt instruments | F2 + F3 + F4 | -8,984 | -71 | 4,380 | -4,381 | -19,508 | -7,314 | |||
| Equity and Investment Fund Shares | F5 | -2,388 | 3,703 | 1,826 | -1,307 | -91 | 240 | |||
| Other financial assets | F6 + F7 + F8 | -266 | 33 | -147 | 162 | 743 | -210 | |||
| less | ||||||||||
| Net incurrence of liabilities | ΔL | 42,039 | 25,507 | 20,073 | 4,667 | -11,659 | -2,498 | |||
| Debt instruments | F2 + F3 + F4 | 40,927 | 25,143 | 19,700 | 5,538 | -12,529 | -2,806 | |||
| Other liabilities | F5 + F6 + F7 + F8 | 1,112 | 364 | 373 | -871 | 870 | 308 | |||
| Memo: Net derivative flows on debt interest swap contracts | 10 | -132 | -221 | -274 | -264 | -240 | ||||
| General Government Surplus/Deficit (% of GDP) | -32.1 | -12.6 | -8.0 | -5.7 | -3.7 | -1.9 | ||||
| Government interventions to support financial institutions | ||||||||||
| Revenue (a+b+c+d) | 1,744 | 3,065 | 3,036 | 2,809 | 2,295 | 2,174 | ||||
| Guarantee fees receivable (a) | P131(part) | 1,074 | 1,215 | 934 | 420 | 155 | 53 | |||
| Interest receivable (b) | D4(part) | 508 | 1,041 | 1,539 | 1,090 | 712 | 505 | |||
| Dividends receivable (c) | D4(part) | 32 | 333 | 502 | 760 | 761 | 962 | |||
| Other (d) | P131(part) | 130 | 476 | 61 | 539 | 668 | 653 | |||
| Expenditure (e+f+g+h) | 37,287 | 9,436 | 2,681 | 2,370 | 2,281 | 3,940 | ||||
| Interest payable (e) | D4(part) | 1,894 | 2,150 | 2,047 | 1,864 | 1,528 | 1,211 | |||
| Capital injections recorded as deficit-increasing (capital transfer)(f) | D9(part) | 35,393 | 7,114 | 280 | 0 | 0 | 2,111 | |||
| Calls on guarantees (g) | D9(part) | 0 | 0 | 0 | 0 | 0 | 0 | |||
| Other (h) | various | 0 | 172 | 353 | 506 | 753 | 618 | |||
| Impact of the above interventions on General Government Surplus/Deficit | -35,544 | -6,370 | 355 | 439 | 15 | -1,766 | ||||
| General Government Surplus/Deficit excluding interventions to support financial institutions | -18,134 | -15,471 | -14,369 | -10,632 | -7,211 | -3,020 | ||||
| Table 2 General Government Net Worth, Gross and Net Debt | ||||||||||||
| €million | ||||||||||||
| Description | ESA2010 code | 2010 | 2011 | 2012 | 2013 | 2014 | 2015 | |||||
| General Government net worth | ||||||||||||
| Net worth at market value, excluding pension liabilities | NW | 6,015 | -19,609 | -49,407 | -55,126 | -58,361 | -49,561 | |||||
| equals | ||||||||||||
| Non-financial assets at market value | NFA | 84,392 | 85,016 | 87,371 | 90,081 | 95,053 | 100,877 | |||||
| plus | ||||||||||||
| Financial net worth at market value, excluding pension liabilities | FNW | -78,377 | -104,625 | -136,778 | -145,207 | -153,414 | -150,438 | |||||
| equals | ||||||||||||
| Financial assets at market value | FA | 62,231 | 88,281 | 93,068 | 94,806 | 84,342 | 84,810 | |||||
| EDP debt instruments | F2 + F3 + F4 | 33,516 | 55,168 | 58,718 | 54,590 | 36,808 | 29,602 | |||||
| Equity and Investment Fund Shares | F5 | 20,130 | 22,975 | 25,098 | 30,795 | 38,202 | 45,259 | |||||
| Other financial assets | F6 + F7 + F8 | 8,585 | 10,138 | 9,252 | 9,421 | 9,332 | 9,949 | |||||
| less | ||||||||||||
| Liabilities at market value | L | 140,608 | 192,906 | 229,846 | 240,013 | 237,756 | 235,248 | |||||
| EDP debt instruments | F2 + F3 + F4 | 132,998 | 181,857 | 218,596 | 231,503 | 228,849 | 225,423 | |||||
| Other liabilities | F5 + F6 + F7 + F8 | 7,610 | 11,049 | 11,250 | 8,510 | 8,907 | 9,825 | |||||
| Memo: Estimated pension liabilities of government | 116,000 | 116,000 | 98,000 | 98,000 | 98,000 | 98,000 | ||||||
| Memo: Net worth, including pension liabilities | -109,985 | -135,609 | -147,407 | -153,126 | -156,361 | -147,561 | ||||||
| Contingent liabilities | 149,355 | 3,576 | 119,131 | 59,723 | 29,253 | 16,862 | ||||||
| Memo: Net worth, including pension liabilities and contingent liabilities | -259,340 | -139,185 | -266,538 | -212,848 | -185,614 | -164,422 | ||||||
| General Government: changes in net worth | ||||||||||||
| Opening net worth | 46,883 | 6,015 | -19,609 | -49,407 | -55,126 | -58,361 | ||||||
| Change in net worth due to transactions | -51,380 | -20,870 | -13,762 | -10,570 | -6,398 | -4,007 | ||||||
| Net acquisition of non-financial assets | P5 + NP - P51c | 2,298 | 972 | 252 | -377 | 798 | 779 | |||||
| Net lending/net borrowing | B9 | -53,677 | -21,842 | -14,014 | -10,193 | -7,197 | -4,786 | |||||
| Change in net worth due to other economic flows | Kx | 10,511 | -4,754 | -16,036 | 4,852 | 3,163 | 12,807 | |||||
| Other changes in non-financial assets | -6,332 | -348 | 2,103 | 3,087 | 4,173 | 5,045 | ||||||
| Other changes in financial assets | 474 | 22,385 | -1,272 | 7,264 | 8,392 | 7,752 | ||||||
| Other changes in liabilities | 16,369 | -26,791 | -16,867 | -5,500 | -9,402 | 10 | ||||||
| Closing net worth | 6,015 | -19,609 | -49,407 | -55,126 | -58,361 | -49,561 | ||||||
| General Government Debt (GGDebt) | ||||||||||||
| Debt instrument liabilities at market value | F2 + F3 + F4 | 132,998 | 181,857 | 218,596 | 231,503 | 228,849 | 225,423 | |||||
| + Difference between EDP face value and market value | 11,229 | 7,850 | -8,610 | -16,205 | -25,550 | -24,289 | ||||||
| Gross General Government Debt (EDP face value) | GGDebt | 144,227 | 189,707 | 209,986 | 215,298 | 203,299 | 201,134 | |||||
| less EDP debt instrument assets | F2 + F3 + F4 | -33,516 | -55,170 | -58,718 | -54,590 | -36,808 | -29,601 | |||||
| Net General Government Debt | GGNetDebt | 110,711 | 134,537 | 151,268 | 160,708 | 166,491 | 171,533 | |||||
| Closing Net Worth (% of GDP) | 3.6 | -11.3 | -28.1 | -30.6 | -30.2 | -19.4 | ||||||
| Gross General Government Debt (% of GDP) | 86.3 | 109.6 | 119.5 | 119.5 | 105.2 | 78.6 | ||||||
| Net General Government Debt (% of GDP) | 66.2 | 77.7 | 86.1 | 89.2 | 86.2 | 67.1 | ||||||
| Table 3 General Government: detailed classification of revenue and output | |||||||||||
| €million | |||||||||||
| Description | ESA2010 code | 2010 | 2011 | 2012 | 2013 | 2014 | 2015 | ||||
| Total Revenue | TR | 55,407 | 57,716 | 59,493 | 61,522 | 65,803 | 70,534 | ||||
| Taxes and social contributions | 47,377 | 49,231 | 50,803 | 52,908 | 57,431 | 62,123 | |||||
| Taxes | D2 + D5 + D91 | 37,891 | 38,863 | 40,929 | 42,499 | 46,448 | 50,735 | ||||
| Indirect taxes (taxes on production and imports) | D2 | 18,063 | 17,779 | 18,344 | 19,285 | 21,195 | 22,453 | ||||
| Taxes on products | D21 | 16,083 | 15,705 | 16,099 | 16,749 | 18,238 | 19,430 | ||||
| of which Value-Added Tax | D211 | 10,067 | 9,755 | 10,219 | 10,372 | 11,521 | 11,955 | ||||
| Other taxes on production | D29 | 1,981 | 2,074 | 2,245 | 2,536 | 2,957 | 3,023 | ||||
| Direct taxes | D5 | 19,583 | 20,842 | 22,300 | 22,935 | 24,894 | 27,881 | ||||
| Taxes on income, profits and capital gains | D51 | 18,617 | 19,435 | 20,837 | 21,298 | 23,016 | 26,604 | ||||
| Other current direct taxes | D59 | 966 | 1,407 | 1,463 | 1,637 | 1,878 | 1,276 | ||||
| Capital taxes | D91 | 245 | 242 | 285 | 278 | 359 | 401 | ||||
| Social contributions | D61 | 9,485 | 10,368 | 9,874 | 10,410 | 10,983 | 11,388 | ||||
| Actual social contributions | D611 + D613 | 8,432 | 9,039 | 8,482 | 9,020 | 9,581 | 10,022 | ||||
| PRSI receipts | D611 + D613(pt) | 6,702 | 7,268 | 6,799 | 7,299 | 7,947 | 8,512 | ||||
| Government employees' social contributions | D613(pt) | 1,730 | 1,770 | 1,682 | 1,721 | 1,633 | 1,510 | ||||
| Employers' imputed social contributions | D612 | 1,053 | 1,330 | 1,393 | 1,390 | 1,403 | 1,366 | ||||
| Sales of goods and services | P1O | 5,284 | 5,163 | 5,113 | 4,938 | 4,705 | 5,296 | ||||
| Sales of market establishments (= market output) | P11 | 877 | 905 | 978 | 1,048 | 1,137 | 1,245 | ||||
| Imputed sales related to production of own-use capital assets (= output for own final use) | P12 | 58 | 58 | 38 | 33 | 33 | 21 | ||||
| Incidental sales and fees of non-market establishments | P131 | 4,349 | 4,200 | 4,097 | 3,857 | 3,535 | 4,031 | ||||
| Investment income | D4 | 2,112 | 2,454 | 3,027 | 3,181 | 2,964 | 2,661 | ||||
| Interest (excluding FISIM) | D41 | 868 | 1,374 | 1,595 | 1,405 | 1,037 | 715 | ||||
| Dividends | D42 | 1,241 | 1,077 | 1,428 | 1,772 | 1,923 | 1,942 | ||||
| Rent of land and subsoil assets | D45 | 2 | 4 | 4 | 4 | 4 | 4 | ||||
| Current transfer revenue | D39 + D7 | 313 | 258 | 250 | 196 | 298 | 253 | ||||
| Subsidies | D39 | 0 | 0 | 0 | 0 | 0 | 0 | ||||
| Other current transfers | D7 | 313 | 258 | 250 | 196 | 298 | 253 | ||||
| Non-life insurance claims | D72 | 24 | 13 | 8 | 9 | 9 | 8 | ||||
| Other Domestic - Current | D7N_S1 | 190 | 204 | 200 | 131 | 239 | 193 | ||||
| From Rest of World - Current | D7N_S2 | 99 | 41 | 42 | 57 | 51 | 52 | ||||
| Capital transfer revenue | D9N | 322 | 610 | 299 | 298 | 405 | 201 | ||||
| Output | P1 | 31,916 | 31,788 | 31,014 | 30,488 | 31,185 | 32,281 | ||||
| Market output (sales of market establishments) | P11 | 877 | 905 | 978 | 1,048 | 1,137 | 1,245 | ||||
| Output for own final use | P12 | 58 | 58 | 38 | 33 | 33 | 21 | ||||
| Non-market output | P13 | 30,980 | 30,825 | 29,998 | 29,408 | 30,015 | 31,016 | ||||
| = Non-market compensation of employees | D1_nonmarket | 19,235 | 19,331 | 18,958 | 18,561 | 18,311 | 18,854 | ||||
| = Total compensation of employees | D1 | 19,293 | 19,389 | 18,996 | 18,594 | 18,344 | 18,874 | ||||
| - Compensation of employees of market establishments | D1_market | ||||||||||
| - Compensation related to production of own-use capital assets | D1_own-use | -58 | -58 | -38 | -33 | -33 | -21 | ||||
| + Non-market intermediate consumption | P2_nonmarket | 8,944 | 8,573 | 8,129 | 7,976 | 8,686 | 8,974 | ||||
| = Total intermediate consumption | P2 | 9,167 | 8,800 | 8,342 | 8,196 | 8,906 | 9,193 | ||||
| - Intermediate consumption of market establishments | P2_market | -224 | -227 | -212 | -219 | -219 | -219 | ||||
| - Intermediate consumption related to production of own-use capital assets | P2_own-use | ||||||||||
| + Non-market consumption of fixed capital | P51c_nonmarket | 2,802 | 2,920 | 2,911 | 2,870 | 3,018 | 3,188 | ||||
| = Total consumption of fixed capital | P51c | 3,186 | 3,305 | 3,301 | 3,267 | 3,433 | 3,627 | ||||
| - Consumption of fixed capital by market establishments | P51c_market | -384 | -385 | -389 | -397 | -415 | -439 | ||||
| - Consumption of fixed capital related to production of own-use capital assets | P51c_own-use | ||||||||||
| + Other taxes on production, payable | D29_pay | 0 | 0 | 0 | 0 | 0 | 0 | ||||
| - Other subsidies on production, receivable | D39_rec | 0 | 0 | 0 | 0 | 0 | 0 | ||||
| Table 4 General Government: detailed classification of expenditure and consumption | |||||||||||
| €million | |||||||||||
| Description | ESA2010 code | 2010 | 2011 | 2012 | 2013 | 2014 | 2015 | ||||
| Total Expenditure | TE | 109,084 | 79,557 | 73,506 | 71,715 | 73,000 | 75,320 | ||||
| Expense | 106,786 | 78,585 | 73,254 | 72,092 | 72,201 | 74,540 | |||||
| Compensation of employees | D1 | 19,293 | 19,389 | 18,996 | 18,594 | 18,344 | 18,874 | ||||
| Of which: Related to production of own-use capital assets | 58 | 58 | 38 | 33 | 33 | 21 | |||||
| Use of goods and services plus taxes payable | P2 + D5 + D29 | 9,168 | 8,801 | 8,343 | 8,196 | 8,906 | 9,193 | ||||
| Use of goods and services [Intermediate consumption] | P2 | 9,167 | 8,800 | 8,342 | 8,196 | 8,906 | 9,193 | ||||
| Of which: Intermediate consumption of market establishments | 224 | 227 | 212 | 219 | 219 | 219 | |||||
| Taxes, payable | D5 | 1 | 1 | 1 | 0 | 0 | 0 | ||||
| Depreciation (Consumption of fixed capital) | P51c | 3,186 | 3,305 | 3,301 | 3,267 | 3,433 | 3,627 | ||||
| Of which: Depreciation by market establishments | 384 | 385 | 389 | 397 | 415 | 439 | |||||
| Interest (excluding FISIM) | D41 | 4,743 | 5,719 | 7,179 | 7,614 | 7,449 | 6,693 | ||||
| Other domestic interest payable | D41_S1 | 1,335 | 1,370 | 2,558 | 2,976 | 2,759 | 2,297 | ||||
| Interest payable to rest of world | D41_S2 | 3,408 | 4,349 | 4,621 | 4,638 | 4,690 | 4,397 | ||||
| Subsidies | D3 | 1,828 | 1,725 | 1,921 | 1,913 | 1,853 | 1,785 | ||||
| Product subsidies | D31 | 1,083 | 1,060 | 1,063 | 1,071 | 957 | 882 | ||||
| Other subsidies on production | D39 | 745 | 665 | 858 | 842 | 897 | 903 | ||||
| Social benefits | D62 + D632 | 28,774 | 28,827 | 29,476 | 28,583 | 28,209 | 28,249 | ||||
| Social benefits in cash | D62 | 23,818 | 23,868 | 24,235 | 23,540 | 23,014 | 23,132 | ||||
| Social benefits in kind (via market producers) | D632 | 4,956 | 4,958 | 5,241 | 5,043 | 5,194 | 5,117 | ||||
| Other current transfers | D7 | 2,664 | 2,598 | 2,519 | 2,892 | 2,773 | 2,565 | ||||
| Net non-life insurance premiums | D71 | 83 | 47 | 77 | 58 | 58 | 57 | ||||
| Current international cooperation | D74 | 547 | 547 | 546 | 531 | 435 | 474 | ||||
| Miscellaneous current transfers | D75 | 867 | 854 | 706 | 748 | 798 | 526 | ||||
| VAT and GNI based EU budget contribution | D76 | 1,167 | 1,150 | 1,190 | 1,556 | 1,483 | 1,507 | ||||
| VAT-based EU own resources | D761 | 194 | 194 | 191 | 194 | 203 | 215 | ||||
| GNI-based EU own resources | D762 | 973 | 956 | 999 | 1,361 | 1,280 | 1,293 | ||||
| Capital transfers | D9 | 37,130 | 8,222 | 1,519 | 1,033 | 1,234 | 3,554 | ||||
| Investment grants | D92 | 1,302 | 1,101 | 1,239 | 995 | 1,041 | 1,367 | ||||
| Other capital transfers | D99 | 35,828 | 7,121 | 280 | 38 | 193 | 2,187 | ||||
| Net acquisition of non-financial assets | P5 + NP - P51c | 2,298 | 972 | 252 | -377 | 798 | 779 | ||||
| = Gross investment in non-financial assets | P5 + NP | 5,484 | 4,277 | 3,553 | 2,890 | 4,231 | 4,406 | ||||
| Gross fixed capital formation | P51 | 5,564 | 4,166 | 3,470 | 3,530 | 4,171 | 4,346 | ||||
| Net acquisition of stocks | P52 | -80 | 111 | 83 | 83 | 60 | 60 | ||||
| Net acquisition of unproduced assets | NP | 0 | 0 | 0 | -723 | 0 | 0 | ||||
| - Consumption of fixed capital | P51c | -3,186 | -3,305 | -3,301 | -3,267 | -3,433 | -3,627 | ||||
| Net expenditure on current goods and services | P3 excl. D632 | 26,631 | 26,625 | 25,901 | 25,550 | 26,479 | 26,985 | ||||
| = Output | P1 | 31,916 | 31,788 | 31,014 | 30,488 | 31,185 | 32,281 | ||||
| - Sales of goods and services | P11+P12+P131 | -5,284 | -5,163 | -5,113 | -4,938 | -4,705 | -5,296 | ||||
| Market output (sales of market establishments) | P11 | -877 | -905 | -978 | -1,048 | -1,137 | -1,245 | ||||
| Output for own final use | P12 | -58 | -58 | -38 | -33 | -33 | -21 | ||||
| Incidental sales and fees of non-market establishments | P131 | -4,349 | -4,200 | -4,097 | -3,857 | -3,535 | -4,031 | ||||
| Final consumption expenditure | P3 | 31,587 | 31,583 | 31,142 | 30,593 | 31,674 | 32,101 | ||||
| = Net expenditure on current goods and services | P3 excl. D632 | 26,631 | 26,625 | 25,901 | 25,550 | 26,479 | 26,985 | ||||
| + Social transfers in kind via market producers | D632 | 4,956 | 4,958 | 5,241 | 5,043 | 5,194 | 5,117 | ||||
| made up of | |||||||||||
| Individual consumption (= social transfers in kind) | P31 (= D63) | 21,814 | 21,497 | 21,363 | 20,862 | 21,582 | 21,726 | ||||
| Social transfers in kind (via market producers) | D632 | 4,956 | 4,958 | 5,241 | 5,043 | 5,194 | 5,117 | ||||
| Social transfers in kind (provided directly by government) | D631 | 16,858 | 16,539 | 16,122 | 15,819 | 16,387 | 16,610 | ||||
| Collective consumption (= actual final consumption of government) | P32 | 9,773 | 10,086 | 9,779 | 9,731 | 10,092 | 10,375 | ||||
| Total social transfers | D62 + D63 | 45,633 | 45,366 | 45,598 | 44,402 | 44,596 | 44,858 | ||||
| Social benefits in cash | D62 | 23,818 | 23,868 | 24,235 | 23,540 | 23,014 | 23,132 | ||||
| Social transfers in kind (= individual consumption) | D63 | 21,814 | 21,497 | 21,363 | 20,862 | 21,582 | 21,726 | ||||
| Table 5 General Government financial transactions | ||||||||||||
| €million | ||||||||||||
| Description | ESA2010 code | 2010 | 2011 | 2012 | 2013 | 2014 | 2015 | |||||
| Net lending (+) / net borrowing (-) | B.9 | -53,677 | -21,842 | -14,014 | -10,193 | -7,197 | -4,786 | |||||
| equals | ||||||||||||
| Net acquisition of financial assets | ΔA | -11,638 | 3,665 | 6,059 | -5,526 | -18,856 | -7,284 | |||||
| EDP debt instruments | F2 + F3 + F4 | -8,984 | -71 | 4,380 | -4,381 | -19,508 | -7,314 | |||||
| Currency and deposits | F2 | -11,288 | -651 | 5,838 | -1,258 | -6,232 | -505 | |||||
| Debt securities | F3 | 1,857 | -648 | 957 | -757 | -1,429 | -5,834 | |||||
| Short-term | F31 | -37 | -36 | 1,034 | 2,697 | -1,373 | -1,184 | |||||
| Long-term | F32 | 1,894 | -612 | -77 | -3,454 | -56 | -4,650 | |||||
| Loans | F4 | 447 | 1,228 | -2,415 | -2,366 | -11,847 | -975 | |||||
| Short-term loans | F41 | 0 | 885 | 1,069 | 349 | -788 | -530 | |||||
| Long-term loans | F42 | 447 | 343 | -3,484 | -2,715 | -11,059 | -445 | |||||
| Equity and Investment Fund Shares | F5 | -2,388 | 3,703 | 1,826 | -1,307 | -91 | 240 | |||||
| Other financial assets | F6 + F7 + F8 | -266 | 33 | -147 | 162 | 743 | -210 | |||||
| Insurance, Pensions and Standardised Guarantees | F6 | 0 | 0 | -1 | 0 | 1 | -1 | |||||
| Financial derivatives and Employee Stock Options | F7 | 254 | -271 | -76 | 196 | 97 | -367 | |||||
| Other accounts receivable/payable | F8 | -520 | 304 | -70 | -34 | 645 | 158 | |||||
| less | ||||||||||||
| Net incurrence of liabilities | ΔL | 42,039 | 25,507 | 20,073 | 4,667 | -11,659 | -2,498 | |||||
| EDP debt instruments | F2 + F3 + F4 | 40,927 | 25,143 | 19,700 | 5,538 | -12,529 | -2,806 | |||||
| Currency and deposits | F2 | 3,422 | 2,893 | 3,802 | -30,707 | -10,474 | -247 | |||||
| Debt securities | F3 | 6,254 | -9,054 | -7,379 | 25,610 | 6,172 | 5,796 | |||||
| Short-term | F31 | -13,175 | -3,494 | -1,271 | -168 | 1,408 | -2,326 | |||||
| Long-term | F32 | 19,429 | -5,560 | -6,108 | 25,778 | 4,764 | 8,122 | |||||
| Loans | F4 | 31,251 | 31,304 | 23,277 | 10,635 | -8,227 | -8,355 | |||||
| Short-term loans | F41 | 40 | -173 | 1,328 | -486 | -114 | -208 | |||||
| Long-term loans | F42 | 31,211 | 31,477 | 21,949 | 11,121 | -8,113 | -8,147 | |||||
| Other liabilities | F5 + F6 + F7 + F8 | 1,112 | 364 | 373 | -871 | 870 | 308 | |||||
| Equity and Investment Fund Shares | F5 | 0 | 0 | 0 | 0 | 0 | 0 | |||||
| Insurance, Pensions and Standardised Guarantees | F6 | 0 | 0 | 1 | -1 | 0 | 0 | |||||
| Financial derivatives and Employee Stock Options | F7 | 0 | 3 | 1 | -1 | -1 | 0 | |||||
| Other accounts receivable/payable | F8 | 1,112 | 361 | 371 | -869 | 871 | 308 | |||||
| Table 6 General Government: detailed breakdown of net worth | |||||||||||||
| €million | |||||||||||||
| Description | ESA2010 code | 2010 | 2011 | 2012 | 2013 | 2014 | 2015 | ||||||
| General Government balance sheet | |||||||||||||
| Net worth at market value, excluding pension liabilities | NW | 6,015 | -19,609 | -49,407 | -55,126 | -58,361 | -49,561 | ||||||
| equals | |||||||||||||
| Non-financial assets at market value | NFA | 84,392 | 85,016 | 87,371 | 90,081 | 95,053 | 100,877 | ||||||
| plus | |||||||||||||
| Financial net worth at market value, excluding pension liabilities | FNW | -78,377 | -104,625 | -136,778 | -145,207 | -153,414 | -150,438 | ||||||
| equals | |||||||||||||
| Financial assets at market value | FA | 62,231 | 88,281 | 93,068 | 94,806 | 84,342 | 84,810 | ||||||
| EDP debt instruments | F2 + F3 + F4 | 33,516 | 55,168 | 58,718 | 54,590 | 36,808 | 29,602 | ||||||
| Currency and deposits | F2 | 19,662 | 19,284 | 25,283 | 24,022 | 17,863 | 17,579 | ||||||
| Debt securities | F3 | 10,114 | 7,919 | 9,470 | 10,249 | 9,646 | 3,289 | ||||||
| Short-term | F31 | 49 | 13 | 1,046 | 3,744 | 2,369 | 1,184 | ||||||
| Long-term | F32 | 10,065 | 7,907 | 8,424 | 6,505 | 7,277 | 2,104 | ||||||
| Loans | F4 | 3,740 | 27,965 | 23,965 | 20,319 | 9,299 | 8,734 | ||||||
| Short-term loans | F41 | 0 | 885 | 1,954 | 2,303 | 1,516 | 986 | ||||||
| Long-term loans | F42 | 3,740 | 27,081 | 22,011 | 18,016 | 7,783 | 7,748 | ||||||
| Equity and Investment Fund Shares | F5 | 20,130 | 22,975 | 25,098 | 30,795 | 38,202 | 45,259 | ||||||
| Other financial assets | F6 + F7 + F8 | 8,585 | 10,138 | 9,252 | 9,421 | 9,332 | 9,949 | ||||||
| Insurance, Pensions and Standardised Guarantees | F6 | 1 | 1 | 0 | 0 | 1 | 0 | ||||||
| Financial derivatives and Employee Stock Options | F7 | 606 | 1,694 | 897 | 1,135 | 352 | 812 | ||||||
| Other accounts receivable/payable | F8 | 7,978 | 8,443 | 8,355 | 8,286 | 8,979 | 9,137 | ||||||
| less | |||||||||||||
| Liabilities at market value | L | 140,608 | 192,906 | 229,846 | 240,013 | 237,756 | 235,248 | ||||||
| EDP debt instruments | F2 + F3 + F4 | 132,998 | 181,857 | 218,596 | 231,503 | 228,849 | 225,423 | ||||||
| Currency and deposits | F2 | 13,711 | 58,388 | 62,099 | 31,356 | 20,918 | 20,713 | ||||||
| Debt securities | F3 | 84,112 | 85,194 | 94,295 | 126,293 | 142,394 | 146,741 | ||||||
| Short-term | F31 | 7,231 | 3,796 | 2,580 | 2,423 | 3,785 | 1,188 | ||||||
| Long-term | F32 | 76,881 | 81,398 | 91,715 | 123,870 | 138,609 | 145,552 | ||||||
| Loans | F4 | 35,175 | 38,275 | 62,202 | 73,854 | 65,537 | 57,969 | ||||||
| Short-term loans | F41 | 731 | 558 | 1,885 | 1,434 | 1,295 | 1,055 | ||||||
| Long-term loans | F42 | 34,444 | 37,717 | 60,316 | 72,420 | 64,243 | 56,909 | ||||||
| Other liabilities | F5 + F6 + F7 + F8 | 7,610 | 11,049 | 11,250 | 8,510 | 8,907 | 9,825 | ||||||
| Equity and Investment Fund Shares | F5 | 0 | 0 | 0 | 0 | 0 | 0 | ||||||
| Insurance, Pensions and Standardised Guarantees | F6 | 0 | 0 | 1 | 0 | 0 | 0 | ||||||
| Financial derivatives and Employee Stock Options | F7 | 38 | 2,974 | 2,802 | 932 | 457 | 1,068 | ||||||
| Other accounts receivable/payable | F8 | 7,572 | 8,075 | 8,447 | 7,578 | 8,450 | 8,757 | ||||||
| Memo: Estimated pension liabilities of government | 116,000 | 116,000 | 98,000 | 98,000 | 98,000 | 98,000 | |||||||
| Memo: Net worth, including pension liabilities | -109,985 | -135,609 | -147,407 | -153,126 | -156,361 | -147,561 | |||||||
| Contingent liabilities | 149,355 | 3,576 | 119,131 | 59,723 | 29,253 | 16,862 | |||||||
| Guarantees | 145,880 | 0 | 115,555 | 56,020 | 25,145 | 12,604 | |||||||
| Off-balance sheet PPPs | 3,475 | 3,576 | 3,576 | 3,703 | 4,108 | 4,258 | |||||||
| Memo: Net worth, including pension liabilities and contingent liabilities | -259,340 | -139,185 | -266,538 | -212,848 | -185,614 | -164,422 | |||||||
| Change in net worth of government | |||||||||||||
| Opening net worth | 46,883 | 6,015 | -19,609 | -49,407 | -55,126 | -58,361 | |||||||
| Change in net worth due to transactions | -51,380 | -20,870 | -13,762 | -10,570 | -6,398 | -4,007 | |||||||
| Net acquisition of non-financial assets | P5 + NP - P51c | 2,298 | 972 | 252 | -377 | 798 | 779 | ||||||
| Net lending/net borrowing | B9 | -53,677 | -21,842 | -14,014 | -10,193 | -7,197 | -4,786 | ||||||
| = Net acquisition of financial assets | -11,638 | 3,665 | 6,059 | -5,526 | -18,856 | -7,284 | |||||||
| - Net incurrence of liabilities | -42,039 | -25,507 | -20,073 | -4,667 | 11,659 | 2,498 | |||||||
| Change in net worth due to other economic flows | Kx | 10,511 | -4,754 | -16,036 | 4,852 | 3,163 | 12,807 | ||||||
| Other changes in non-financial assets | -6,332 | -348 | 2,103 | 3,087 | 4,173 | 5,045 | |||||||
| Other changes in financial net worth | 16,843 | -4,406 | -18,139 | 1,764 | -1,010 | 7,762 | |||||||
| = Other changes in financial assets | 474 | 22,385 | -1,272 | 7,264 | 8,392 | 7,752 | |||||||
| EDP debt instruments | -183 | 21,723 | -830 | 253 | 1,726 | 108 | |||||||
| Equity and Investment Fund Shares | 730 | -858 | 297 | 7,004 | 7,498 | 6,817 | |||||||
| Other financial assets | -73 | 1,520 | -739 | 7 | -832 | 827 | |||||||
| - Other changes in liabilities | 16,369 | -26,791 | -16,867 | -5,500 | -9,402 | 10 | |||||||
| EDP debt instruments | 16,391 | -23,716 | -17,039 | -7,369 | -9,875 | 620 | |||||||
| Other liabilities | -22 | -3,075 | 172 | 1,869 | 473 | -610 | |||||||
| Closing net worth | 6,015 | -19,609 | -49,407 | -55,126 | -58,361 | -49,561 | |||||||
| Table 7 General Government Gross and Net Debt | ||||||||||
| €million | ||||||||||
| Description | ESA2010 code | 2010 | 2011 | 2012 | 2013 | 2014 | 2015 | |||
| General Government Debt | ||||||||||
| Debt instrument liabilities at market value | 132,998 | 181,857 | 218,596 | 231,503 | 228,849 | 225,423 | ||||
| + Difference between face value and market value | 11,229 | 7,850 | -8,610 | -16,205 | -25,550 | -24,289 | ||||
| Gross General Government Debt (face value) | GGDebt | 144,227 | 189,707 | 209,986 | 215,298 | 203,299 | 201,134 | |||
| By category: | ||||||||||
| Currency and deposits | F2 | 13,708 | 58,386 | 62,092 | 31,356 | 20,918 | 20,713 | |||
| Debt securities | F3 | 96,381 | 94,013 | 87,297 | 112,665 | 119,078 | 125,565 | |||
| Short-term | F31 | 7,203 | 3,777 | 2,535 | 2,389 | 3,760 | 1,182 | |||
| Long-term | F32 | 89,178 | 90,236 | 84,762 | 110,276 | 115,318 | 124,383 | |||
| Loans | F4 | 34,138 | 37,308 | 60,597 | 71,277 | 63,303 | 54,856 | |||
| Short-term | F41 | 731 | 558 | 1,884 | 1,441 | 1,294 | 1,050 | |||
| Long-term | F42 | 33,407 | 36,750 | 58,713 | 69,836 | 62,010 | 53,805 | |||
| less EDP debt instrument assets | F2 + F3 + F4 | 33,516 | 55,170 | 58,718 | 54,590 | 36,808 | 29,601 | |||
| By category: | ||||||||||
| Currency and deposits | F2 | 19,662 | 19,284 | 25,283 | 24,022 | 17,863 | 17,579 | |||
| Debt securities | F3 | 10,114 | 7,920 | 9,470 | 10,249 | 9,646 | 3,288 | |||
| Short-term | F31 | 49 | 13 | 1,046 | 3,744 | 2,369 | 1,184 | |||
| Long-term | F32 | 10,065 | 7,907 | 8,424 | 6,505 | 7,277 | 2,104 | |||
| Loans | F4 | 3,740 | 27,966 | 23,965 | 20,319 | 9,299 | 8,734 | |||
| Short-term | F41 | 0 | 885 | 1,954 | 2,303 | 1,516 | 986 | |||
| Long-term | F42 | 3,740 | 27,081 | 22,011 | 18,016 | 7,783 | 7,748 | |||
| Net General Government Debt (face value) | GGNetDebt | 110,711 | 134,537 | 151,268 | 160,708 | 166,491 | 171,533 | |||
| By category: | ||||||||||
| Currency and deposits | F2 | -5,954 | 39,102 | 36,809 | 7,334 | 3,055 | 3,134 | |||
| Debt securities | F3 | 86,267 | 86,093 | 77,827 | 102,416 | 109,432 | 122,277 | |||
| Short-term | F31 | 7,154 | 3,764 | 1,489 | -1,355 | 1,391 | -2 | |||
| Long-term | F32 | 79,113 | 82,329 | 76,338 | 103,771 | 108,041 | 122,279 | |||
| Loans | F4 | 30,398 | 9,342 | 36,632 | 50,958 | 54,004 | 46,122 | |||
| Short-term | F41 | 731 | -327 | -70 | -862 | -222 | 64 | |||
| Long-term | F42 | 29,667 | 9,669 | 36,702 | 51,820 | 54,227 | 46,057 | |||
| Table 8 Reconciliation of Exchequer Balance to General Government Deficit | |||||||
| € million | |||||||
| Description | ESA2010 code | 2010 | 2011 | 2012 | 2013 | 2014 | 2015 |
| Exchequer balance | -18,745 | -24,918 | -14,892 | -11,503 | -8,189 | -62 | |
| Deduct cash inflows which do not increase financial net worth | -382 | -62 | -13 | -2,697 | -4,308 | -9,164 | |
| Inflows from sale or redemption of financial assets | -382 | -62 | -13 | -2,693 | -4,294 | -9,164 | |
| Incurrence of Exchequer liability to Central Bank for notes and coins in circulation | 0 | 0 | 0 | -5 | -13 | 0 | |
| Exclude cash outflows which do not reduce financial net worth | 650 | 7,335 | 2,267 | 2,316 | 4,612 | 4,921 | |
| Acquisition of financial assets | 642 | 4,818 | 2,267 | 2,303 | 4,599 | 4,676 | |
| Repayment of promissory notes notional loan principal | 0 | 2,517 | 0 | 13 | 13 | 234 | |
| Redemption of Exchequer liability to Central Bank for notes and coins in circulation | 9 | 0 | 0 | 0 | 0 | 10 | |
| Impact on financial net worth of Exchequer cash transactions | -18,477 | -17,645 | -12,638 | -11,885 | -7,884 | -4,305 | |
| Adjust for impact of non-cash revenue and disposals of non-financial asset (+) | -174 | 726 | -639 | 813 | 409 | 153 | |
| Difference between Exchequer cash tax revenue and time-adjusted Revenue Net Receipts | -12 | 562 | -178 | 161 | 473 | 237 | |
| Receipts due from EU (Agriculture grants, Cohesion Fund, ESF and ERDF) | -162 | 36 | -11 | -41 | -87 | -134 | |
| Accrual of interest due on contingent capital assets assigned to banks | 0 | 128 | 0 | -45 | 0 | 10 | |
| Licence sales | 0 | 0 | -450 | 738 | 23 | 40 | |
| Other accrued revenue | 0 | 0 | 0 | 0 | 0 | 0 | |
| Adjust for impact of non-cash expenditure (-) | -33,224 | 361 | -314 | 169 | -129 | 377 | |
| Capital transfers to financial institutions financed by promissory notes | -30,850 | 0 | 0 | 12 | 12 | 16 | |
| Difference between interest paid and accrued | -1,328 | 94 | -309 | 59 | 179 | 281 | |
| Difference between Exchequer cash issues and accrued net spending of departments and offices | 318 | 102 | -133 | -4 | 198 | -135 | |
| Other accrued expenditure | -1,364 | 164 | 128 | 101 | -517 | 215 | |
| Surplus/Deficit of Exchequer | B9_exchequer | -51,875 | -16,559 | -13,592 | -10,903 | -7,604 | -3,776 |
| Surplus/Deficit of extra-budgetary bodies, funds and accounts consolidated with Exchequer | -383 | -369 | 115 | -136 | 148 | 92 | |
| Social Insurance Fund | -831 | -192 | -1 | -11 | 83 | 32 | |
| Bank & Deposit Guarantee Schemes | -330 | -106 | -99 | -191 | -12 | -19 | |
| Capital Services Redemption Account | 600 | -600 | 0 | 0 | 0 | 0 | |
| Small Savings Reserve Fund | 0 | 0 | 0 | 0 | 0 | 0 | |
| Other Extra-Budgetary Funds | 11 | 374 | 296 | 55 | 17 | 166 | |
| Health Service Executive | 167 | 155 | -82 | 11 | 60 | -87 | |
| Surplus/Deficit of Budgetary Central Government | B9_bcg | -52,259 | -16,928 | -13,477 | -11,039 | -7,456 | -3,684 |
| Surplus/Deficit of other Central Government bodies | -1,412 | -4,767 | -452 | 847 | 286 | -1,799 | |
| National Pensions Reserve Fund | -1,702 | -4,373 | 334 | 431 | 221 | -1,471 | |
| Non-market State corporations and agencies | 288 | -384 | -779 | 382 | 61 | -331 | |
| Voluntary and joint board hospitals | 2 | -9 | -6 | 34 | 4 | 3 | |
| Surplus/Deficit of Central Government | B9_S1311 | -53,671 | -21,695 | -13,929 | -10,193 | -7,170 | -5,483 |
| Surplus/Deficit of Local Government | B9_S1313 | -6 | -147 | -85 | -1 | -27 | 697 |
| Surplus/Deficit of General Government | B9_S13 | -53,677 | -21,842 | -14,014 | -10,193 | -7,197 | -4,786 |
Introduction
This release comprises the latest official publication by CSO of annual Government Finance Statistics results for years 2010 to 2015. The data in this release are subject to the normal EDP verification process by Eurostat until 21st October 2016 and are therefore provisional.
The full suite of Government Finance Statistics tables are also available on the CSO’s website by following the link:
http://www.cso.ie/en/statistics/nationalaccounts/governmentfinancestatistics/
The data published in this series are consistent with the General Government Deficit and Debt levels reported at end-September 2016 under the EU regulation governing the Excessive Deficit Procedure (EDP). Consequently they may not always be fully aligned with the National Income and Expenditure and related publications such as the Institutional Sector Accounts.
The official publication by Eurostat of deficit and debt levels for all EU member states is due on 21st October 2016.
Significant events that impact Deficit/Debt
Share Transactions
In Quarter 1 2015 the Ireland Strategic Investment Fund transferred €1,634 million to the exchequer. These funds related to the disposal of its preference share holding in Bank of Ireland.
In Quarter 2 2015 Permanent TSB (PTSB) repurchased contingent capital notes issued in 2011, for which the State received €410.5 million. At around the same time the State sold shares which it held in PTSB at a value of €97 million. The proceeds of both transactions were recorded in the Exchequer statement.
In Quarter 4 2015 the Ireland Strategic Investment Fund redeemed part of its preference shares in AIB for the sum of €1,700 million. At the same time the balance of its preference shares were converted to ordinary shares, and the promissory note issued to EBS in 2010 was paid off in full. The net proceeds of these transactions were recorded in the December Exchequer Statement.
For National Accounts purposes the net inflows to the Exchequer arising from all of the above transactions are not treated as revenue as they are simply the exchange of one asset (equity or securities) for cash or another form of financial asset. Therefore they have no impact on the General Government Deficit. The Balance sheet of Government shows changes in the relevant instrument categories resulting from these transactions.
The conversion of the preference shares to ordinary shares has been determined to be a capital transfer (expenditure) rather than a reinvestment of capital. This determination was made by Eurostat during the EDP clarification process based on AIB losses incurred since the last capital injection was made in 2012 and on the uncertainty of a return on the investment when compared to the guaranteed return on the preference shares previously held.
Repayment of water-related loans by central government
In Quarter 3 2015 the amount of €423 million was transferred from the Exchequer to local authorities to allow them redeem loans from the Housing Finance Agency related to water services assets. The assets in question had transferred to Irish Water while the legal title to the loans remained with the local authorities. This payment was treated as a capital transfer to local government from central government, resulting in an improvement of the local government balance for 2015 and a corresponding worsening of the central government balance, resulting in a zero impact at the General Government level as a result of this transaction. A further amount of approximately €147m in loans related to water services assets are also due for repayment by the Minister. Full details will not be reflected in the release until the local authority 2015 annual financial statements become available.
Government support for financial institutions
The EDP notification for all EU member states since 2009 has included tables analysing the impact on the government revenue, expenditure and balance sheet of interventions taken as a result of the financial crisis. The tables for Ireland are available on the CSO website and summary details are shown in Tables 1 of this release. There are a number of changes in the calculation of these tables from 2016.
Firstly, Eurostat have broadened the scope of these tables to include not only government interventions as a result of the financial crisis, but any government support for financial institutions. Consequently, the tables for Ireland now include the revenue and expenditure impact of the Risk Equalisation Fund and the Credit Institutions Resolution Fund.
Secondly, the approach taken to the compilation of the balance sheet component of these tables has now been revised due to updated instructions from Eurostat. Previously the approach taken in Ireland had been to present this balance sheet information as the difference between the actual position and what would have notionally been the case if the relevant government interventions had not taken place. This gave rise to negative stock positions being recorded. In line with the updated instructions for these tables, the calculation of the balance sheet element has now been revised so as to report only positive (or zero) stock positions. In summary the approach taken is as follows:
Other changes since the last release
Revisions to General Government Deficit/Surplus (GG Deficit/Surplus)
Estimates of the GG Deficit for 2015 have been revised since March 2016 with an improvement in the deficit of €151 million. This is mainly the result of the availability of further data from annual reports of government bodies which were not available at the time of the March notification.
Revisions to GDP
The GDP figures used in the current publication are consistent with those published in the National Income and Expenditure 2015 and the latest Quarterly National Accounts publication.
Register of Public Sector Bodies
The CSO is required to define the scope of the public sector (which includes the General Government Sector) for the official reporting of Ireland’s General Government Deficit/Surplus, Government Debt, and other Government Finance Statistics. In this context, the public sector includes all bodies that are directly or indirectly controlled by a Government department or office, or by a local authority. General Government, in turn, includes all public sector bodies that are also mainly financed by Government bodies. The decision rules governing the classification of bodies to the public and General Government sectors are set out in detail in Eurostat’s Manual on Government Deficit and Debt (MGDD).
The CSO’s Register of Public Sector bodies is updated twice a year to coincide with the submission of government deficit and debt figures to Eurostat under the Excessive Deficit Procedure. It reflects any changes in the composition of the government sector since the previous update.
Copies of documents relating to classification decisions can be seen at:
http://www.cso.ie/en/surveysandmethodology/nationalaccounts/classificationdecisions/
A detailed explanation of the application of these rules and the most up-to-date list of public sector bodies (including general government bodies) for Ireland is also shown at this link.
Contingent Liabilities
(a) Public Private Partnerships (PPPs)
The figures included in Table 6 for the value of off-balance sheet PPPs reflect nominal design and construction value.
(b) Guarantees
This item refers to the stock of debt of non-government bodies guaranteed by government and is based on Statement 1.11 of the Finance Accounts.
(c) Pension Liabilities
The estimated pension liability of government (the accrued liability in respect of Public Service occupational pensions) is a contingent liability of government and does not form part of the ESA accounts of general government. It is shown in this release as a memorandum item. The value shown for years 2009-2011 of €116 billion was calculated by the Comptroller and Auditor General. The value of this liability is reduced by €18 billion to €98 billion with effect from 2012. This follows an actuarial valuation carried out by the Department of Public Service and Reform. The main reasons for the reduction were the pay and pension cuts since 2009 and the freeze in pay and pension rates until after the Haddington Road Agreement. Details on this updated estimate can be accessed at:
http://www.per.gov.ie/public-service-pensions-accrued-liability/.
Government Finance Statistics – Concepts and Definitions
Government Finance Statistics (GFS) form the basis for fiscal monitoring in Europe, in particular in relation to the Excessive Deficit Procedure (EDP).
European GFS, including EDP statistics are produced according to the legally binding accounting rules of the European System of Accounts (ESA2010). The Manual on Government Debt and Deficit (MGDD) provides further guidance on the implementation of ESA 2010 in the context of GFS.
EU Member States are required to report government deficit/surplus and debt data biannually under the EDP (before 1 April and 1 October in year N) for years N-4 to N-1 calendar years as well as a forecast for the current year. The data are reported in harmonised tables, which provide a consistent framework for the presentation of this data by Member States. The tables provide a structure for linking national budgetary aggregates with government deficit and debt.
In addition to the EDP transmission programme, detailed statistics on Government revenue and expenditure are also provided to Eurostat under the ESA transmission programme. For annual data the main tables reported are:
Table 0200 Revenue and Expenditure of general government
Table 2700 Quarterly financial accounts for general government
Table 2800 Quarterly government debt
These data are available on the Eurostat website.
http://ec.europa.eu/eurostat/web/government-finance-statistics/data/main-tables
Definition of General Government and its subsectors
The General Government sector of the economy, is defined in ESA2010 paragraph 2.111: as “institutional units which are non-market producers whose output is intended for individual and collective consumption, and are financed by compulsory payments made by units belonging to other sectors, and institutional units principally engaged in the redistribution of national income and wealth.” General government comprises the sub-sectors central government (S.1311), state government (S.1312 – which does not apply in Ireland), local government (S.1313), and social security funds (S.1314 – which does not apply in Ireland).
General Government Deficit/Surplus (GG Deficit/Surplus) is the standard European measure of the fiscal balance, which is used to monitor compliance with the Stability and Growth Pact.
This measure is by definition equal to both Total Revenue (TR) less Total Expenditure (TE), and Net Acquisition of Financial Assets less Net Incurrence of Liabilities. In order to respect this accounting identity, a technical adjustment is made to the level of transactions recorded in liability category F32 (long-term debt securities) to eliminate any statistical discrepancy between the two approaches to the calculation of GG Deficit/Surplus. This adjustment has no impact on gross debt, net debt or net worth.
General Government Gross Debt (GG Debt) is defined in the EU regulations implementing the Maastricht Treaty as the gross debt liabilities of the consolidated General Government sector, at nominal value.
‘Gross’ means that the value of any financial assets held by General Government cannot be deducted from the GG Debt. In Ireland’s case, this means that the liquid assets which are deducted from the ‘gross’ National Debt in arriving at the audited National Debt cannot be deducted from the GG Debt.
‘Debt liabilities’ are defined as the ESA 2010 categories AF.2 (Currency and Deposits), AF.3 (Debt Securities), and AF.4 (Loans).
This definition excludes liabilities in derivatives, equity liabilities, pension and insurance liabilities and accounts payable.
‘Consolidated’ means that any money owed by one entity within General Government to another is excluded from the total GG Debt.
‘Nominal value’ is defined in the governing regulation as face value. If debt is sold at a discount, it is the undiscounted value of the instrument, rather than the amount actually received, that is shown in the GG Debt. In other statistical contexts, ‘nominal value’ means face value plus any interest accrued but not paid; however, such interest is excluded from GG Debt by definition.
General Government Net Debt is a measure produced in accordance with the methodology of the IMF/World Bank Public Sector Debt Statistics Guide, by subtracting from the GG Gross Debt figure the value of the financial assets corresponding to the categories of financial liabilities which comprise GG Gross Debt.
General Government Net Worth is calculated as the sum of financial and non-financial assets of General Government less financial liabilities.
Detailed codes and technical definitions can be seen in the ESA 2010 manual available at
A listing of some of the main items included in this release is shown below
Main Components of General Government Expenditure and Revenue
P.2 Intermediate consumption – value of goods and services used in the process of production, excluding fixed assets
P.5 Gross capital formation
P.51g Gross fixed capital formation - acquisitions, less disposals, of fixed assets during a given period plus certain additions to the value of non-produced assets realised by productive activity. Fixed assets are tangible or intangible assets produced as outputs from processes of production that are themselves used repeatedly, or continuously, in processes of production for more than one year
P.51c Consumption of fixed capital - the amount of fixed assets used up, during the period under consideration, as a result of normal wear and tear and foreseeable obsolescence, including a provision for losses of fixed assets as a result of accidental damage which can be insured against.
P.52 Changes in inventories
P.53 Acquisitions less disposals of valuables
D.1 Compensation of employees – the total remuneration of government employees
D.29 Other taxes on production (payable) all taxes that enterprises incur as a result of engaging in production, independently of the quantity or value of the goods and services produced or sold. These include taxes on use or ownership of land or buildings, taxes on use of fixed assets, taxes on total wage bill and payroll, taxes on international transactions related to production.
D.3 Subsidies (payable) - current unrequited payments which general government or the institutions of the European Union make to resident producers, with the objective of influencing their levels of production, their prices or the remuneration of the factors of production
D.4 Property income accrues when the owners of financial assets and natural resources put them at the disposal of other units of the economy. The income payable for the use of financial assets is called investment income, while that payable for the use of a natural resource is called rent. Property income is the sum of investment income and rent.
D.41 Interest receivable by the owners of a financial asset for putting it at the disposal of another institutional unit - applies to deposits (AF.2), debt securities (AF.3), loans (AF.4) and other accounts payable (AF.8)
D.42 Dividends receivable by the owners of share equities. Dividends exclude "super dividends" which arise where the dividend paid is large relative to the recent level of dividends and earnings. Super dividends are recorded as withdrawal of equity (F.5). This arises, for example, in the case of dividends paid by the central bank in 2015.
D.5 Current taxes on income, wealth, etc, (payable) - all compulsory, unrequited payments, in cash or in kind, levied periodically by general government and by the rest of the world on the income and wealth of units in the economy, and some periodic taxes which are assessed neither on income nor wealth
D.6 Social contributions - transfers to households, in cash or in kind, intended to relieve them from the financial burden of a number of risks or needs.
D.7 Other current transfers – includes VAT and GNI based EU budget contributions, current transfers between subsectors of government, current international co-operation and current transfers to households and non-profit institutions.
D.9 Capital transfers - involve the acquisition or disposal of an asset, or assets, by at least one of the parties to the transaction. Includes capital taxes and investment grants.
Categories of Financial Flows
F.1 Monetary gold and special drawing rights (SDRs)
F.11 Monetary gold
F.12 Special drawing rights (SDRs)
F.2 Currency and deposits
F.21 Currency
F.22 Transferable deposits
F.29 Other deposits
F.3 Debt securities
F.31 Short-term
F.32 Long-term
F.4 Loans
F.41 - Short-term loans
F.42 - Long-term loans
F.5 Equity and investment fund shares
F.51 Equity
F.52 Investment fund shares/units
F.6 Insurance pension and standardised guarantee schemes
F.7 Financial derivatives and employee stock options
F.71 Financial derivatives
F.72 Employee stock options
F.8 Other accounts receivable/payable
F.81 Trade credits and advances
F.89 Other trade credits
 Hide Background Notes
Scan the QR code below to view this release online or go to
http://www.cso.ie/en/releasesandpublications/er/gfsa/governmentfinancestatisticsoctober2016/
 Show Table 1 General Government transactions: revenue, expenditure, financing and deficit
 Hide Table 1 General Government transactions: revenue, expenditure, financing and deficit