
This release has been compiled during the COVID-19 crisis. The results contained in this release reflect some of the economic impacts of the COVID-19 situation. For further information see Background notes.
| End of year | General Government | GDP | |||||
| Balance | Gross Debt | Net Debt | |||||
| €bn | % GDP | €bn | % GDP | €bn | % GDP | €bn | |
| 2015 | -5.1 | -1.9 | 201.7 | 76.7 | 172.8 | 65.7 | 262.9 |
| 2016 | -1.8 | -0.7 | 200.6 | 74.1 | 176.6 | 65.2 | 270.8 |
| 2017 | -1.0 | -0.3 | 201.3 | 67.0 | 175.7 | 58.5 | 300.4 |
| 2018 | 0.3 | 0.1 | 205.9 | 63.0 | 177.3 | 54.2 | 327.0 |
| 2019 | 1.8 | 0.5 | 204.2 | 57.4 | 175.4 | 49.3 | 356.1 |
| 2020 | -18.4 | -5.0 | 218.2 | 59.5 | 187.7 | 51.2 | 366.5 |
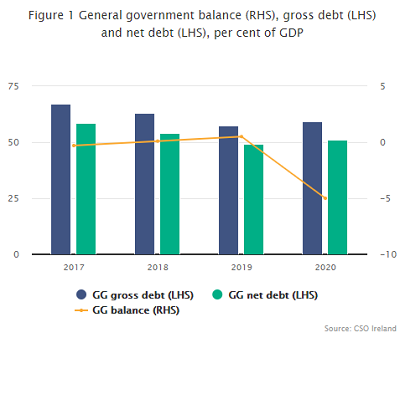
The general government deficit was €18.4bn in 2020, because of the impact of COVID-19 on both general government revenue and expenditure, especially the targeted government supports and public health measures. General government revenue was €85.8bn in 2020 while expenditure was €104.2bn, giving a deficit of €18.4bn (5.0% of GDP) compared with a surplus of €1.8bn in 2019 – see release Infographic.
The COVID-19 pandemic led to a drop of 3.9% in government revenues and a rise of 19.1% in government expenditure (Table 1).
Government revenues were €3.5bn lower than in 2019. Overall tax revenues were down €2.5bn (a 3.9% drop on 2019), with a fall of 12.5% in indirect taxes, mainly due to reduced VAT receipts and the waiving of commercial rates, compared with a rise of 2.6% in direct taxes (including corporation tax and income taxes) (Table 3).
The significant increase of €16.7bn (19.1%) in government expenditure in 2020 is due to COVID-19 measures. There was a rise of €11.3bn in subsidies (including the Temporary/Employment Wage Subsidy Scheme) and social transfers (including the Pandemic Unemployment Payment (PUP). Intermediate consumption rose by €2.0bn, mostly due to extra spending by the health sector, while current transfers increased by €0.6bn (Table 4).
Provisional estimates of COVID-19 expenditure
The table below is a preliminary estimate of the impact of COVID-19 on government expenditure. It is easy to see the impact of new measures, such as the PUP. Existing budgets were used (and supplemented) in order to deliver services in other areas. This table will be updated as more data becomes available from end-year accounts.
Table A: COVID-19 measures included in general government expenditure, €bn
| ESA 2010 Code | Measure | 2020 |
|---|---|---|
| D.39 | Temporary Wage Subsidy Scheme / Employee Wage Subsidy Scheme | 3.8 |
| D.62 | Pandemic Unemployment Payment | 5.0 |
| D.632 | Primary care and Overseas repatriation | 0.1 |
| D.7 | Restart Grant / Restart Grant Plus | 0.6 |
| D.7 | Covid Restrictions Support Scheme | 0.2 |
| D.7 | Other enterprise supports | 0.1 |
| P.2 | Health sector expenditure | 2.0 |
| P.2 | Other | 0.5 |
| P.51g | ICT expenditure | 0.8 |
| Total Expenditure | 13.1 |
See Background notes for further information.
Financing the deficit - general government debt 59.5% of GDP at end 2020
General government gross debt (the level of government borrowing) rose by almost €14bn to €218.2bn (Table 2). However the debt to GDP ratio remained just below the Stability and Growth Pact threshold of 60% due to the performance of GDP in the year. Not all of the increase in government spending was funded by borrowing - cash balances were available to Government in 2020. These include NAMA, which transferred €2.0bn to the Exchequer, and €1.5bn from the National Surplus (Exceptional Contingencies) Reserve Fund. (The Fund was established in 2019 capitalised by €1.5bn from the Ireland Strategic Investment Fund).
The market value of liabilities rose by €20bn at the end of 2020 compared with one year earlier (Table 6). This was mainly due to the issuance of bonds in order to fund the COVID-19 related expenditure. Loan liabilities fell, mainly due to the repayment of three tranches (€1.9bn) of the UK bilateral loan in 2020. (Each tranche is £0.4bn and the last one repaid in March 2021).
Financial assets (at market value) decreased by €2.7bn in 2020. This was composed mainly of a decrease in the value of equity of €3.7bn and an increase in currency and deposits of €1.3bn.
General government net debt rose by €12.2bn to €187.7bn (51.2% of GDP) at the end of 2020. Net debt takes account of the assets corresponding to Excessive Deficit Procedure (EDP) debt instruments, i.e. currency and deposits, securities other than shares, and loans (Tables 2 and 7).
|
Government accounts are compiled in the EU according to the European System of National Accounts2010 (ESA2010) framework. The detailed tables are aligned with the April 2021 Excessive Deficit Procedure notification. Revisions to previous years reflect updated data sources or changes in methodology - see Background notes. The main EDP notification tables for Ireland will be published on 22 April, the same day as the Eurostat release of EDP statistics. This will include details of government guarantees, PPPs and concessions and tables showing the impact on government accounts of government interventions in the financial sector. Annual Government Finance Statistics are benchmarked to the most recent EDP notification and so may not be fully aligned with the National Income and Expenditure and related publications, such as the Institutional Sector Accounts. The concepts and definitions used in this release are described in the background notes. GNI* is not yet available for 2020 but is included in Table 1 for the years 2015-2019. |
| Total Revenue | Total Expenditure | |
| 2015 | 27.4 | 29.3 |
| 2016 | 27.6 | 28.3 |
| 2017 | 26 | 26.3 |
| 2018 | 25.8 | 25.7 |
| 2019 | 25.1 | 24.6 |
| 2020 | 23.4 | 28.4 |
| Table 1 General Government transactions: revenue, expenditure, financing and deficit | ||||||||||
| €million | ||||||||||
| Description | ESA2010 code | 2015 | 2016 | 2017 | 2018 | 2019 | 2020 | |||
| General Government transactions | ||||||||||
| Revenue | TR | 71,931 | 74,778 | 78,103 | 84,361 | 89,247 | 85,759 | |||
| Taxes and social contributions | D2 + D5 + D91 + D61 | 63,074 | 65,974 | 69,636 | 75,511 | 80,506 | 77,898 | |||
| Taxes | D2 + D5 + D91 | 50,750 | 52,814 | 55,714 | 60,549 | 64,634 | 62,119 | |||
| Social contributions | D61 | 12,324 | 13,160 | 13,922 | 14,962 | 15,873 | 15,778 | |||
| Sales of goods and services | P1O | 5,376 | 5,466 | 5,584 | 5,935 | 5,963 | 5,440 | |||
| Investment income | D4 | 2,721 | 1,826 | 1,779 | 1,544 | 1,607 | 1,159 | |||
| Current transfer revenue (excluding taxes) | D7 | 451 | 512 | 660 | 797 | 711 | 688 | |||
| Capital transfer revenue (excluding taxes) | D9N | 310 | 1,001 | 444 | 573 | 461 | 576 | |||
| Expenditure | TE | 77,020 | 76,565 | 79,099 | 84,036 | 87,490 | 104,175 | |||
| Expense | Expense | 75,850 | 74,856 | 77,543 | 81,234 | 83,606 | 98,783 | |||
| Compensation of employees | D1 | 19,304 | 19,892 | 21,045 | 22,053 | 23,073 | 24,847 | |||
| Use of goods and services plus taxes payable | P2 + D5 + D29 | 9,560 | 10,083 | 10,448 | 11,216 | 12,634 | 14,657 | |||
| Depreciation (Consumption of fixed capital) | P51c | 3,479 | 3,691 | 3,906 | 4,163 | 4,462 | 4,462 | |||
| Interest (excluding FISIM) | D41 | 6,939 | 6,264 | 5,941 | 5,318 | 4,459 | 3,684 | |||
| Subsidies | D3 | 1,788 | 1,768 | 1,857 | 1,948 | 1,709 | 5,652 | |||
| Social benefits | D62 + D632 | 28,689 | 28,761 | 29,484 | 30,502 | 31,654 | 39,029 | |||
| Other current transfers | D7 | 2,596 | 2,952 | 3,159 | 3,778 | 3,720 | 4,323 | |||
| Capital transfers | D9 | 3,495 | 1,444 | 1,703 | 2,256 | 1,895 | 2,129 | |||
| Net operating balance | NOB | -3,920 | -78 | 560 | 3,127 | 5,642 | -13,023 | |||
| Net acquisition of non-financial assets | P5 + NP - P51c | 1,170 | 1,710 | 1,556 | 2,803 | 3,884 | 5,393 | |||
| General Government Surplus/Deficit | B9 | -5,090 | -1,787 | -996 | 324 | 1,758 | -18,416 | |||
| equals | ||||||||||
| Net acquisition of financial assets | ΔFA | -8,838 | -4,905 | -2,137 | 17,436 | 143 | -3,939 | |||
| Debt instruments | F2 + F3 + F4 | -7,096 | -5,151 | 1,625 | 3,152 | 134 | -1,500 | |||
| Equity and Investment Fund Shares | F5 | 241 | -382 | -4,496 | -1,238 | -2,351 | -1,293 | |||
| Other financial assets | F6 + F7 + F8 | -1,983 | 628 | 734 | 15,522 | 2,360 | -1,146 | |||
| less | ||||||||||
| Net incurrence of liabilities | ΔL | -3,748 | -3,118 | -1,141 | 17,112 | -1,615 | 14,477 | |||
| Debt instruments | F2 + F3 + F4 | -4,075 | -2,794 | -1,513 | 2,341 | -1,964 | 14,623 | |||
| Other liabilities | F5 + F6 + F7 + F8 | 327 | -324 | 372 | 14,771 | 349 | -146 | |||
| Memo: Net derivative flows on debt interest swap contracts | -240 | -275 | -223 | -200 | -137 | -62 | ||||
| General Government Surplus/Deficit (% of GDP) | -1.9 | -0.7 | -0.3 | 0.1 | 0.5 | -5.0 | ||||
| General Government Surplus/Deficit (% of GNI*) | -3.1 | -1.0 | -0.5 | 0.2 | 0.8 | .. | ||||
| GDP at current market prices | 262,853 | 270,809 | 300,387 | 326,986 | 356,051 | 366,506 | ||||
| GNI* | 162,657 | 174,732 | 186,217 | 198,702 | 213,708 | .. | ||||
| Government interventions to support financial institutions | ||||||||||
| Revenue (a+b+c+d) | 2,174 | 1,715 | 1,297 | 1,122 | 920 | 1,218 | ||||
| Guarantee fees receivable (a) | P131(part) | 53 | 45 | 5 | 0 | 0 | 0 | |||
| Interest receivable (b) | D4(part) | 505 | 135 | 49 | 71 | 49 | 39 | |||
| Dividends receivable (c) | D4(part) | 962 | 749 | 558 | 382 | 380 | 394 | |||
| Other (d) | P131(part) | 653 | 785 | 685 | 669 | 491 | 785 | |||
| Expenditure (e+f+g+h) | 4,005 | 1,729 | 1,620 | 1,790 | 1,471 | 1,402 | ||||
| Interest payable (e) | D4(part) | 1,207 | 1,047 | 897 | 783 | 687 | 630 | |||
| Capital injections recorded as deficit-increasing (capital transfer)(f) | D9(part) | 2,111 | 0 | 0 | 0 | 0 | 0 | |||
| Calls on guarantees (g) | D9(part) | 0 | 0 | 0 | 0 | 0 | 0 | |||
| Other (h) | various | 686 | 682 | 723 | 1,007 | 784 | 772 | |||
| Impact of the above interventions on General Government Surplus/Deficit | -1,830 | -14 | -322 | -668 | -550 | -184 | ||||
| General Government Surplus/Deficit excluding interventions to support financial institutions | -3,259 | -1,773 | -673 | 992 | 2,308 | -18,232 | ||||
| .. Data currently not available until NIE 2020 published | ||||||||||
| Table 2 General Government Net Worth, Gross and Net Debt | ||||||||||||
| €million | ||||||||||||
| Description | ESA2010 code | 2015 | 2016 | 2017 | 2018 | 2019 | 2020 | |||||
| General Government net worth | ||||||||||||
| Net worth at market value, excluding pension liabilities | NW | -51,469 | -46,801 | -37,031 | -32,302 | -21,989 | -39,322 | |||||
| equals | ||||||||||||
| Non-financial assets at market value | NFA | 99,017 | 105,318 | 111,862 | 119,605 | 129,292 | 134,685 | |||||
| plus | ||||||||||||
| Financial net worth at market value, excluding pension liabilities | FNW | -150,486 | -152,119 | -148,893 | -151,907 | -151,281 | -174,007 | |||||
| equals | ||||||||||||
| Financial assets at market value | FA | 83,313 | 79,093 | 79,394 | 91,974 | 94,705 | 92,038 | |||||
| EDP debt instruments | F2 + F3 + F4 | 28,898 | 24,000 | 25,573 | 28,640 | 28,788 | 30,507 | |||||
| Equity and Investment Fund Shares | F5 | 44,947 | 45,557 | 42,753 | 36,627 | 37,417 | 33,706 | |||||
| Other financial assets | F6 + F7 + F8 | 9,468 | 9,536 | 11,068 | 26,707 | 28,500 | 27,825 | |||||
| less | ||||||||||||
| Liabilities at market value | L | 233,799 | 231,212 | 228,287 | 243,881 | 245,986 | 266,045 | |||||
| EDP debt instruments | F2 + F3 + F4 | 223,231 | 221,046 | 218,233 | 219,212 | 221,477 | 241,800 | |||||
| Other liabilities | F5 + F6 + F7 + F8 | 10,568 | 10,166 | 10,054 | 24,669 | 24,509 | 24,245 | |||||
| Memo: Estimated pension liabilities of government * | 114,500 | 114,500 | 114,500 | 149,600 | 149,600 | 149,600 | ||||||
| Memo: Net worth, including pension liabilities | -165,969 | -161,301 | -151,531 | -181,902 | -171,589 | -188,922 | ||||||
| Contingent liabilities | 15,955 | 9,751 | 5,315 | 5,066 | 5,314 | 6,182 | ||||||
| Memo: Net worth, including pension liabilities and contingent liabilities | -181,924 | -171,052 | -156,845 | -186,968 | -176,904 | -195,105 | ||||||
| General Government: changes in net worth | ||||||||||||
| Opening net worth | -60,441 | -51,469 | -46,801 | -37,031 | -32,302 | -21,989 | ||||||
| Change in net worth due to transactions | -3,920 | -78 | 560 | 3,127 | 5,642 | -13,023 | ||||||
| Net acquisition of non-financial assets | P5 + NP - P51c | 1,170 | 1,710 | 1,556 | 2,803 | 3,884 | 5,393 | |||||
| Net lending/net borrowing | B9 | -5,090 | -1,787 | -996 | 324 | 1,758 | -18,416 | |||||
| Change in net worth due to other economic flows | Kx | 12,892 | 4,745 | 9,211 | 1,602 | 4,672 | -4,310 | |||||
| Other changes in non-financial assets | 4,097 | 4,591 | 4,989 | 4,940 | 5,803 | 0 | ||||||
| Other changes in financial assets | 8,931 | 685 | 2,438 | -4,856 | 2,588 | 1,272 | ||||||
| Other changes in liabilities | -136 | -531 | 1,784 | 1,518 | -3,720 | -5,582 | ||||||
| Closing net worth | -51,469 | -46,801 | -37,031 | -32,302 | -21,989 | -39,322 | ||||||
| General Government Debt (GGDebt) | ||||||||||||
| Debt instrument liabilities at market value | F2 + F3 + F4 | 223,231 | 221,046 | 218,233 | 219,212 | 221,477 | 241,800 | |||||
| + Difference between EDP face value and market value | -21,552 | -20,409 | -16,967 | -13,311 | -17,254 | -23,643 | ||||||
| Gross General Government Debt (EDP face value) | GGDebt | 201,679 | 200,637 | 201,266 | 205,901 | 204,223 | 218,157 | |||||
| less EDP debt instrument assets | F2 + F3 + F4 | -28,898 | -24,000 | -25,573 | -28,640 | -28,788 | -30,507 | |||||
| Net General Government Debt | GGNetDebt | 172,781 | 176,637 | 175,693 | 177,261 | 175,435 | 187,650 | |||||
| Closing Net Worth (% of GDP) | -19.6 | -17.3 | -12.3 | -9.9 | -6.2 | -10.7 | ||||||
| Gross General Government Debt (% of GDP) | 76.7 | 74.1 | 67.0 | 63.0 | 57.4 | 59.5 | ||||||
| Net General Government Debt (% of GDP) | 65.7 | 65.2 | 58.5 | 54.2 | 49.3 | 51.2 | ||||||
| Gross General Government Debt (% of GNI*) | 124.0 | 114.8 | 108.1 | 103.6 | 95.6 | .. | ||||||
| Net General Government Debt (% of GNI*) | 106.2 | 101.1 | 94.3 | 89.2 | 82.1 | .. | ||||||
| * The data from 2018 on has been updated based on the Estimates of Pension Liabilities 2018 published in February 2021 | ||||||||||||
| .. Data currently not available until NIE 2020 published | ||||||||||||
| Table 3 General Government: detailed classification of revenue and output | |||||||||||
| €million | |||||||||||
| Description | ESA2010 code | 2015 | 2016 | 2017 | 2018 | 2019 | 2020 | ||||
| Total Revenue | TR | 71,931 | 74,778 | 78,103 | 84,361 | 89,247 | 85,759 | ||||
| Taxes and social contributions | 63,074 | 65,974 | 69,636 | 75,511 | 80,506 | 77,898 | |||||
| Taxes | D2 + D5 + D91 | 50,750 | 52,814 | 55,714 | 60,549 | 64,634 | 62,119 | ||||
| Indirect taxes (taxes on production and imports) | D2 | 22,486 | 23,471 | 24,649 | 25,744 | 27,477 | 24,050 | ||||
| Taxes on products | D21 | 19,326 | 20,575 | 21,392 | 22,150 | 23,915 | 21,377 | ||||
| of which Value-Added Tax | D211 | 11,831 | 12,603 | 13,060 | 14,175 | 15,281 | 12,649 | ||||
| Other taxes on production | D29 | 3,160 | 2,896 | 3,257 | 3,593 | 3,562 | 2,673 | ||||
| Direct taxes | D5 | 27,863 | 28,932 | 30,616 | 34,287 | 36,626 | 37,564 | ||||
| Taxes on income, profits and capital gains | D51 | 26,599 | 27,893 | 29,601 | 33,291 | 35,646 | 36,602 | ||||
| Other current direct taxes | D59 | 1,263 | 1,039 | 1,016 | 996 | 980 | 962 | ||||
| Capital taxes | D91 | 401 | 411 | 448 | 518 | 531 | 505 | ||||
| Social contributions | D61 | 12,324 | 13,160 | 13,922 | 14,962 | 15,873 | 15,778 | ||||
| Actual social contributions | D611 + D613 | 10,525 | 11,024 | 11,672 | 12,716 | 13,808 | 13,634 | ||||
| PRSI receipts | D611 + D613(pt) | 8,527 | 9,248 | 9,834 | 10,649 | 11,702 | 11,386 | ||||
| Government employees' social contributions | D613(pt) | 1,998 | 1,776 | 1,838 | 2,067 | 2,105 | 2,248 | ||||
| Employers' imputed social contributions | D612 | 1,799 | 2,136 | 2,249 | 2,246 | 2,065 | 2,144 | ||||
| Sales of goods and services | P1O | 5,376 | 5,466 | 5,584 | 5,935 | 5,963 | 5,440 | ||||
| Sales of market establishments (= market output) | P11 | 1,131 | 1,238 | 1,361 | 1,477 | 1,619 | 1,749 | ||||
| Imputed sales related to production of own-use capital assets (= output for own final use) | P12 | 21 | 21 | 22 | 22 | 23 | 23 | ||||
| Incidental sales and fees of non-market establishments | P131 | 4,224 | 4,207 | 4,202 | 4,437 | 4,321 | 3,668 | ||||
| Investment income | D4 | 2,721 | 1,826 | 1,779 | 1,544 | 1,607 | 1,159 | ||||
| Interest (excluding FISIM) | D41 | 682 | 251 | 142 | 179 | 139 | 83 | ||||
| Dividends / Other investment income | D42 + D44 | 1,932 | 1,468 | 1,532 | 1,252 | 1,396 | 1,006 | ||||
| Rent of land and subsoil assets | D45 | 106 | 107 | 105 | 113 | 71 | 70 | ||||
| Current transfer revenue | D39 + D7 | 451 | 512 | 660 | 797 | 711 | 688 | ||||
| Subsidies | D39 | 0 | 0 | 0 | 0 | 0 | 0 | ||||
| Other current transfers | D7 | 451 | 512 | 660 | 797 | 711 | 688 | ||||
| Non-life insurance claims | D72 | 8 | 17 | 17 | 17 | 17 | 17 | ||||
| Other Domestic - Current | D7N_S1 | 261 | 306 | 353 | 408 | 464 | 615 | ||||
| From Rest of World - Current | D7N_S2 | 182 | 189 | 290 | 372 | 230 | 56 | ||||
| Capital transfer revenue | D9N | 310 | 1,001 | 444 | 573 | 461 | 576 | ||||
| Output | P1 | 32,824 | 34,221 | 36,047 | 38,188 | 41,030 | 44,960 | ||||
| Market output (sales of market establishments) | P11 | 1,131 | 1,238 | 1,361 | 1,477 | 1,619 | 1,749 | ||||
| Output for own final use | P12 | 21 | 21 | 22 | 22 | 23 | 23 | ||||
| Non-market output | P13 | 31,673 | 32,963 | 34,664 | 36,690 | 39,388 | 43,189 | ||||
| = Non-market compensation of employees | D1_nonmarket | 19,283 | 19,872 | 21,023 | 22,031 | 23,050 | 24,824 | ||||
| = Total compensation of employees | D1 | 19,304 | 19,892 | 21,045 | 22,053 | 23,073 | 24,847 | ||||
| - Compensation of employees of market establishments | D1_market | ||||||||||
| - Compensation related to production of own-use capital assets | D1_own-use | -21 | -21 | -22 | -22 | -23 | -23 | ||||
| + Non-market intermediate consumption | P2_nonmarket | 9,334 | 9,836 | 10,188 | 10,954 | 12,366 | 14,393 | ||||
| = Total intermediate consumption | P2 | 9,560 | 10,083 | 10,448 | 11,216 | 12,634 | 14,657 | ||||
| - Intermediate consumption of market establishments | P2_market | -225 | -247 | -260 | -263 | -268 | -264 | ||||
| - Intermediate consumption related to production of own-use capital assets | P2_own-use | ||||||||||
| + Non-market consumption of fixed capital | P51c_nonmarket | 3,055 | 3,255 | 3,452 | 3,705 | 3,972 | 3,972 | ||||
| = Total consumption of fixed capital | P51c | 3,479 | 3,691 | 3,906 | 4,163 | 4,462 | 4,462 | ||||
| - Consumption of fixed capital by market establishments | P51c_market | -424 | -437 | -453 | -458 | -490 | -490 | ||||
| - Consumption of fixed capital related to production of own-use capital assets | P51c_own-use | ||||||||||
| + Other taxes on production, payable | D29_pay | 0 | 0 | 0 | 0 | 0 | 0 | ||||
| - Other subsidies on production, receivable | D39_rec | 0 | 0 | 0 | 0 | 0 | 0 | ||||
| Table 4 General Government: detailed classification of expenditure and consumption | |||||||||||
| €million | |||||||||||
| Description | ESA2010 code | 2015 | 2016 | 2017 | 2018 | 2019 | 2020 | ||||
| Total Expenditure | TE | 77,020 | 76,565 | 79,099 | 84,036 | 87,490 | 104,175 | ||||
| Expense | 75,850 | 74,856 | 77,543 | 81,234 | 83,606 | 98,783 | |||||
| Compensation of employees | D1 | 19,304 | 19,892 | 21,045 | 22,053 | 23,073 | 24,847 | ||||
| Of which: Related to production of own-use capital assets | 21 | 21 | 22 | 22 | 23 | 23 | |||||
| Use of goods and services plus taxes payable | P2 + D5 + D29 | 9,560 | 10,083 | 10,448 | 11,216 | 12,634 | 14,657 | ||||
| Use of goods and services [Intermediate consumption] | P2 | 9,560 | 10,083 | 10,448 | 11,216 | 12,634 | 14,657 | ||||
| Of which: Intermediate consumption of market establishments | 225 | 247 | 260 | 263 | 268 | 268 | |||||
| Taxes, payable | D5 | 0 | 0 | 0 | 0 | 0 | 0 | ||||
| Depreciation (Consumption of fixed capital) | P51c | 3,479 | 3,691 | 3,906 | 4,163 | 4,462 | 4,462 | ||||
| Of which: Depreciation by market establishments | 424 | 437 | 453 | 458 | 490 | 490 | |||||
| Interest (excluding FISIM) | D41 | 6,939 | 6,264 | 5,941 | 5,318 | 4,459 | 3,684 | ||||
| Other domestic interest payable | D41_S1 | 2,542 | 2,356 | 2,243 | 1,923 | 1,456 | 1,670 | ||||
| Interest payable to rest of world | D41_S2 | 4,397 | 3,908 | 3,698 | 3,395 | 3,003 | 2,015 | ||||
| Subsidies | D3 | 1,788 | 1,768 | 1,857 | 1,948 | 1,709 | 5,652 | ||||
| Product subsidies | D31 | 864 | 909 | 930 | 994 | 986 | 1,059 | ||||
| Other subsidies on production | D39 | 924 | 858 | 927 | 954 | 723 | 4,592 | ||||
| Social benefits | D62 + D632 | 28,689 | 28,761 | 29,484 | 30,502 | 31,654 | 39,029 | ||||
| Social benefits in cash | D62 | 23,095 | 22,829 | 23,032 | 23,371 | 24,177 | 31,393 | ||||
| Social benefits in kind (via market producers) | D632 | 5,594 | 5,933 | 6,453 | 7,131 | 7,477 | 7,635 | ||||
| Other current transfers | D7 | 2,596 | 2,952 | 3,159 | 3,778 | 3,720 | 4,323 | ||||
| Net non-life insurance premiums | D71 | 55 | 52 | 52 | 52 | 52 | 52 | ||||
| Current international cooperation | D74 | 473 | 451 | 509 | 539 | 524 | 497 | ||||
| Miscellaneous current transfers | D75 | 561 | 598 | 866 | 813 | 870 | 1,164 | ||||
| VAT and GNI based EU budget contribution | D76 | 1,507 | 1,851 | 1,731 | 2,374 | 2,273 | 2,610 | ||||
| VAT-based EU own resources | D761 | 215 | 219 | 262 | 245 | 278 | 275 | ||||
| GNI-based EU own resources | D762 | 1,292 | 1,632 | 1,470 | 2,129 | 1,996 | 2,335 | ||||
| Capital transfers | D9 | 3,495 | 1,444 | 1,703 | 2,256 | 1,895 | 2,129 | ||||
| Investment grants | D92 | 1,305 | 1,443 | 1,667 | 2,015 | 1,875 | 2,129 | ||||
| Other capital transfers | D99 | 2,190 | 1 | 36 | 241 | 20 | 0 | ||||
| Net acquisition of non-financial assets | P5 + NP - P51c | 1,170 | 1,710 | 1,556 | 2,803 | 3,884 | 5,393 | ||||
| = Gross investment in non-financial assets | P5 + NP | 4,649 | 5,401 | 5,461 | 6,966 | 8,346 | 9,855 | ||||
| Gross fixed capital formation | P51 | 4,589 | 5,341 | 5,506 | 6,906 | 8,426 | 9,795 | ||||
| Net acquisition of stocks | P52 | 60 | 60 | 60 | 60 | 60 | 60 | ||||
| Net acquisition of unproduced assets | NP | 0 | 0 | -105 | 0 | -140 | 0 | ||||
| - Consumption of fixed capital | P51c | -3,479 | -3,691 | -3,906 | -4,163 | -4,462 | -4,462 | ||||
| Net expenditure on current goods and services | P3 excl. D632 | 27,449 | 28,755 | 30,462 | 32,253 | 35,067 | 39,520 | ||||
| = Output | P1 | 32,824 | 34,221 | 36,047 | 38,188 | 41,030 | 44,960 | ||||
| - Sales of goods and services | P11+P12+P131 | -5,376 | -5,466 | -5,584 | -5,935 | -5,963 | -5,440 | ||||
| Market output (sales of market establishments) | P11 | -1,131 | -1,238 | -1,361 | -1,477 | -1,619 | -1,749 | ||||
| Output for own final use | P12 | -21 | -21 | -22 | -22 | -23 | -23 | ||||
| Incidental sales and fees of non-market establishments | P131 | -4,224 | -4,207 | -4,202 | -4,437 | -4,321 | -3,668 | ||||
| Final consumption expenditure | P3 | 33,042 | 34,688 | 36,915 | 39,385 | 42,544 | 47,156 | ||||
| = Net expenditure on current goods and services | P3 excl. D632 | 27,449 | 28,755 | 30,462 | 32,253 | 35,067 | 39,520 | ||||
| + Social transfers in kind via market producers | D632 | 5,594 | 5,933 | 6,453 | 7,131 | 7,477 | 7,635 | ||||
| made up of | |||||||||||
| Individual consumption (= social transfers in kind) | P31 (= D63) | 22,112 | 23,228 | 24,946 | 26,624 | 28,854 | 31,981 | ||||
| Social transfers in kind (via market producers) | D632 | 5,594 | 5,933 | 6,453 | 7,131 | 7,477 | 7,635 | ||||
| Social transfers in kind (provided directly by government) | D631 | 16,518 | 17,295 | 18,493 | 19,493 | 21,376 | 24,346 | ||||
| Collective consumption (= actual final consumption of government) | P32 | 10,930 | 11,460 | 11,970 | 12,761 | 13,691 | 15,175 | ||||
| Total social transfers | D62 + D63 | 45,207 | 46,057 | 47,977 | 49,994 | 53,031 | 63,374 | ||||
| Social benefits in cash | D62 | 23,095 | 22,829 | 23,032 | 23,371 | 24,177 | 31,393 | ||||
| Social transfers in kind (= individual consumption) | D63 | 22,112 | 23,228 | 24,946 | 26,624 | 28,854 | 31,981 | ||||
| Table 5 General Government financial transactions | |||||||||||
| €million | |||||||||||
| Description | 2015 | 2016 | 2017 | 2018 | 2019 | 2020 | |||||
| Net lending (+) / net borrowing (-) | B.9 | -5,090 | -1,787 | -996 | 324 | 1,758 | -18,416 | ||||
| equals | |||||||||||
| Net acquisition of financial assets | ΔA | -8,838 | -4,905 | -2,137 | 17,436 | 143 | -3,939 | ||||
| EDP debt instruments | F2 + F3 + F4 | -7,096 | -5,151 | 1,625 | 3,152 | 134 | -1,500 | ||||
| Currency and deposits | F2 | -346 | -3,370 | 2,458 | 4,482 | 2,270 | -929 | ||||
| Debt securities | F3 | -5,662 | -1,417 | -51 | -135 | -153 | -119 | ||||
| Short-term | F31 | -1,184 | -1,033 | 170 | -95 | -108 | -173 | ||||
| Long-term | F32 | -4,478 | -384 | -221 | -40 | -45 | 54 | ||||
| Loans | F4 | -1,088 | -364 | -782 | -1,195 | -1,983 | -452 | ||||
| Short-term loans | F41 | -529 | -46 | -33 | -226 | -516 | 101 | ||||
| Long-term loans | F42 | -559 | -318 | -749 | -969 | -1,467 | -553 | ||||
| Equity and Investment Fund Shares | F5 | 241 | -382 | -4,496 | -1,238 | -2,351 | -1,293 | ||||
| Other financial assets | F6 + F7 + F8 | -1,983 | 628 | 734 | 15,522 | 2,360 | -1,146 | ||||
| Insurance, Pensions and Standardised Guarantees | F6 | -1 | 0 | 0 | 0 | 1 | 1 | ||||
| Financial derivatives and Employee Stock Options | F7 | -1,737 | -278 | -426 | -165 | -127 | -284 | ||||
| Other accounts receivable/payable | F8 | -245 | 906 | 1,160 | 15,687 | 2,486 | -863 | ||||
| less | |||||||||||
| Net incurrence of liabilities | ΔL | -3,748 | -3,118 | -1,141 | 17,112 | -1,615 | 14,477 | ||||
| EDP debt instruments | F2 + F3 + F4 | -4,075 | -2,794 | -1,513 | 2,341 | -1,964 | 14,623 | ||||
| Currency and deposits | F2 | -247 | 611 | 281 | 48 | 572 | 1,502 | ||||
| Debt securities | F3 | 6,111 | -3,547 | 4,331 | 1,761 | -1,160 | 15,013 | ||||
| Short-term | F31 | -2,409 | 1,048 | 635 | 92 | 291 | 6,538 | ||||
| Long-term | F32 | 8,520 | -4,595 | 3,696 | 1,669 | -1,451 | 8,475 | ||||
| Loans | F4 | -9,939 | 142 | -6,125 | 532 | -1,376 | -1,892 | ||||
| Short-term loans | F41 | -234 | -346 | -200 | 174 | -343 | 122 | ||||
| Long-term loans | F42 | -9,705 | 488 | -5,925 | 358 | -1,033 | -2,014 | ||||
| Other liabilities | F5 + F6 + F7 + F8 | 327 | -324 | 372 | 14,771 | 349 | -146 | ||||
| Equity and Investment Fund Shares | F5 | 0 | 0 | 0 | 0 | 0 | 0 | ||||
| Insurance, Pensions and Standardised Guarantees | F6 | 0 | 0 | 0 | 0 | 0 | 0 | ||||
| Financial derivatives and Employee Stock Options | F7 | 11 | -2 | 5 | 2 | 3 | -7 | ||||
| Other accounts receivable/payable | F8 | 316 | -322 | 367 | 14,769 | 346 | -139 | ||||
| Table 6 General Government: detailed breakdown of net worth | |||||||||||||
| €million | |||||||||||||
| Description | ESA2010 code | 2015 | 2016 | 2017 | 2018 | 2019 | 2020 | ||||||
| General Government balance sheet | |||||||||||||
| Net worth at market value, excluding pension liabilities | NW | -51,469 | -46,801 | -37,031 | -32,302 | -21,989 | -39,322 | ||||||
| equals | |||||||||||||
| Non-financial assets at market value | NFA | 99,017 | 105,318 | 111,862 | 119,605 | 129,292 | 134,685 | ||||||
| plus | |||||||||||||
| Financial net worth at market value, excluding pension liabilities | FNW | -150,486 | -152,119 | -148,893 | -151,907 | -151,281 | -174,007 | ||||||
| equals | |||||||||||||
| Financial assets at market value | FA | 83,313 | 79,093 | 79,394 | 91,974 | 94,705 | 92,038 | ||||||
| EDP debt instruments | F2 + F3 + F4 | 28,898 | 24,000 | 25,573 | 28,640 | 28,788 | 30,507 | ||||||
| Currency and deposits | F2 | 18,051 | 14,718 | 17,171 | 21,681 | 23,958 | 25,243 | ||||||
| Debt securities | F3 | 3,288 | 1,891 | 1,769 | 1,525 | 1,430 | 1,327 | ||||||
| Short-term | F31 | 1,184 | 143 | 428 | 318 | 196 | 38 | ||||||
| Long-term | F32 | 2,104 | 1,748 | 1,341 | 1,207 | 1,234 | 1,289 | ||||||
| Loans | F4 | 7,559 | 7,391 | 6,633 | 5,434 | 3,400 | 3,937 | ||||||
| Short-term loans | F41 | 989 | 942 | 910 | 684 | 168 | 269 | ||||||
| Long-term loans | F42 | 6,570 | 6,449 | 5,723 | 4,750 | 3,232 | 3,668 | ||||||
| Equity and Investment Fund Shares | F5 | 44,947 | 45,557 | 42,753 | 36,627 | 37,417 | 33,706 | ||||||
| Other financial assets | F6 + F7 + F8 | 9,468 | 9,536 | 11,068 | 26,707 | 28,500 | 27,825 | ||||||
| Insurance, Pensions and Standardised Guarantees | F6 | 0 | 0 | 0 | 0 | 1 | 2 | ||||||
| Financial derivatives and Employee Stock Options | F7 | 811 | 0 | 409 | 387 | 6 | 201 | ||||||
| Other accounts receivable/payable | F8 | 8,657 | 9,536 | 10,659 | 26,320 | 28,493 | 27,622 | ||||||
| less | |||||||||||||
| Liabilities at market value | L | 233,799 | 231,212 | 228,287 | 243,881 | 245,986 | 266,045 | ||||||
| EDP debt instruments | F2 + F3 + F4 | 223,231 | 221,046 | 218,233 | 219,212 | 221,477 | 241,800 | ||||||
| Currency and deposits | F2 | 20,713 | 21,317 | 21,600 | 21,648 | 22,220 | 23,721 | ||||||
| Debt securities | F3 | 146,320 | 143,056 | 146,545 | 146,997 | 149,903 | 170,340 | ||||||
| Short-term | F31 | 1,386 | 2,400 | 2,923 | 3,092 | 3,348 | 9,298 | ||||||
| Long-term | F32 | 144,934 | 140,655 | 143,623 | 143,904 | 146,555 | 161,042 | ||||||
| Loans | F4 | 56,198 | 56,673 | 50,088 | 50,567 | 49,354 | 47,739 | ||||||
| Short-term loans | F41 | 1,052 | 700 | 524 | 681 | 335 | 505 | ||||||
| Long-term loans | F42 | 55,145 | 55,973 | 49,564 | 49,885 | 49,020 | 47,234 | ||||||
| Other liabilities | F5 + F6 + F7 + F8 | 10,568 | 10,166 | 10,054 | 24,669 | 24,509 | 24,245 | ||||||
| Equity and Investment Fund Shares | F5 | 0 | 0 | 0 | 0 | 0 | 0 | ||||||
| Insurance, Pensions and Standardised Guarantees | F6 | 0 | 0 | 0 | 0 | 0 | 0 | ||||||
| Financial derivatives and Employee Stock Options | F7 | 1,138 | 1,039 | 558 | 405 | 178 | 49 | ||||||
| Other accounts receivable/payable | F8 | 9,430 | 9,127 | 9,496 | 24,264 | 24,331 | 24,196 | ||||||
| Memo: Estimated pension liabilities of government * | 114,500 | 114,500 | 114,500 | 149,600 | 149,600 | 149,600 | |||||||
| Memo: Net worth, including pension liabilities | -165,969 | -161,301 | -151,531 | -181,902 | -171,589 | -188,922 | |||||||
| Contingent liabilities | 15,955 | 9,751 | 5,315 | 5,066 | 5,314 | 6,182 | |||||||
| Guarantees | 11,304 | 3,973 | 282 | 7 | 7 | 656 | |||||||
| Off-balance sheet PPPs and concessions | 4,651 | 5,777 | 5,032 | 5,059 | 5,307 | 5,526 | |||||||
| Memo: Net worth, including pension liabilities and contingent liabilities | -181,924 | -171,052 | -156,845 | -186,968 | -176,904 | -195,105 | |||||||
| Change in net worth of government | |||||||||||||
| Opening net worth | -60,441 | -51,469 | -46,801 | -37,031 | -32,302 | -21,989 | |||||||
| Change in net worth due to transactions | -3,920 | -78 | 560 | 3,127 | 5,642 | -13,023 | |||||||
| Net acquisition of non-financial assets | P5 + NP - P51c | 1,170 | 1,710 | 1,556 | 2,803 | 3,884 | 5,393 | ||||||
| Net lending/net borrowing | B9 | -5,090 | -1,787 | -996 | 324 | 1,758 | -18,416 | ||||||
| = Net acquisition of financial assets | -8,838 | -4,905 | -2,137 | 17,436 | 143 | -3,939 | |||||||
| - Net incurrence of liabilities | 3,748 | 3,118 | 1,141 | -17,112 | 1,615 | -14,477 | |||||||
| Change in net worth due to other economic flows | Kx | 12,892 | 4,745 | 9,211 | 1,602 | 4,672 | -4,310 | ||||||
| Other changes in non-financial assets | 4,097 | 4,591 | 4,989 | 4,940 | 5,803 | 0 | |||||||
| Other changes in financial net worth | 8,795 | 154 | 4,222 | -3,338 | -1,132 | -4,310 | |||||||
| = Other changes in financial assets | 8,931 | 685 | 2,438 | -4,856 | 2,588 | 1,272 | |||||||
| EDP debt instruments | -14 | 253 | -52 | -85 | 14 | 3,219 | |||||||
| Equity and Investment Fund Shares | 6,781 | 992 | 1,692 | -4,888 | 3,141 | -2,418 | |||||||
| Other financial assets | 2,164 | -560 | 798 | 117 | -567 | 471 | |||||||
| - Other changes in liabilities | -136 | -531 | 1,784 | 1,518 | -3,720 | -5,582 | |||||||
| EDP debt instruments | 534 | -609 | 1,300 | 1,362 | -4,229 | -5,700 | |||||||
| Other liabilities | -670 | 78 | 484 | 156 | 509 | 118 | |||||||
| Closing net worth | -51,469 | -46,801 | -37,031 | -32,302 | -21,989 | -39,322 | |||||||
| * The data from 2018 on has been updated based on the Estimates of Pension Liabilities 2018 published in February 2021 | |||||||||||||
| Table 7 General Government Gross and Net Debt | ||||||||||
| €million | ||||||||||
| Description | ESA2010 code | 2015 | 2016 | 2017 | 2018 | 2019 | 2020 | |||
| General Government Debt | ||||||||||
| Debt instrument liabilities at market value | 223,231 | 221,046 | 218,233 | 219,212 | 221,477 | 241,800 | ||||
| + Difference between face value and market value | -21,552 | -20,409 | -16,967 | -13,311 | -17,254 | -23,643 | ||||
| Gross General Government Debt (face value) | GGDebt | 201,679 | 200,637 | 201,266 | 205,901 | 204,223 | 218,157 | |||
| By category: | ||||||||||
| Currency and deposits | F2 | 20,713 | 21,317 | 21,600 | 21,648 | 22,220 | 23,721 | |||
| Debt securities | F3 | 125,766 | 123,879 | 130,112 | 134,231 | 133,566 | 147,425 | |||
| Short-term | F31 | 1,380 | 2,395 | 2,920 | 3,084 | 3,352 | 9,299 | |||
| Long-term | F32 | 124,386 | 121,484 | 127,192 | 131,147 | 130,214 | 138,126 | |||
| Loans | F4 | 55,200 | 55,440 | 49,555 | 50,022 | 48,437 | 47,011 | |||
| Short-term | F41 | 1,052 | 700 | 524 | 681 | 334 | 505 | |||
| Long-term | F42 | 54,147 | 54,740 | 49,031 | 49,341 | 48,103 | 46,506 | |||
| less EDP debt instrument assets | F2 + F3 + F4 | 28,898 | 24,000 | 25,573 | 28,640 | 28,788 | 30,507 | |||
| By category: | ||||||||||
| Currency and deposits | F2 | 18,051 | 14,718 | 17,171 | 21,681 | 23,958 | 25,243 | |||
| Debt securities | F3 | 3,288 | 1,891 | 1,769 | 1,525 | 1,430 | 1,327 | |||
| Short-term | F31 | 1,184 | 143 | 428 | 318 | 196 | 38 | |||
| Long-term | F32 | 2,104 | 1,748 | 1,341 | 1,207 | 1,234 | 1,289 | |||
| Loans | F4 | 7,559 | 7,391 | 6,633 | 5,434 | 3,400 | 3,937 | |||
| Short-term | F41 | 989 | 942 | 910 | 684 | 168 | 269 | |||
| Long-term | F42 | 6,570 | 6,449 | 5,723 | 4,750 | 3,232 | 3,668 | |||
| Net General Government Debt (face value) | GGNetDebt | 172,781 | 176,637 | 175,693 | 177,261 | 175,435 | 187,650 | |||
| By category: | ||||||||||
| Currency and deposits | F2 | 2,662 | 6,599 | 4,429 | -33 | -1,738 | -1,522 | |||
| Debt securities | F3 | 122,478 | 121,988 | 128,343 | 132,706 | 132,136 | 146,098 | |||
| Short-term | F31 | 196 | 2,252 | 2,492 | 2,766 | 3,156 | 9,261 | |||
| Long-term | F32 | 122,282 | 119,736 | 125,851 | 129,940 | 128,980 | 136,837 | |||
| Loans | F4 | 47,641 | 48,049 | 42,922 | 44,588 | 45,037 | 43,074 | |||
| Short-term | F41 | 63 | -242 | -386 | -3 | 166 | 236 | |||
| Long-term | F42 | 47,577 | 48,291 | 43,308 | 44,591 | 44,871 | 42,838 | |||
| Table 8 Reconciliation of Exchequer Balance to General Government Deficit | ||||||
| € million | ||||||
| Description | ESA2010 code | 2017 | 2018 | 2019 | 2020 | |
| Exchequer balance | 1,906 | 99 | 647 | -12,316 | ||
| Deduct cash inflows which do not increase financial net worth | -4,875 | -1,960 | -2,665 | -3,657 | ||
| Inflows from sale or redemption of financial assets | -4,875 | -1,960 | -2,665 | -3,657 | ||
| Incurrence of Exchequer liability to Central Bank for notes and coins in circulation | 0 | 0 | 0 | 0 | ||
| Exclude cash outflows which do not reduce financial net worth | 199 | 262 | 191 | 1,249 | ||
| Acquisition of financial assets | 199 | 262 | 191 | 1,249 | ||
| Repayment of promissory notes notional loan principal | 0 | 0 | 0 | 0 | ||
| Redemption of Exchequer liability to Central Bank for notes and coins in circulation | 0 | 0 | 0 | 0 | ||
| Impact on financial net worth of Exchequer cash transactions | -2,769 | -1,599 | -1,826 | -14,725 | ||
| Adjust for impact of non-cash revenue and disposals of non-financial asset (+) | 280 | 328 | 580 | 619 | ||
| Difference between Exchequer cash tax revenue and time-adjusted Revenue Net Receipts | 143 | 316 | 524 | 763 | ||
| Receipts due from EU (Agriculture grants, Cohesion Fund, ESF and ERDF) | 44 | -88 | -2 | -222 | ||
| Accrual of interest due on contingent capital assets assigned to banks | 0 | 0 | 0 | 0 | ||
| Licence sales | 93 | 100 | 58 | 78 | ||
| Other accrued revenue | 0 | 0 | 0 | 0 | ||
| Adjust for impact of non-cash expenditure (-) | 385 | 237 | 593 | 721 | ||
| Capital transfers to financial institutions financed by promissory notes | 0 | 0 | 0 | 0 | ||
| Difference between interest paid and accrued | 218 | 479 | 570 | 756 | ||
| Difference between Exchequer cash issues and accrued net spending of departments and offices | 79 | 18 | -17 | 0 | ||
| Other accrued expenditure | 88 | -259 | 40 | -34 | ||
| Surplus/Deficit of Exchequer | B9_exchequer | -2,104 | -1,034 | -654 | -13,384 | |
| Surplus/Deficit of extra-budgetary bodies, funds and accounts consolidated with Exchequer | 660 | 992 | 1,920 | -2,806 | ||
| Social Insurance Fund | 624 | 1,068 | 1,489 | -3,454 | ||
| Bank & Deposit Guarantee Schemes | -12 | 161 | 121 | 125 | ||
| Capital Services Redemption Account | 0 | 0 | 0 | 0 | ||
| Small Savings Reserve Fund | 0 | 0 | 0 | 0 | ||
| Other Extra-Budgetary Funds | 164 | -315 | 142 | 355 | ||
| Health Service Executive | -117 | 78 | 168 | 168 | ||
| Surplus/Deficit of Budgetary Central Government | B9_bcg | -1,444 | -42 | 1,266 | -16,191 | |
| Surplus/Deficit of other Central Government bodies | 352 | 290 | 964 | -1,866 | ||
| National Pensions Reserve Fund | 329 | 375 | 438 | -66 | ||
| Non-market State corporations and agencies | 46 | 127 | 401 | -1,931 | ||
| Voluntary and joint board hospitals | -24 | -9 | 21 | 21 | ||
| Other adjustments | 0 | -203 | 104 | 109 | ||
| Conversion of AIB Preference shares into Ordinary shares | 0 | 0 | 0 | 0 | ||
| Concession asset reclassification & Court decision (consultants pay) | 0 | -203 | 104 | 109 | ||
| Surplus/Deficit of Central Government | B9_S1311 | -1,093 | 248 | 2,230 | -18,057 | |
| Surplus/Deficit of Local Government | B9_S1313 | 97 | 76 | -472 | -359 | |
| Surplus/Deficit of General Government | B9_S13 | -996 | 324 | 1,758 | -18,416 | |
| Table 9 Reconciliation of National Debt to General Government Debt | |||||||||||
| € million | |||||||||||
| Description | 2015 | 2016 | 2017 | 2018 | 2019 | 2020 | |||||
| Audited National Debt | 183,066 | 185,610 | 185,483 | 187,682 | 188,194 | 200,281* | |||||
| Composed of | |||||||||||
| Gross National Debt | 196,620 | 196,729 | 198,701 | 205,275 | 206,730 | 219,482 | |||||
| Medium/long term debt | 175,974 | 173,620 | 174,395 | 178,901 | 175,914 | 182,459 | |||||
| Irish Government Bonds | 125,086 | 121,645 | 127,581 | 131,829 | 130,067 | 136,809 | |||||
| EU/IMF Programme Funding and bilateral loans | 50,579 | 50,491 | 44,548 | 44,518 | 43,281 | 41,359 | |||||
| Other medium/long term debt | 1,163 | 1,693 | 1,893 | 2,238 | 2,573 | 4,092 | |||||
| Miscellaneous (including derivatives) | -854 | -209 | 373 | 316 | -7 | 198 | |||||
| Short term debt | 3,953 | 5,915 | 7,013 | 9,035 | 13,016 | 18,194 | |||||
| Foreign Bills | 1,046 | 363 | 502 | 513 | 345 | 4,717 | |||||
| Treasury Bills | 0 | 1,008 | 2,009 | 2,014 | 2,010 | 3,760 | |||||
| Borrowings from Funds under the control of the Minister for Finance | 1,579 | 2,518 | 2,281 | 2,595 | 3,018 | 4,326 | |||||
| Exchequer Bills/Notes (incl. Central Treasury Notes) | 1,327 | 2,025 | 2,221 | 3,913 | 7,643 | 5,391 | |||||
| State Savings Schemes | 16,692 | 17,194 | 17,293 | 17,339 | 17,800 | 18,829 | |||||
| Less cash and other financial assets | -13,554 | -11,119 | -13,217 | -17,593 | -18,536 | -19,200 | |||||
| Reverse deduction of cash, other financial assets and EFSF prepaid margin held by Exchequer | 14,084 | 11,119 | 13,217 | 17,593 | 18,536 | 19,200 | |||||
| Outstanding principal value of promissory notes | 0 | 0 | 0 | 0 | 0 | 0 | |||||
| Liability for coinage in circulation | 701 | 707 | 704 | 712 | 722 | 713 | |||||
| Accrual adjustments (State Savings) | 504 | 451 | 452 | 280 | 275 | 270 | |||||
| Adjustment from discounted to nominal value | 8 | -2 | -5 | 2 | -10 | -14 | |||||
| National Loans Advance Interest | 24 | 29 | 46 | 41 | 38 | 16 | |||||
| Gross treatment of collaterals | 783 | 522 | 50 | 68 | 68 | 13 | |||||
| Other adjustments (repurchase agreements, OPW contracts and exclusion of financial derivatives) | 24 | 16 | 38 | 20 | 17 | 64 | |||||
| Unconsolidated Exchequer Debt (Maastricht definition) | 199,193 | 198,452 | 199,987 | 206,397 | 207,840 | 220,544 | |||||
| of which: Liabilities to other Central Government bodies | 3,372 | 3,985 | 4,459 | 6,421 | 10,650 | 9,329 | |||||
| Exchequer contribution to Central Government debt | 195,821 | 194,466 | 195,528 | 199,976 | 197,190 | 211,215 | |||||
| of which: Liabilities to Local Government | 0 | 0 | 0 | 0 | 0 | 0 | |||||
| Exchequer contribution to General Government debt | 195,821 | 194,466 | 195,528 | 199,976 | 197,190 | 211,215 | |||||
| Housing Finance Agency (HFA) | |||||||||||
| Gross debt of HFA | 3,615 | 3,612 | 3,617 | 3,790 | 4,497 | 4,989 | |||||
| of which: Liabilities to other Central Government bodies | 2,427 | 2,056 | 1,783 | 1,587 | 1,924 | 1,591 | |||||
| HFA contribution to Central Government debt | 1,189 | 1,556 | 1,834 | 2,203 | 2,574 | 3,399 | |||||
| of which: Liabilities to Local Authorities | 965 | 1,295 | 1,514 | 1,850 | 2,006 | 2,693 | |||||
| HFA contribution to General Government debt | 224 | 261 | 320 | 353 | 567 | 706 | |||||
| Other Central Government | |||||||||||
| IBRC Consolidated | 735 | 698 | 332 | 252 | 494 | 447 | |||||
| Liabilities of Post Office Savings Bank Fund to Post Office Savings Bank | 2,765 | 2,922 | 3,121 | 3,308 | 3,420 | 3,906 | |||||
| All other bodies | 1,467 | 1,585 | 1,442 | 1,353 | 1,478 | 638 | |||||
| Other bodies' contribution to Central and General Government debt | 4,967 | 5,205 | 4,896 | 4,914 | 5,393 | 4,991 | |||||
| Total Central Government debt | 201,977 | 201,227 | 202,257 | 207,093 | 205,156 | 219,604 | |||||
| of which: Liabilities to Local Government | 965 | 1,295 | 1,514 | 1,850 | 2,006 | 2,693 | |||||
| Central Government contribution to General Government debt | 201,012 | 199,933 | 200,743 | 205,243 | 203,150 | 216,911 | |||||
| Local Government - Local Authorities | |||||||||||
| Borrowing from Housing Finance Agency | 3,684 | 3,698 | 3,712 | 3,895 | 4,391 | 4,974 | |||||
| Borrowing from other Central Government bodies | 28 | 22 | 19 | 16 | 13 | 11 | |||||
| Other borrowing | 666 | 705 | 523 | 659 | 1,073 | 1,246 | |||||
| Local Authorities' contribution to Local Government debt | 4,378 | 4,425 | 4,254 | 4,570 | 5,477 | 6,232 | |||||
| VECs / ETBs | 0 | 0 | 0 | 0 | 0 | 0 | |||||
| Total Local Government debt | 4,378 | 4,425 | 4,254 | 4,570 | 5,477 | 6,232 | |||||
| of which: Liabilities to Central Government | 3,712 | 3,720 | 3,731 | 3,911 | 4,404 | 4,986 | |||||
| Local Government contribution to General Government debt | 666 | 705 | 523 | 659 | 1,073 | 1,246 | |||||
| General Government Debt | 201,678 | 200,637 | 201,266 | 205,901 | 204,223 | 218,157 | |||||
| * unaudited figure | |||||||||||
| Table 10 Central Government transactions: revenue, expenditure and deficit | ||||||||||
| €million | ||||||||||
| Description | ESA2010 code | 2015 | 2016 | 2017 | 2018 | 2019 | 2020 | |||
| Central Government transactions | ||||||||||
| Revenue | TR | 68,373 | 70,975 | 74,074 | 80,003 | 84,806 | 82,039 | |||
| Taxes and social contributions | D2 + D5 + D91 + D61 | 61,341 | 64,266 | 67,898 | 73,654 | 78,723 | 76,969 | |||
| Taxes | D2 + D5 + D91 | 49,361 | 51,460 | 54,335 | 59,113 | 63,219 | 61,565 | |||
| Social contributions | D61 | 11,980 | 12,806 | 13,564 | 14,542 | 15,503 | 15,404 | |||
| Sales of goods and services | P1O | 3,836 | 3,756 | 3,746 | 3,934 | 3,724 | 3,070 | |||
| Investment income | D4 | 2,735 | 1,867 | 1,815 | 1,578 | 1,670 | 1,224 | |||
| Current transfer revenue (excluding taxes) | D7 | 393 | 446 | 586 | 714 | 627 | 604 | |||
| Capital transfer revenue (excluding taxes) | D9N | 69 | 640 | 28 | 122 | 62 | 173 | |||
| Expenditure | TE | 73,865 | 72,977 | 75,166 | 79,754 | 82,576 | 100,096 | |||
| Expense | Expense | 72,168 | 70,758 | 73,380 | 77,321 | 79,689 | 95,804 | |||
| Compensation of employees | D1 | 17,628 | 18,172 | 19,308 | 20,216 | 21,141 | 22,835 | |||
| Use of goods and services plus taxes payable | P2 + D5 + D29 | 7,775 | 8,186 | 8,607 | 9,308 | 10,611 | 12,494 | |||
| Depreciation (Consumption of fixed capital) | P51c | 1,724 | 1,857 | 2,006 | 2,203 | 2,422 | 2,422 | |||
| Interest (excluding FISIM) | D41 | 6,922 | 6,256 | 5,936 | 5,312 | 4,452 | 3,677 | |||
| Subsidies | D3 | 1,788 | 1,768 | 1,857 | 1,948 | 1,709 | 5,652 | |||
| Social benefits | D62 + D632 | 27,330 | 27,308 | 27,792 | 28,538 | 29,477 | 36,851 | |||
| Other current transfers | D7 | 4,220 | 4,738 | 5,089 | 6,032 | 6,195 | 7,907 | |||
| Capital transfers | D9 | 4,782 | 2,474 | 2,785 | 3,763 | 3,683 | 3,966 | |||
| Net operating balance | NOB | -3,795 | 217 | 694 | 2,682 | 5,117 | -13,765 | |||
| Net acquisition of non-financial assets | P5 + NP - P51c | 1,696 | 2,219 | 1,786 | 2,434 | 2,887 | 4,292 | |||
| Central Government Surplus/Deficit | B9 | -5,491 | -2,002 | -1,093 | 248 | 2,230 | -18,057 | |||
| Table 11 Central Government: detailed classification of revenue and output | |||||||||||
| €million | |||||||||||
| Description | ESA2010 code | 2015 | 2016 | 2017 | 2018 | 2019 | 2020 | ||||
| Total Revenue | TR | 68,373 | 70,975 | 74,074 | 80,003 | 84,806 | 82,039 | ||||
| Taxes and social contributions | 61,341 | 64,266 | 67,898 | 73,654 | 78,723 | 76,969 | |||||
| Taxes | D2 + D5 + D91 | 49,361 | 51,460 | 54,335 | 59,113 | 63,219 | 61,565 | ||||
| Indirect taxes (taxes on production and imports) | D2 | 21,098 | 22,117 | 23,270 | 24,307 | 26,062 | 23,496 | ||||
| Taxes on products | D21 | 19,326 | 20,575 | 21,392 | 22,150 | 23,915 | 21,377 | ||||
| of which Value-Added Tax | D211 | 11,831 | 12,603 | 13,060 | 14,175 | 15,281 | 12,649 | ||||
| Other taxes on production | D29 | 1,772 | 1,542 | 1,878 | 2,157 | 2,148 | 2,119 | ||||
| Direct taxes | D5 | 27,863 | 28,932 | 30,616 | 34,287 | 36,626 | 37,564 | ||||
| Taxes on income, profits and capital gains | D51 | 26,599 | 27,893 | 29,601 | 33,291 | 35,646 | 36,602 | ||||
| Other current direct taxes | D59 | 1,263 | 1,039 | 1,016 | 996 | 980 | 962 | ||||
| Capital taxes | D91 | 401 | 411 | 448 | 518 | 531 | 505 | ||||
| Social contributions | D61 | 11,980 | 12,806 | 13,564 | 14,542 | 15,503 | 15,404 | ||||
| Actual social contributions | D611 + D613 | 10,354 | 10,871 | 11,525 | 12,516 | 13,671 | 13,491 | ||||
| PRSI receipts | D611 + D613(pt) | 8,527 | 9,248 | 9,834 | 10,649 | 11,702 | 11,386 | ||||
| Government employees' social contributions | D613(pt) | 1,827 | 1,623 | 1,691 | 1,867 | 1,969 | 2,105 | ||||
| Employers' imputed social contributions | D612 | 1,625 | 1,935 | 2,038 | 2,026 | 1,832 | 1,913 | ||||
| Sales of goods and services | P1O | 3,836 | 3,756 | 3,746 | 3,934 | 3,724 | 3,070 | ||||
| Sales of market establishments (= market output) | P11 | 0 | 0 | 0 | 0 | 0 | 0 | ||||
| Imputed sales related to production of own-use capital assets (= output for own final use) | P12 | 21 | 21 | 22 | 22 | 23 | 23 | ||||
| Incidental sales and fees of non-market establishments | P131 | 3,815 | 3,735 | 3,724 | 3,912 | 3,702 | 3,047 | ||||
| Investment income | D4 | 2,735 | 1,867 | 1,815 | 1,578 | 1,670 | 1,224 | ||||
| Interest (excluding FISIM) | D41 | 696 | 292 | 178 | 213 | 203 | 147 | ||||
| of which received from local government | D41_LG | 51 | 73 | 64 | 59 | 80 | 84 | ||||
| Dividends | D42 | 1,932 | 1,468 | 1,532 | 1,252 | 1,396 | 1,006 | ||||
| Rent of land and subsoil assets | D45 | 106 | 107 | 105 | 113 | 71 | 70 | ||||
| Current transfer revenue | D39 + D7 | 393 | 446 | 586 | 714 | 627 | 604 | ||||
| Subsidies | D39 | 0 | 0 | 0 | 0 | 0 | 0 | ||||
| Other current transfers | D7 | 393 | 446 | 586 | 714 | 627 | 604 | ||||
| Non-life insurance claims | D72 | 8 | 17 | 17 | 17 | 17 | 17 | ||||
| Grants from local government | D73 | 3 | 3 | 4 | 4 | 5 | 5 | ||||
| Other Domestic - Current | D7N_S1 | 201 | 237 | 275 | 321 | 375 | 526 | ||||
| From Rest of World - Current | D7N_S2 | 182 | 189 | 290 | 372 | 230 | 56 | ||||
| Capital transfer revenue | D9N | 69 | 640 | 28 | 122 | 62 | 173 | ||||
| Output | P1 | 27,126 | 28,214 | 29,920 | 31,727 | 34,174 | 37,756 | ||||
| Market output (sales of market establishments) | P11 | 0 | 0 | 0 | 0 | 0 | 0 | ||||
| Output for own final use | P12 | 21 | 21 | 22 | 22 | 23 | 23 | ||||
| Non-market output | P13 | 27,105 | 28,194 | 29,898 | 31,705 | 34,151 | 37,733 | ||||
| = Non-market compensation of employees | D1_nonmarket | 17,607 | 18,151 | 19,286 | 20,194 | 21,118 | 22,813 | ||||
| = Total compensation of employees | D1 | 17,628 | 18,172 | 19,308 | 20,216 | 21,141 | 22,835 | ||||
| - Compensation of employees of market establishments | D1_market | 0 | 0 | 0 | 0 | 0 | 0 | ||||
| - Compensation related to production of own-use capital assets | D1_own-use | -21 | -21 | -22 | -22 | -23 | -23 | ||||
| + Non-market intermediate consumption | P2_nonmarket | 7,775 | 8,186 | 8,606 | 9,308 | 10,611 | 12,499 | ||||
| = Total intermediate consumption | P2 | 7,775 | 8,186 | 8,607 | 9,308 | 10,611 | 12,494 | ||||
| - Intermediate consumption of market establishments | P2_market | 0 | 0 | 0 | 0 | 0 | 4 | ||||
| - Intermediate consumption related to production of own-use capital assets | P2_own-use | 0 | 0 | 0 | 0 | 0 | 0 | ||||
| + Non-market consumption of fixed capital | P51c_nonmarket | 1,724 | 1,857 | 2,006 | 2,203 | 2,422 | 2,422 | ||||
| = Total consumption of fixed capital | P51c | 1,724 | 1,857 | 2,006 | 2,203 | 2,422 | 2,422 | ||||
| - Consumption of fixed capital by market establishments | P51c_market | 0 | 0 | 0 | 0 | 0 | 0 | ||||
| - Consumption of fixed capital related to production of own-use capital assets | P51c_own-use | 0 | 0 | 0 | 0 | 0 | 0 | ||||
| + Other taxes on production, payable | D29_pay | 0 | 0 | 0 | 0 | 0 | 0 | ||||
| - Other subsidies on production, receivable | D39_rec | 0 | 0 | 0 | 0 | 0 | 0 | ||||
| Table 12 Central Government: detailed classification of expenditure and consumption | |||||||||||
| €million | |||||||||||
| Description | ESA2010 code | 2015 | 2016 | 2017 | 2018 | 2019 | 2020 | ||||
| Total Expenditure | TE | 73,865 | 72,977 | 75,166 | 79,754 | 82,576 | 100,096 | ||||
| Expense | 72,168 | 70,758 | 73,380 | 77,321 | 79,689 | 95,804 | |||||
| Compensation of employees | D1 | 17,628 | 18,172 | 19,308 | 20,216 | 21,141 | 22,835 | ||||
| Of which: Related to production of own-use capital assets | 21 | 21 | 22 | 22 | 23 | 23 | |||||
| Use of goods and services plus taxes payable | P2 + D5 + D29 | 7,775 | 8,186 | 8,607 | 9,308 | 10,611 | 12,494 | ||||
| Use of goods and services [Intermediate consumption] | P2 | 7,775 | 8,186 | 8,607 | 9,308 | 10,611 | 12,494 | ||||
| Of which: Intermediate consumption of market establishments | 0 | 0 | 0 | 0 | 0 | 0 | |||||
| Taxes, payable | D5 | 0 | 0 | 0 | 0 | 0 | 0 | ||||
| Depreciation (Consumption of fixed capital) | P51c | 1,724 | 1,857 | 2,006 | 2,203 | 2,422 | 2,422 | ||||
| Of which: Depreciation by market establishments | 0 | 0 | 0 | 0 | 0 | 0 | |||||
| Interest (excluding FISIM) | D41 | 6,922 | 6,256 | 5,936 | 5,312 | 4,452 | 3,677 | ||||
| Other domestic interest payable | D41_S1 | 2,525 | 2,347 | 2,238 | 1,918 | 1,449 | 1,662 | ||||
| Interest payable to rest of world | D41_S2 | 4,397 | 3,908 | 3,698 | 3,395 | 3,003 | 2,015 | ||||
| Subsidies | D3 | 1,788 | 1,768 | 1,857 | 1,948 | 1,709 | 5,652 | ||||
| Product subsidies | D31 | 864 | 909 | 930 | 994 | 986 | 1,059 | ||||
| Other subsidies on production | D39 | 924 | 858 | 927 | 954 | 723 | 4,592 | ||||
| Social benefits | D62 + D632 | 27,330 | 27,308 | 27,792 | 28,538 | 29,477 | 36,851 | ||||
| Social benefits in cash | D62 | 22,730 | 22,527 | 22,721 | 23,022 | 23,825 | 31,041 | ||||
| Social benefits in kind (via market producers) | D632 | 4,600 | 4,782 | 5,071 | 5,516 | 5,652 | 5,810 | ||||
| Other current transfers | D7 | 4,220 | 4,738 | 5,089 | 6,032 | 6,195 | 7,907 | ||||
| Net non-life insurance premiums | D71 | 55 | 52 | 52 | 52 | 52 | 52 | ||||
| Current grants to local government | D73 _LG | 1,657 | 1,817 | 1,968 | 2,314 | 2,538 | 3,694 | ||||
| Current international cooperation | D74 | 473 | 451 | 509 | 539 | 524 | 497 | ||||
| Miscellaneous current transfers | D75 | 529 | 567 | 829 | 753 | 808 | 1,055 | ||||
| VAT and GNI based EU budget contribution | D76 | 1,507 | 1,851 | 1,731 | 2,374 | 2,273 | 2,610 | ||||
| VAT-based EU own resources | D761 | 215 | 219 | 262 | 245 | 278 | 275 | ||||
| GNI-based EU own resources | D762 | 1,292 | 1,632 | 1,470 | 2,129 | 1,996 | 2,335 | ||||
| Capital transfers | D9 | 4,782 | 2,474 | 2,785 | 3,763 | 3,683 | 3,966 | ||||
| Capital grants to local government | D9_LG | 1,300 | 1,054 | 1,150 | 1,684 | 2,008 | 2,158 | ||||
| Investment grants | D92 | 1,292 | 1,420 | 1,599 | 1,838 | 1,655 | 1,807 | ||||
| Other capital transfers | D99 | 2,190 | 1 | 36 | 241 | 20 | 0 | ||||
| Net acquisition of non-financial assets | P5 + NP - P51c | 1,696 | 2,219 | 1,786 | 2,434 | 2,887 | 4,292 | ||||
| = Gross investment in non-financial assets | P5 + NP | 3,420 | 4,076 | 3,792 | 4,637 | 5,309 | 6,714 | ||||
| Gross fixed capital formation | P51 | 3,420 | 4,016 | 3,837 | 4,577 | 5,389 | 6,654 | ||||
| Net acquisition of stocks | P52 | 60 | 60 | 60 | 60 | 60 | 60 | ||||
| Net acquisition of unproduced assets | NP | -60 | 0 | -105 | 0 | -140 | 0 | ||||
| - Consumption of fixed capital | P51c | -1,724 | -1,857 | -2,006 | -2,203 | -2,422 | -2,422 | ||||
| Net expenditure on current goods and services | P3 excl. D632 | 23,290 | 24,458 | 26,174 | 27,793 | 30,449 | 34,686 | ||||
| = Output | P1 | 27,126 | 28,214 | 29,920 | 31,727 | 34,174 | 37,756 | ||||
| - Sales of goods and services | P11+P12+P131 | -3,836 | -3,756 | -3,746 | -3,934 | -3,724 | -3,070 | ||||
| Market output (sales of market establishments) | P11 | 0 | 0 | 0 | 0 | 0 | 0 | ||||
| Output for own final use | P12 | -21 | -21 | -22 | -22 | -23 | -23 | ||||
| Incidental sales and fees of non-market establishments | P131 | -3,815 | -3,735 | -3,724 | -3,912 | -3,702 | -3,047 | ||||
| Final consumption expenditure | P3 | 27,890 | 29,240 | 31,245 | 33,309 | 36,101 | 40,496 | ||||
| = Net expenditure on current goods and services | P3 excl. D632 | 23,290 | 24,458 | 26,174 | 27,793 | 30,449 | 34,686 | ||||
| + Social transfers in kind via market producers | D632 | 4,600 | 4,782 | 5,071 | 5,516 | 5,652 | 5,810 | ||||
| made up of | |||||||||||
| Individual consumption (= social transfers in kind) | P31 (= D63) | 20,172 | 21,131 | 22,572 | 24,034 | 26,015 | 29,047 | ||||
| Social transfers in kind (via market producers) | D632 | 4,600 | 4,782 | 5,071 | 5,516 | 5,652 | 5,810 | ||||
| Social transfers in kind (provided directly by government) | D631 | 15,572 | 16,349 | 17,501 | 18,518 | 20,363 | 23,237 | ||||
| Collective consumption (= actual final consumption of government) | P32 | 7,718 | 8,109 | 8,673 | 9,275 | 10,086 | 11,449 | ||||
| Total social transfers | D62 + D63 | 42,902 | 43,658 | 45,293 | 47,056 | 49,840 | 60,088 | ||||
| Social benefits in cash | D62 | 22,730 | 22,527 | 22,721 | 23,022 | 23,825 | 31,041 | ||||
| Social transfers in kind (= individual consumption) | D63 | 20,172 | 21,131 | 22,572 | 24,034 | 26,015 | 29,047 | ||||
| Table 13 Local Government transactions: revenue, expenditure and deficit | ||||||||||
| €million | ||||||||||
| Description | ESA2010 code | 2015 | 2016 | 2017 | 2018 | 2019 | 2020 | |||
| Local Government transactions | ||||||||||
| Revenue | TR | 6,581 | 6,762 | 7,235 | 8,450 | 9,108 | 9,696 | |||
| Taxes and social contributions | D2 + D5 + D91 + D61 | 1,733 | 1,708 | 1,737 | 1,857 | 1,784 | 929 | |||
| Taxes | D2 + D5 + D91 | 1,389 | 1,354 | 1,379 | 1,437 | 1,414 | 554 | |||
| Social contributions | D61 | 344 | 354 | 358 | 420 | 369 | 375 | |||
| Sales of goods and services | P1O | 1,540 | 1,710 | 1,839 | 2,001 | 2,238 | 2,370 | |||
| Investment income | D4 | 37 | 32 | 29 | 25 | 16 | 19 | |||
| Current transfer revenue (excluding taxes) | D7 | 1,717 | 1,885 | 2,045 | 2,401 | 2,626 | 3,783 | |||
| Capital transfer revenue (excluding taxes) | D9N | 1,554 | 1,427 | 1,584 | 2,167 | 2,444 | 2,595 | |||
| Expenditure | TE | 6,179 | 6,547 | 7,138 | 8,375 | 9,580 | 10,055 | |||
| Expense | Expense | 6,706 | 7,056 | 7,368 | 8,006 | 8,584 | 8,954 | |||
| Compensation of employees | D1 | 1,677 | 1,721 | 1,737 | 1,837 | 1,932 | 2,012 | |||
| Use of goods and services plus taxes payable | P2 + D5 + D29 | 1,785 | 1,897 | 1,842 | 1,908 | 2,023 | 2,162 | |||
| Depreciation (Consumption of fixed capital) | P51c | 1,755 | 1,834 | 1,900 | 1,960 | 2,040 | 2,040 | |||
| Interest (excluding FISIM) | D41 | 68 | 82 | 70 | 64 | 86 | 91 | |||
| Subsidies | D3 | 0 | 0 | 0 | 0 | 0 | 0 | |||
| Social benefits | D62 + D632 | 1,359 | 1,453 | 1,692 | 1,963 | 2,177 | 2,178 | |||
| Other current transfers | D7 | 36 | 33 | 41 | 64 | 67 | 115 | |||
| Capital transfers | D9 | 26 | 36 | 87 | 208 | 257 | 356 | |||
| Net operating balance | NOB | -125 | -294 | -134 | 445 | 525 | 742 | |||
| Net acquisition of non-financial assets | P5 + NP - P51c | -526 | -509 | -231 | 369 | 997 | 1,101 | |||
| Local Government Surplus/Deficit | B9 | 402 | 215 | 97 | 76 | -472 | -359 | |||
| Table 14 Local Government: detailed classification of revenue and output | |||||||||||
| €million | |||||||||||
| Description | ESA2010 code | 2015 | 2016 | 2017 | 2018 | 2019 | 2020 | ||||
| Total Revenue | TR | 6,581 | 6,762 | 7,235 | 8,450 | 9,108 | 9,696 | ||||
| Taxes and social contributions | 1,733 | 1,708 | 1,737 | 1,857 | 1,784 | 929 | |||||
| Taxes | D2 + D5 + D91 | 1,389 | 1,354 | 1,379 | 1,437 | 1,414 | 554 | ||||
| Indirect taxes (taxes on production and imports) | D2 | 1,389 | 1,354 | 1,379 | 1,437 | 1,414 | 554 | ||||
| Other taxes on production | D29 | 1,389 | 1,354 | 1,379 | 1,437 | 1,414 | 554 | ||||
| Capital taxes | D91 | 0 | 0 | 0 | 0 | 0 | 0 | ||||
| Social contributions | D61 | 344 | 354 | 358 | 420 | 369 | 375 | ||||
| Actual social contributions | D611 + D613 | 171 | 153 | 147 | 200 | 136 | 143 | ||||
| Employers' imputed social contributions | D612 | 174 | 201 | 211 | 220 | 233 | 231 | ||||
| Sales of goods and services | P1O | 1,540 | 1,710 | 1,839 | 2,001 | 2,238 | 2,370 | ||||
| Sales of market establishments (= market output) | P11 | 1,131 | 1,238 | 1,361 | 1,477 | 1,619 | 1,749 | ||||
| Imputed sales related to production of own-use capital assets (= output for own final use) | P12 | 0 | 0 | 0 | 0 | 0 | 0 | ||||
| Incidental sales and fees of non-market establishments | P131 | 409 | 472 | 478 | 524 | 619 | 621 | ||||
| Investment income | D4 | 37 | 32 | 29 | 25 | 16 | 19 | ||||
| Interest (excluding FISIM) | D41 | 37 | 32 | 29 | 25 | 16 | 19 | ||||
| of which received from Central Government | D41_CG | 0 | 0 | 0 | 0 | 0 | 0 | ||||
| Dividends | D42 | 0 | 0 | 0 | 0 | 0 | 0 | ||||
| Current transfer revenue | D39 + D7 | 1,717 | 1,885 | 2,045 | 2,401 | 2,626 | 3,783 | ||||
| Subsidies | D39 | 0 | 0 | 0 | 0 | 0 | 0 | ||||
| Other current transfers | D7 | 1,717 | 1,885 | 2,045 | 2,401 | 2,626 | 3,783 | ||||
| Grants from central government | D73 | 1,657 | 1,817 | 1,968 | 2,314 | 2,538 | 3,694 | ||||
| Other Domestic - Current | D7N_S1 | 61 | 69 | 78 | 87 | 89 | 89 | ||||
| Capital transfer revenue | D9N | 1,554 | 1,427 | 1,584 | 2,167 | 2,444 | 2,595 | ||||
| Grants from central government | D9N_CG | 1,300 | 1,054 | 1,150 | 1,684 | 2,008 | 2,158 | ||||
| Other capital transfers receivable | D99 | 254 | 373 | 434 | 483 | 436 | 437 | ||||
| Output | P1 | 5,698 | 6,007 | 6,127 | 6,461 | 6,856 | 7,204 | ||||
| Market output (sales of market establishments) | P11 | 1,131 | 1,238 | 1,361 | 1,477 | 1,619 | 1,749 | ||||
| Output for own final use | P12 | 0 | 0 | 0 | 0 | 0 | 0 | ||||
| Non-market output | P13 | 4,567 | 4,769 | 4,766 | 4,985 | 5,237 | 5,455 | ||||
| = Non-market compensation of employees | D1_nonmarket | 1,677 | 1,721 | 1,737 | 1,837 | 1,932 | 2,012 | ||||
| = Total compensation of employees | D1 | 1,677 | 1,721 | 1,737 | 1,837 | 1,932 | 2,012 | ||||
| - Compensation of employees of market establishments | D1_market | 0 | 0 | 0 | 0 | 0 | 0 | ||||
| - Compensation related to production of own-use capital assets | D1_own-use | 0 | 0 | 0 | 0 | 0 | 0 | ||||
| + Non-market intermediate consumption | P2_nonmarket | 1,560 | 1,650 | 1,582 | 1,645 | 1,755 | 1,894 | ||||
| = Total intermediate consumption | P2 | 1,785 | 1,897 | 1,842 | 1,908 | 2,023 | 2,162 | ||||
| - Intermediate consumption of market establishments | P2_market | -225 | -247 | -260 | -263 | -268 | -268 | ||||
| - Intermediate consumption related to production of own-use capital assets | P2_own-use | 0 | 0 | 0 | 0 | 0 | 0 | ||||
| + Non-market consumption of fixed capital | P51c_nonmarket | 1,331 | 1,398 | 1,447 | 1,502 | 1,550 | 1,550 | ||||
| = Total consumption of fixed capital | P51c | 1,755 | 1,834 | 1,900 | 1,960 | 2,040 | 2,040 | ||||
| - Consumption of fixed capital by market establishments | P51c_market | -424 | -437 | -453 | -458 | -490 | -490 | ||||
| - Consumption of fixed capital related to production of own-use capital assets | P51c_own-use | 0 | 0 | 0 | 0 | 0 | 0 | ||||
| + Other taxes on production, payable | D29_pay | 0 | 0 | 0 | 0 | 0 | 0 | ||||
| - Other subsidies on production, receivable | D39_rec | 0 | 0 | 0 | 0 | 0 | 0 | ||||
| Table 15 Local Government: detailed classification of expenditure and consumption | |||||||||||
| €million | |||||||||||
| Description | ESA2010 code | 2015 | 2016 | 2017 | 2018 | 2019 | 2020 | ||||
| Total Expenditure | TE | 6,179 | 6,547 | 7,138 | 8,375 | 9,580 | 10,055 | ||||
| Expense | 6,706 | 7,056 | 7,368 | 8,006 | 8,584 | 8,954 | |||||
| Compensation of employees | D1 | 1,677 | 1,721 | 1,737 | 1,837 | 1,932 | 2,012 | ||||
| Of which: Related to production of own-use capital assets | 0 | 0 | 0 | 0 | 0 | 0 | |||||
| Use of goods and services plus taxes payable | P2 + D5 + D29 | 1,785 | 1,897 | 1,842 | 1,908 | 2,023 | 2,162 | ||||
| Use of goods and services [Intermediate consumption] | P2 | 1,785 | 1,897 | 1,842 | 1,908 | 2,023 | 2,162 | ||||
| Of which: Intermediate consumption of market establishments | 225 | 247 | 260 | 263 | 268 | 268 | |||||
| Taxes, payable | D5 + D29 | 0 | 0 | 0 | 0 | 0 | 0 | ||||
| Depreciation (Consumption of fixed capital) | P51c | 1,755 | 1,834 | 1,900 | 1,960 | 2,040 | 2,040 | ||||
| Of which: Depreciation by market establishments | 424 | 437 | 453 | 458 | 490 | 490 | |||||
| Interest (excluding FISIM) | D41 | 68 | 82 | 70 | 64 | 86 | 91 | ||||
| Interest payable to central government | D41_CG | 51 | 73 | 64 | 59 | 80 | 84 | ||||
| Other domestic interest payable | D41_S1 | 17 | 9 | 5 | 5 | 7 | 7 | ||||
| Subsidies | D3 | 0 | 0 | 0 | 0 | 0 | 0 | ||||
| Social benefits | D62 + D632 | 1,359 | 1,453 | 1,692 | 1,963 | 2,177 | 2,178 | ||||
| Social benefits in cash | D62 | 366 | 302 | 311 | 348 | 352 | 353 | ||||
| Social benefits in kind (via market producers) | D632 | 993 | 1,151 | 1,382 | 1,615 | 1,825 | 1,825 | ||||
| Other current transfers | D7 | 36 | 33 | 41 | 64 | 67 | 115 | ||||
| Grants to central government | D73_CG | 3 | 3 | 4 | 4 | 5 | 5 | ||||
| Miscellaneous current transfers | D75 | 33 | 30 | 37 | 60 | 62 | 110 | ||||
| Capital transfers | D9 | 26 | 36 | 87 | 208 | 257 | 356 | ||||
| Investment grants | D92 | 13 | 24 | 68 | 176 | 220 | 322 | ||||
| Net acquisition of non-financial assets | P5 + NP - P51c | -526 | -509 | -231 | 369 | 997 | 1,101 | ||||
| = Gross investment in non-financial assets | P5 + NP | 1,229 | 1,325 | 1,670 | 2,329 | 3,037 | 3,141 | ||||
| Gross fixed capital formation | P51 | 1,169 | 1,325 | 1,670 | 2,329 | 3,037 | 3,141 | ||||
| Net acquisition of stocks | P52 | 0 | 0 | 0 | 0 | 0 | 0 | ||||
| Net acquisition of unproduced assets | NP | 60 | 0 | 0 | 0 | 0 | 0 | ||||
| - Consumption of fixed capital | P51c | -1,755 | -1,834 | -1,900 | -1,960 | -2,040 | -2,040 | ||||
| Net expenditure on current goods and services | P3 excl. D632 | 4,159 | 4,297 | 4,288 | 4,461 | 4,618 | 4,834 | ||||
| = Output | P1 | 5,698 | 6,007 | 6,127 | 6,461 | 6,856 | 7,204 | ||||
| - Sales of goods and services | P11+P12+P131 | -1,540 | -1,710 | -1,839 | -2,001 | -2,238 | -2,370 | ||||
| Market output (sales of market establishments) | P11 | -1,131 | -1,238 | -1,361 | -1,477 | -1,619 | -1,749 | ||||
| Output for own final use | P12 | 0 | 0 | 0 | 0 | 0 | 0 | ||||
| Incidental sales and fees of non-market establishments | P131 | -409 | -472 | -478 | -524 | -619 | -621 | ||||
| Final consumption expenditure | P3 | 5,152 | 5,448 | 5,670 | 6,076 | 6,443 | 6,659 | ||||
| = Net expenditure on current goods and services | P3 excl. D632 | 4,159 | 4,297 | 4,288 | 4,461 | 4,618 | 4,834 | ||||
| + Social transfers in kind via market producers | D632 | 993 | 1,151 | 1,382 | 1,615 | 1,825 | 1,825 | ||||
| made up of | |||||||||||
| Individual consumption (= social transfers in kind) | P31 (= D63) | 1,940 | 2,097 | 2,374 | 2,590 | 2,839 | 2,934 | ||||
| Social transfers in kind (via market producers) | D632 | 993 | 1,151 | 1,382 | 1,615 | 1,825 | 1,825 | ||||
| Social transfers in kind (provided directly by government) | D631 | 947 | 946 | 992 | 974 | 1,014 | 1,109 | ||||
| Collective consumption (= actual final consumption of government) | P32 | 3,212 | 3,351 | 3,296 | 3,486 | 3,604 | 3,725 | ||||
| Total social transfers | D62 + D63 | 2,306 | 2,399 | 2,684 | 2,938 | 3,191 | 3,287 | ||||
| Social benefits in cash | D62 | 366 | 302 | 311 | 348 | 352 | 353 | ||||
| Social transfers in kind (= individual consumption) | D63 | 1,940 | 2,097 | 2,374 | 2,590 | 2,839 | 2,934 | ||||
This release comprises the latest official publication by CSO of annual Government Finance Statistics (GFS) results for years 2015 to 2020.
The data published are consistent with the General Government Deficit and Debt levels reported at end-March 2021 under the EU regulation governing the Excessive Deficit Procedure (EDP). Consequently they may not always be fully aligned with the National Income and Expenditure and related publications such as the Institutional Sector Accounts.
Eurostat will publish deficit and debt levels for all EU member states on 22 April 2021.
The tables provide detailed revenue, expenditure and balance sheet data for general government. These data are also available on CSO PxStat.
The full suite of GFS tables are also available on the CSO website.
Data for all EU Member States are available on Eurostat's database.
In addition to the direct expenditure measures included above earlier, other measures had an implicit impact on the GFS aggregates:
Super dividend: In Q2 2020 the exchequer received a super dividend of €1,228 million from the Central Bank of Ireland.
Approved Housing Bodies
As of March 2021, an additional 43 Approved Housing Bodies (AHBs) have been reclassified to the government sector (S.13) from the non-profit institutions serving households sector (S.15). While these bodies were reviewed as they are listed as Tier 2 AHBs, they are involved in other activities, for example, disability service provision, and are in receipt of grants from a number of government departments. Hence, 30 AHBs are classified in the local government sector (S.1313) and 13 bodies classified in the central government sector (S.1311). Eurostat have been notified of the individual AHBs and multi-functional bodies and they will be listed on the Register of Public Bodies on 21 April 2021.
The inclusion of these AHBs into S.13 means that their income, expenditure, assets and liabilities are added to general government. However, any income received from local and central government subsectors has to be consolidated. Likewise, expenditure which has a counterparty in local or central government has been consolidated as appropriate. Only additional income from other sectors of the economy has been added to government income (e.g. receipt of rent from tenants). The main additional expenditure relates to the compensation of employees, intermediate consumption and capital formation.
The impact of the reclassification is included in the time series beginning in 2014 (aligning with ESA 2010 implementation).
Insurance Compensation Fund
A review of the Insurance Compensation Fund (ICF) by Government Accounts Classifications concluded that the ICF should be included in central government sector (S.1311) from 2014 (aligning with ESA 2010 implementation). This has been implemented for the March 2021 EDP notification. The ICF will be listed as an Extra Budgetary Fund under the Department of Finance in the Register of Public Bodies 2020.
National Asset Management Agency (NAMA)
In Q2 2020, NAMA repaid the private shareholders and the State’s ownership in the special purpose vehicle that owns the NAMA group entities increased to 100%. As a result NAMA was automatically reclassified into the general government sector.
The transfer of €2.0 billion to the Exchequer took place after the private shareholders were redeemed and therefore had no impact on the GFS aggregates.
At the end of 2020 the value of the State's assets in Equity and Investment Fund Shares (AF.5, Table 6) stood at €33.7 billion, representing a year-on-year fall of €3.7 billion since Q4 2019. This drop in value was driven by the combination of a reduction in holdings in this asset class of €1.3 billion (Table 5) and a loss in value of these holdings of €2.4 billion, which related mostly to the market value of shares held by the State in Irish banks (Tables 5 and 6).
On the other side of the balance sheet the market value of the State's liabilities grew by 8.2% in 2020 to stand at €266.0 billion at year-end. Borrowing of €15.0 billion (Table 5) through the issuance of bonds to fund Covid-related expenditure was the primary driver of this increase in liabilities. The main offsetting movement was a reduction in loan liabilities (Table 6) that was largely due to further repayments on the UK bilateral loan.
The memo item, ‘estimated pension liabilities of government’ (Tables 2 and 6), has been updated to reflect the data in the supplementary table on the accrued-to-date pension entitlements in social insurance (Table 29) transmitted to Eurostat in December 2020 with reference to 2018 data, see Estimates of Irish Pension Liabilities 2018 published in February 2021. These estimates are compiled every three years in line with Eurostat requirements (Regulation (EU) No 549/2013). By their nature, they are therefore point-in-time estimates. The main difference between these latest estimates and the previous estimates is the discount rate used. The discount rate used for the previous 2015 estimates was 5% in nominal terms (3% in real terms). For the 2018 data, a discount rate of 4% nominal (2% real) was used. The discount rate has a significant impact on the scale of the pension liability and for this reason the data in respect of 2018 is not directly comparable with data in the 2015 publication.
The GDP figures used in this publication are consistent with those published in the National Income and Expenditure accounts published on 20 July 2020 and the Quarterly National Accounts published on 5 March 2021.
Modified Gross National Income (GNI*) is equal to Gross National Income at current market prices less the factor income of redomiciled companies, less depreciation on research and development related intellectual property imports and less depreciation on aircraft related to aircraft leasing.
Government Finance Statistics (GFS) form the basis for fiscal monitoring in Europe, in particular in relation to the Excessive Deficit Procedure (EDP).
European GFS, including EDP statistics, are produced according to the legally binding accounting rules of the European System of Accounts (ESA2010). The Manual on Government Debt and Deficit (MGDD) provides further guidance on the implementation of ESA2010 in the context of GFS.
EU Member States are required to report government deficit/surplus and debt data biannually under the EDP (before 1 April and 1 October in year N) for years N-4 to N-1 calendar years as well as a forecast for the current year. The data are reported in harmonised tables, which provide a consistent framework for the presentation of this data by Member States. The tables provide a structure for linking national budgetary aggregates with government deficit and debt.
Detailed statistics on government revenue and expenditure are also provided to Eurostat under the ESA transmission programme. For annual data the main tables reported are:
Table 0200 Revenue and expenditure of general government and sub-sectors
Tables 0900 and 0999 Taxes and national tax list
These data are available on the Eurostat website .
The general government sector of the economy, is defined in ESA2010 paragraph 2.111: as “institutional units which are non-market producers whose output is intended for individual and collective consumption, and are financed by compulsory payments made by units belonging to other sectors, and institutional units principally engaged in the redistribution of national income and wealth.” General government comprises the sub-sectors central government (S.1311), state government (S.1312 – which does not apply in Ireland), local government (S.1313), and social security funds (S.1314 – which does not apply in Ireland),
General government balance is the standard European measure of the fiscal balance, which is used to monitor compliance with the Stability and Growth Pact.
This measure is by definition equal to both Total Revenue (TR) less Total Expenditure (TE), and Net Acquisition of Financial Assets less Net Incurrence of Liabilities as shown in the GFS release.
A listing of some of the main items included in this release is shown below.
P.2 Intermediate consumption – value of goods and services used in the process of production, excluding fixed assets
P.5 Gross capital formation
P.51g Gross fixed capital formation - acquisitions, less disposals, of fixed assets during a given period plus certain additions to the value of non-produced assets realised by productive activity. Fixed assets are tangible or intangible assets produced as outputs from processes of production that are themselves used repeatedly, or continuously, in processes of production for more than one year
P.51c Consumption of fixed capital - the amount of fixed assets used up, during the period under consideration, as a result of normal wear and tear and foreseeable obsolescence, including a provision for losses of fixed assets as a result of accidental damage which can be insured against.
P.52 Changes in inventories
P.53 Acquisitions less disposals of valuables
D.1 Compensation of employees – the total remuneration of government employees
D.29 Other taxes on production (payable) all taxes that enterprises incur as a result of engaging in production, independently of the quantity or value of the goods and services produced or sold. These include taxes on use or ownership of land or buildings, taxes on use of fixed assets, taxes on total wage bill and payroll, taxes on international transactions related to production.
D.3 Subsidies (payable) - current unrequited payments which general government or the institutions of the European Union make to resident producers, with the objective of influencing their levels of production, their prices or the remuneration of the factors of production
D.4 Property income accrues when the owners of financial assets and natural resources put them at the disposal of other units of the economy. The income payable for the use of financial assets is called investment income, while that payable for the use of a natural resource is called rent. Property income is the sum of investment income and rent.
D.41 Interest receivable by the owners of a financial asset for putting it at the disposal of another institutional unit - applies to deposits (AF.2), debt securities (AF.3), loans (AF.4) and other accounts payable (AF.8)
D.42 Dividends receivable by the owners of share equities. Dividends exclude "super dividends" which arise where the dividend paid is large relative to the recent level of dividends and earnings. Super dividends are recorded as withdrawal of equity (F.5). This arises, for example, in the case of dividends paid by the Central Bank in 2015.
D.45 Rent of a natural resource – income receivable by the owner of a natural resource for putting the resource at the disposal of another party.
D.5 Current taxes on income, wealth, etc., (payable) - all compulsory, unrequited payments, in cash or in kind, levied periodically by general government and by the rest of the world on the income and wealth of units in the economy, and some periodic taxes which are assessed neither on income nor wealth
D.6 Social contributions - transfers to households, in cash or in kind, intended to relieve them from the financial burden of a number of risks or needs.
D.7 Other current transfers – includes VAT and GNI based EU budget contributions, current transfers between subsectors of government, current international co-operation and current transfers to households and non-profit institutions.
D.9 Capital transfers - involve the acquisition or disposal of an asset, or assets, by at least one of the parties to the transaction. Includes capital taxes and investment grants.
P.1 Total output of Government is equal to market output, own account capital formation, and non-market output (i.e. the sum of D.1+P.2+P51c). The market output referred to in this publication is the imputed market value of social housing rented dwellings. See Table 3.
P.3 Final consumption expenditure of Government is equal to the total of its output (P.1) plus the expenditure on products/services supplied to households via market producers minus the sales of goods and services (at both market and non-market prices). This is made up of individual non-market services plus collective non-market services (P.31 and P.32). See Table 4.
F.1 Monetary gold and special drawing rights (SDRs)
F.11 Monetary gold
F.12 Special drawing rights (SDRs)
F.2 Currency and deposits
F.21 Currency
F.22 Transferable deposits
F.29 Other deposits
F.3 Debt securities
F.31 Short-term
F.32 Long-term
F.4 Loans
F.41 - Short-term loans
F.42 - Long-term loans
F.5 Equity and investment fund shares
F.51 Equity
F.52 Investment fund shares/units
F.6 Insurance pension and standardised guarantee schemes
F.7 Financial derivatives and employee stock options
F.71 Financial derivatives
F.72 Employee stock options
F.8 Other accounts receivable/payable
F.81 Trade credits and advances
F.89 Other trade credits
 Hide Background Notes
Scan the QR code below to view this release online or go to
http://www.cso.ie/en/releasesandpublications/er/gfsa/governmentfinancestatisticsapril2021/
 Show Table 1 General Government Transactions: Revenue, Expenditure, Financing and Deficit
 Hide Table 1 General Government Transactions: Revenue, Expenditure, Financing and Deficit