
| Seasonally adjusted | |||
| € million | |||
| Exports | Imports | Surplus | |
| May 2017 | 10,546 | 7,019 | 3,527 |
| June 2017 | 9,847 | 6,779 | 3,068 |
| July 2017 | 9,690 | 5,594 | 4,096 |
| August 2017 | 9,653 | 6,200 | 3,453 |
| September 2017 | 9,863 | 6,348 | 3,515 |
| October 2017 | 9,651 | 5,722 | 3,930 |
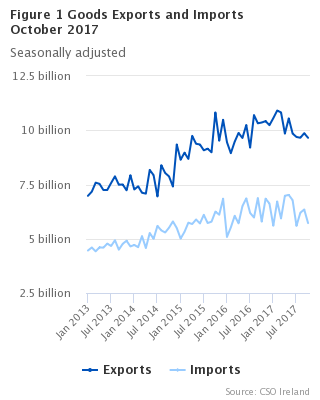
Seasonally adjusted goods exports decreased by €212 million (-2%) to €9,651 million in October 2017, compared with September 2017, according to preliminary figures.
Seasonally adjusted goods imports decreased by €626 million (-10%) to €5,722 million leading to an increase of €414 million (+12%) in the seasonally adjusted trade surplus to €3,930 million in October 2017 (see Table 2).
Exports of Organic chemicals decrease in October
The (unadjusted) value of goods exports for October 2017 was €9,461 million, a decrease of €738 million (-7%) when compared with October 2016. The value of goods exports for the period January to October 2017 was €100,868 million, an increase of €2,189 million (+2%) when compared with the first ten months of 2016.
Exports of Organic chemicals decreased by €757 million (-31%) to €1,652 million in October 2017 compared with October 2016.
Exports of Electrical machinery, apparatus and appliances decreased by €341 million (-46%) to €399 million.
Exports of Medical and pharmaceutical products increased by €312 million (+12%) to €3,001 million.
Exports of Food and live animals increased by €84 million (+10%) to €933 million over the same comparative period. This was mainly due to increases in the exports of Meat and meat preparations and Dairy products and birds’ eggs.
Imports of Mineral fuels products increase in October
The (unadjusted) value of goods imports for October 2017 was €5,939 million, an increase of €240 million (+4%) when compared with October 2016. The value of goods imports for January to October was €62,439 million, which is an increase of €2,114 million (+4%) compared with the first ten months of 2016.
Imports of Medical and pharmaceutical products increased by €125 million (+27%) to €587 million in October 2017 compared with October 2016.
Imports of Mineral fuels increased by €109 million (+36%) to €415 million over the same comparative period, mainly due to an increase in the imports of Petroleum.
Imports of Food and live animals increased by €85 million (+15%) to €642 million.
The value of goods imports for October 2017 excluding SITC 79 (Other transport equipment, including aircraft) was €5,148 million, an increase of €589 million (+13%) when compared with the corresponding October 2016 figure of €4,559 million. The corresponding figure for January to October 2017 was €50,772 million, an increase of €3,923 million (+8%) compared with the first ten months of 2016.
Exports and imports with Great Britain increase in October
Exports to Great Britain increased by €134 million (+13%) to €1,144 million in October 2017 compared with October 2016. The majority of this increase was in the exports of Chemicals and related products. (see Table 5). Exports to Great Britain increased in January to October by €1,305 million (+12%) compared with the first ten months of 2016.
Imports from Great Britain increased by €111 million (+8%) to €1,485 million in October 2017 compared with October 2016. The main increases were in the imports of Mineral fuels, lubricants and related materials and Food and live animals. Imports from Great Britain for the first ten months of 2017 increased by €1,117 million (+9%) to €13,961 million compared with the same period of 2016.
Geographic breakdown of goods exports and imports
The EU accounted for €5,085 million (54%) of total goods exports in October 2017, an increase of €332 million (+7%) compared with October 2016. Exports to Belgium were €1,160 million and to France were €607 million.
The USA was the main non-EU destination accounting for €2,389 million (25%) of total exports in October 2017.
The EU accounted for 63% of the value of goods imports in October 2017. Total EU imports of €3,739 million represents an increase of €230 million (+7%) compared with October 2016.
The USA with €948 million (16%) and China with €430 million (7%) were the main non-EU sources of imports. The total value of imports from non-EU countries in October 2017 was €2,200 million, an increase of €10 million compared with October 2016.
| NOTE: From the October 2017 External trade release, the CSO have expanded the range of detailed trade data available on CSO’s Statbank. The extra detail includes further breakdown of trade at SITC2 level by country and area. The countries and area for which this detail is available are those included in Table 4 of the release. The data is available on a month by month basis for the periods January 2015 to the latest month of release and on an annual basis from 2010 to 2016. Links to these data are contained within the body of the release. The latest month's data should be treated as provisional. For queries on trade with countries not included in the list, please contact trade@cso.ie. |
| Table 1 Goods Exports and Imports summary analysis | |||||||||
| Period | Value1 | Volume index2 | Unit value index2 | ||||||
| Exports | Imports | Trade surplus | Base year 2010=100 | ||||||
| €m | €m | €m | Exports | Imports | Exports | Imports | Terms of trade3 | ||
| 2010 | 90,924 | 48,695 | 42,229 | 100.0 | 100.0 | 100.0 | 100.0 | 100.0 | |
| 2011 | 93,191 | 53,035 | 40,155 | 106.1 | 110.4 | 96.6 | 98.7 | 97.9 | |
| 2012 | 93,507 | 56,179 | 37,328 | 100.6 | 120.2 | 102.2 | 96.0 | 106.5 | |
| 2013 | 89,182 | 55,787 | 33,394 | 101.1 | 123.5 | 97.0 | 92.8 | 104.6 | |
| 2014 | 92,616 | 62,158 | 30,458 | 103.8 | 130.1 | 98.2 | 98.1 | 100.1 | |
| 2015 | 112,407 | 70,111 | 42,296 | 115.5 | 143.6 | 106.8 | 100.3 | 106.5 | |
| 2016 | 119,292 | 74,131 | 45,162 | 125.6 | 158.2 | 102.7 | 93.3 | 110.2 | |
| 2014 | Quarter 1 | 21,765 | 15,227 | 6,538 | 102.1 | 129.8 | 93.7 | 96.5 | 97.2 |
| Quarter 2 | 23,559 | 14,745 | 8,814 | 105.9 | 127.7 | 97.8 | 94.9 | 103.0 | |
| Quarter 3 | 23,271 | 15,345 | 7,926 | 103.6 | 127.5 | 98.9 | 98.9 | 100.0 | |
| Quarter 4 | 24,021 | 16,840 | 7,180 | 103.3 | 139.1 | 102.3 | 99.5 | 102.9 | |
| 2015 | Quarter 1 | 26,043 | 16,864 | 9,179 | 110.0 | 138.6 | 104.0 | 99.9 | 104.2 |
| Quarter 2 | 28,705 | 16,983 | 11,721 | 114.7 | 134.9 | 110.1 | 103.6 | 106.4 | |
| Quarter 3 | 27,477 | 16,738 | 10,739 | 114.5 | 134.9 | 105.5 | 102.1 | 103.5 | |
| Quarter 4 | 30,183 | 19,526 | 10,657 | 123.6 | 168.1 | 107.4 | 95.4 | 112.5 | |
| 2016 | Quarter 1 | 27,813 | 17,600 | 10,214 | 119.5 | 158.0 | 100.7 | 89.4 | 112.6 |
| Quarter 2 | 30,307 | 18,919 | 11,388 | 129.0 | 159.5 | 102.0 | 94.8 | 107.6 | |
| Quarter 3 | 30,361 | 18,106 | 12,254 | 126.5 | 152.5 | 103.6 | 94.2 | 110.1 | |
| Quarter 4 | 30,812 | 19,506 | 11,306 | 127.6 | 162.8 | 104.6 | 94.7 | 110.5 | |
| 2017 | Quarter 1 | 31,502 | 18,744 | 12,758 | 135.4 | 157.1 | 102.4 | 98.0 | 104.4 |
| Quarter 2 | 31,046 | 20,493 | 10,553 | 136.7 | 179.0 | 99.9 | 94.1 | 106.2 | |
| Quarter 3 | 28,859 | 17,262 | 11,598 | 132.9 | 148.5 | 96.0 | 95.5 | 100.4 | |
| 2014 | January | 7,085 | 5,181 | 1,904 | 99.6 | 131.8 | 93.9 | 96.9 | 96.9 |
| February | 6,959 | 4,611 | 2,348 | 98.9 | 116.3 | 92.9 | 97.7 | 95.1 | |
| March | 7,720 | 5,434 | 2,286 | 107.9 | 141.3 | 94.4 | 94.8 | 99.6 | |
| April | 7,322 | 4,866 | 2,455 | 102.7 | 129.3 | 94.1 | 92.7 | 101.5 | |
| May | 8,158 | 4,972 | 3,187 | 109.6 | 130.1 | 98.2 | 94.2 | 104.2 | |
| June | 8,080 | 4,907 | 3,172 | 105.4 | 123.6 | 101.2 | 97.9 | 103.4 | |
| July | 7,252 | 5,267 | 1,984 | 96.3 | 133.1 | 99.4 | 97.5 | 101.9 | |
| August | 7,773 | 4,795 | 2,978 | 104.8 | 118.7 | 97.9 | 99.6 | 98.3 | |
| September | 8,247 | 5,283 | 2,964 | 109.6 | 130.8 | 99.3 | 99.6 | 99.7 | |
| October | 7,932 | 5,586 | 2,347 | 102.7 | 139.0 | 101.9 | 99.0 | 102.9 | |
| November | 7,864 | 5,584 | 2,280 | 99.1 | 138.2 | 104.7 | 99.5 | 105.2 | |
| December | 8,224 | 5,671 | 2,553 | 108.1 | 140.0 | 100.4 | 99.8 | 100.6 | |
| 2015 | January | 8,290 | 5,368 | 2,922 | 106.3 | 131.7 | 102.9 | 100.5 | 102.4 |
| February | 8,348 | 5,136 | 3,212 | 106.9 | 129.5 | 103.0 | 97.8 | 105.4 | |
| March | 9,405 | 6,360 | 3,045 | 116.8 | 154.6 | 106.2 | 101.4 | 104.8 | |
| April | 9,614 | 5,637 | 3,977 | 115.0 | 131.8 | 110.3 | 105.4 | 104.6 | |
| May | 9,180 | 5,535 | 3,645 | 109.5 | 127.7 | 110.6 | 106.8 | 103.6 | |
| June | 9,911 | 5,811 | 4,099 | 119.5 | 145.3 | 109.4 | 98.5 | 111.0 | |
| July | 9,413 | 5,765 | 3,648 | 115.1 | 138.3 | 107.9 | 102.7 | 105.0 | |
| August | 8,626 | 5,209 | 3,416 | 112.1 | 122.5 | 101.6 | 104.8 | 97.0 | |
| September | 9,438 | 5,763 | 3,675 | 116.3 | 143.8 | 107.1 | 98.7 | 108.5 | |
| October | 10,754 | 6,336 | 4,418 | 128.0 | 164.7 | 110.9 | 94.8 | 116.9 | |
| November | 10,179 | 6,196 | 3,983 | 128.2 | 158.0 | 104.8 | 96.6 | 108.4 | |
| December | 9,251 | 6,994 | 2,256 | 114.5 | 181.6 | 106.6 | 94.9 | 112.3 | |
| 2016 | January | 8,893 | 5,136 | 3,757 | 120.9 | 142.6 | 95.6 | 87.0 | 110.0 |
| February | 8,566 | 5,473 | 3,093 | 105.0 | 144.4 | 106.0 | 91.6 | 115.8 | |
| March | 10,354 | 6,991 | 3,364 | 132.6 | 187.0 | 100.6 | 89.7 | 112.1 | |
| April | 10,053 | 5,585 | 4,468 | 125.8 | 144.6 | 104.1 | 93.4 | 111.5 | |
| May | 9,385 | 6,404 | 2,982 | 123.6 | 164.7 | 99.0 | 94.2 | 105.0 | |
| June | 10,868 | 6,930 | 3,938 | 137.7 | 169.3 | 102.8 | 96.7 | 106.4 | |
| July | 9,411 | 5,731 | 3,680 | 120.4 | 144.2 | 101.9 | 96.2 | 106.0 | |
| August | 10,464 | 5,715 | 4,750 | 130.8 | 146.1 | 103.4 | 93.1 | 111.1 | |
| September | 10,486 | 6,661 | 3,824 | 128.2 | 167.1 | 105.6 | 93.4 | 113.1 | |
| October | 10,199 | 5,700 | 4,499 | 129.3 | 142.6 | 103.1 | 95.9 | 107.5 | |
| November | 11,201 | 7,236 | 3,965 | 140.6 | 183.9 | 104.1 | 94.4 | 110.3 | |
| December | 9,412 | 6,570 | 2,842 | 113.0 | 162.0 | 106.6 | 93.7 | 113.8 | |
| 20174 | January | 9,705 | 5,724 | 3,981 | 122.6 | 143.1 | 104.5 | 98.5 | 106.0 |
| February | 10,000 | 6,249 | 3,751 | 133.5 | 156.7 | 98.9 | 98.3 | 100.6 | |
| March | 11,797 | 6,771 | 5,026 | 150.2 | 171.6 | 103.7 | 97.2 | 106.6 | |
| April | 9,850 | 6,459 | 3,391 | 127.4 | 164.7 | 102.0 | 96.6 | 105.6 | |
| May | 10,548 | 7,174 | 3,374 | 140.2 | 188.9 | 99.3 | 93.6 | 106.1 | |
| June | 10,648 | 6,860 | 3,788 | 142.6 | 183.5 | 98.5 | 92.1 | 107.0 | |
| July | 9,142 | 5,259 | 3,883 | 118.3 | 134.5 | 102.0 | 96.4 | 105.8 | |
| August | 9,581 | 5,889 | 3,692 | 133.1 | 154.5 | 95.0 | 93.9 | 101.1 | |
| September | 10,136 | 6,113 | 4,023 | 147.2 | 156.4 | 90.9 | 96.3 | 94.3 | |
| October | 9,461 | 5,939 | 3,521 | 139.4 | 157.7 | 89.6 | 92.8 | 96.6 | |
| 1 Trade statistics revised since 2000, see background notes. | |||||||||
| 2 Monthly data have been rescaled to make their average equal to the annual. | |||||||||
| 3 Export unit value index divided by Import unit value index. | |||||||||
| 4 Revised. October 2017 is based on current Intrastat response levels. See background notes. | |||||||||
| Table 2 Goods Exports and Imports seasonally adjusted1 series | ||||||
| Period | Value | Volume index | ||||
| Exports | Imports | Trade surplus | Base year 2010=100 | |||
| €m | €m | €m | Exports | Imports | ||
| 2013 | Quarter 1 | 21,731 | 13,474 | 8,257 | 93.8 | 121.8 |
| Quarter 2 | 22,023 | 13,966 | 8,057 | 102.1 | 122.5 | |
| Quarter 3 | 22,935 | 14,093 | 8,841 | 105.9 | 123.8 | |
| Quarter 4 | 22,660 | 14,319 | 8,342 | 104.5 | 127.0 | |
| 2014 | Quarter 1 | 21,807 | 14,448 | 7,359 | 102.0 | 124.2 |
| Quarter 2 | 23,183 | 14,834 | 8,349 | 105.1 | 128.0 | |
| Quarter 3 | 23,369 | 16,264 | 7,105 | 104.0 | 134.1 | |
| Quarter 4 | 24,624 | 16,804 | 7,820 | 105.5 | 138.8 | |
| 2015 | Quarter 1 | 26,286 | 16,062 | 10,224 | 112.0 | 130.9 |
| Quarter 2 | 28,460 | 17,271 | 11,189 | 112.9 | 134.8 | |
| Quarter 3 | 27,211 | 17,612 | 9,599 | 113.7 | 143.5 | |
| Quarter 4 | 30,823 | 19,205 | 11,618 | 125.8 | 167.6 | |
| 2016 | Quarter 1 | 27,866 | 16,660 | 11,206 | 119.7 | 149.6 |
| Quarter 2 | 29,759 | 19,075 | 10,684 | 126.5 | 161.3 | |
| Quarter 3 | 30,221 | 19,042 | 11,178 | 125.7 | 161.2 | |
| Quarter 4 | 31,010 | 19,262 | 11,749 | 129.0 | 159.6 | |
| 2017 | Quarter 1 | 32,287 | 18,257 | 14,030 | 136.0 | 151.5 |
| Quarter 2 | 30,240 | 20,779 | 9,461 | 133.7 | 183.0 | |
| Quarter 3 | 29,207 | 18,143 | 11,065 | 135.2 | 158.4 | |
| 2013 | January | 6,977 | 4,457 | 2,520 | 93.6 | 124.6 |
| February | 7,170 | 4,597 | 2,574 | 93.3 | 122.4 | |
| March | 7,584 | 4,420 | 3,164 | 94.6 | 118.3 | |
| April | 7,531 | 4,603 | 2,928 | 98.8 | 121.5 | |
| May | 7,246 | 4,589 | 2,657 | 101.2 | 121.4 | |
| June | 7,246 | 4,775 | 2,472 | 106.2 | 124.7 | |
| July | 7,568 | 4,666 | 2,902 | 110.5 | 122.2 | |
| August | 7,876 | 4,932 | 2,944 | 105.0 | 128.9 | |
| September | 7,490 | 4,495 | 2,995 | 102.3 | 120.2 | |
| October | 7,501 | 4,765 | 2,736 | 105.7 | 125.9 | |
| November | 7,233 | 4,908 | 2,325 | 99.4 | 130.7 | |
| December | 7,927 | 4,646 | 3,281 | 108.5 | 124.5 | |
| 2014 | January | 7,273 | 4,713 | 2,560 | 102.9 | 121.7 |
| February | 7,415 | 4,612 | 2,803 | 104.2 | 117.9 | |
| March | 7,119 | 5,123 | 1,996 | 99.0 | 133.0 | |
| April | 7,080 | 4,572 | 2,508 | 100.6 | 123.0 | |
| May | 8,171 | 5,264 | 2,907 | 109.9 | 134.6 | |
| June | 7,932 | 4,998 | 2,934 | 104.8 | 126.4 | |
| July | 6,951 | 5,591 | 1,360 | 92.7 | 140.2 | |
| August | 8,388 | 5,384 | 3,004 | 113.3 | 131.3 | |
| September | 8,030 | 5,289 | 2,741 | 105.9 | 130.7 | |
| October | 7,873 | 5,509 | 2,364 | 100.2 | 135.3 | |
| November | 7,408 | 5,799 | 1,609 | 94.1 | 144.6 | |
| December | 9,343 | 5,496 | 3,848 | 122.2 | 136.4 | |
| 2015 | January | 8,641 | 5,007 | 3,633 | 110.1 | 126.5 |
| February | 8,966 | 5,316 | 3,650 | 115.2 | 130.5 | |
| March | 8,679 | 5,739 | 2,941 | 110.6 | 135.6 | |
| April | 9,740 | 5,678 | 4,061 | 117.7 | 129.0 | |
| May | 9,376 | 5,887 | 3,489 | 107.8 | 133.7 | |
| June | 9,345 | 5,706 | 3,639 | 113.3 | 141.7 | |
| July | 9,076 | 6,102 | 2,974 | 113.6 | 147.5 | |
| August | 9,150 | 5,725 | 3,425 | 117.8 | 137.4 | |
| September | 8,986 | 5,786 | 3,200 | 109.6 | 145.7 | |
| October | 10,820 | 6,250 | 4,570 | 128.0 | 165.5 | |
| November | 9,521 | 6,108 | 3,413 | 120.4 | 158.1 | |
| December | 10,482 | 6,846 | 3,635 | 129.0 | 179.1 | |
| 2016 | January | 9,449 | 5,084 | 4,365 | 127.0 | 145.3 |
| February | 8,944 | 5,520 | 3,424 | 108.7 | 143.8 | |
| March | 9,473 | 6,056 | 3,417 | 123.3 | 159.6 | |
| April | 9,875 | 5,712 | 4,163 | 125.3 | 148.7 | |
| May | 9,643 | 6,503 | 3,140 | 124.8 | 167.8 | |
| June | 10,241 | 6,860 | 3,381 | 129.4 | 167.4 | |
| July | 9,202 | 6,188 | 3,014 | 118.3 | 156.8 | |
| August | 10,698 | 5,978 | 4,720 | 132.1 | 155.2 | |
| September | 10,321 | 6,876 | 3,444 | 126.7 | 171.6 | |
| October | 10,356 | 5,791 | 4,565 | 130.1 | 144.4 | |
| November | 10,420 | 6,848 | 3,572 | 130.0 | 171.3 | |
| December | 10,234 | 6,623 | 3,612 | 127.0 | 163.1 | |
| 2017 | January | 10,558 | 5,602 | 4,955 | 129.2 | 139.4 |
| February | 10,906 | 6,718 | 4,188 | 140.1 | 166.2 | |
| March | 10,824 | 5,937 | 4,887 | 138.8 | 149.0 | |
| April | 9,847 | 6,981 | 2,866 | 128.9 | 178.8 | |
| May | 10,546 | 7,019 | 3,527 | 137.5 | 187.7 | |
| June | 9,847 | 6,779 | 3,068 | 134.6 | 182.6 | |
| July | 9,690 | 5,594 | 4,096 | 125.5 | 145.0 | |
| August | 9,653 | 6,200 | 3,453 | 133.4 | 163.9 | |
| September | 9,863 | 6,348 | 3,515 | 146.6 | 166.2 | |
| October | 9,651 | 5,722 | 3,930 | 138.1 | 150.5 | |
| 1 Based on seasonal patterns up to December 2016. Accordingly all values in this table may have been revised. | ||||||
| Table 3 Goods Exports and Imports classified by commodity1 | ||||||||||
| €million | ||||||||||
| SITC (Rev 4) | Exports | Imports | ||||||||
| Oct | Oct | Jan-Oct | Jan-Oct | Oct | Oct | Jan-Oct | Jan-Oct | |||
| 2016 | 2017 | 2016 | 2017 | 2016 | 2017 | 2016 | 2017 | |||
| 0 | Food and live animals | 849 | 933 | 8,174 | 9,364 | 557 | 642 | 5,405 | 5,842 | |
| 00 | Live animals other than animals of Division 03 | 29 | 38 | 231 | 315 | 35 | 49 | 143 | 164 | |
| 01 | Meat and meat preparations | 302 | 323 | 2,920 | 3,132 | 81 | 86 | 781 | 794 | |
| 02 | Dairy products and birds' eggs | 153 | 191 | 1,423 | 2,001 | 48 | 66 | 497 | 645 | |
| 03 | Fish, crustaceans, molluscs and preparations thereof | 40 | 40 | 438 | 505 | 21 | 24 | 216 | 239 | |
| 04 | Cereals and cereal preparations | 38 | 39 | 314 | 345 | 92 | 99 | 852 | 898 | |
| 05 | Vegetables and fruit | 22 | 23 | 234 | 252 | 97 | 101 | 1,015 | 1,046 | |
| 06 | Sugars, sugar preparations and honey | 11 | 12 | 188 | 131 | 31 | 33 | 316 | 316 | |
| 07 | Coffee, tea, cocoa, spices and manufactures thereof | 31 | 29 | 319 | 305 | 56 | 62 | 464 | 491 | |
| 08 | Feeding stuff for animals (excluding unmilled cereals) | 25 | 28 | 227 | 263 | 48 | 62 | 602 | 661 | |
| 09 | Miscellaneous edible products and preparations | 198 | 210 | 1,881 | 2,114 | 49 | 60 | 518 | 587 | |
| 1 | Beverages and tobacco | 135 | 135 | 1,101 | 1,111 | 78 | 87 | 760 | 745 | |
| 11 | Beverages | 135 | 134 | 1,066 | 1,106 | 75 | 74 | 684 | 661 | |
| 12 | Tobacco and tobacco manufactures | 0 | 1 | 35 | 4 | 2 | 13 | 76 | 83 | |
| 2 | Crude materials, inedible, except fuels | 119 | 141 | 1,244 | 1,468 | 61 | 78 | 682 | 747 | |
| 21 | Hides, skins and furskins, raw | 12 | 11 | 105 | 110 | 0 | 0 | 0 | 0 | |
| 22 | Oil seeds and oleaginous fruits | 1 | 1 | 11 | 7 | 2 | 2 | 24 | 27 | |
| 23 | Crude rubber (including synthetic and reclaimed) | 0 | 0 | 1 | 1 | 1 | 1 | 8 | 10 | |
| 24 | Cork and wood | 13 | 10 | 136 | 119 | 14 | 16 | 127 | 133 | |
| 25 | Pulp and waste paper | 5 | 6 | 53 | 62 | 3 | 5 | 45 | 51 | |
| 26 | Textile fibres and their wastes | 12 | 12 | 112 | 109 | 1 | 1 | 12 | 11 | |
| 27 | Crude fertilisers and minerals (excluding coal, petroleum and precious stones) | 7 | 10 | 105 | 109 | 11 | 12 | 115 | 135 | |
| 28 | Metalliferous ores and metal scrap | 59 | 81 | 618 | 846 | 17 | 20 | 183 | 202 | |
| 29 | Crude animal and vegetable materials nes | 10 | 10 | 103 | 104 | 12 | 21 | 167 | 177 | |
| 3 | Mineral fuels, lubricants and related materials | 45 | 70 | 567 | 859 | 306 | 415 | 3,022 | 3,797 | |
| 32 | Coal, coke and briquettes | 6 | 8 | 86 | 81 | 4 | 16 | 113 | 159 | |
| 33 | Petroleum, petroleum products and related materials | 35 | 49 | 423 | 668 | 245 | 322 | 2,314 | 3,007 | |
| 34 | Gas, natural and manufactured | 1 | 1 | 11 | 12 | 56 | 72 | 582 | 596 | |
| 35 | Electric current | 3 | 12 | 47 | 98 | 1 | 5 | 13 | 36 | |
| 4 | Animal and vegetable oils, fats and waxes | 6 | 8 | 64 | 82 | 19 | 20 | 201 | 224 | |
| 41 | Animal oils and fats | 6 | 8 | 56 | 72 | 1 | 2 | 16 | 18 | |
| 42 | Fixed vegetable fats and oils | 1 | 1 | 6 | 9 | 15 | 16 | 162 | 189 | |
| 43 | Animal or vegetable fats and oils, processed; waxes | 0 | 0 | 2 | 1 | 2 | 2 | 23 | 17 | |
| 5 | Chemicals and related products | 6,066 | 5,611 | 55,383 | 56,265 | 1,072 | 1,297 | 12,164 | 14,525 | |
| 51 | Organic chemicals | 2,409 | 1,652 | 20,251 | 15,982 | 251 | 284 | 3,549 | 2,846 | |
| 52 | Inorganic chemicals | 12 | 14 | 144 | 116 | 20 | 27 | 222 | 270 | |
| 53 | Dyeing, tanning and colouring materials | 29 | 23 | 209 | 306 | 18 | 22 | 190 | 210 | |
| 54 | Medical and pharmaceutical products | 2,688 | 3,001 | 24,562 | 29,606 | 463 | 587 | 4,936 | 7,616 | |
| 55 | Essential oils; perfume materials; toilet and cleansing preparations | 603 | 556 | 6,653 | 6,369 | 132 | 134 | 1,145 | 1,199 | |
| 56 | Fertilisers (other than those of Division 27) | 0 | 0 | 4 | 93 | 13 | 24 | 275 | 315 | |
| 57 | Plastics in primary forms | 25 | 27 | 298 | 290 | 63 | 85 | 675 | 796 | |
| 58 | Plastics in non-primary forms | 36 | 39 | 400 | 410 | 46 | 49 | 478 | 508 | |
| 59 | Chemical materials and products nes | 265 | 300 | 2,862 | 3,091 | 65 | 82 | 694 | 765 | |
| 6 | Manufactured goods classified chiefly by material | 178 | 189 | 1,807 | 1,876 | 399 | 480 | 3,968 | 4,214 | |
| 61 | Leather; leather manufactures nes; dressed furskins | 4 | 4 | 33 | 34 | 2 | 2 | 18 | 16 | |
| 62 | Rubber manufactures nes | 6 | 7 | 68 | 65 | 22 | 26 | 256 | 251 | |
| 63 | Cork and wood manufactures (excluding furniture) | 23 | 24 | 217 | 240 | 21 | 25 | 215 | 241 | |
| 64 | Paper, paperboard and articles thereof | 13 | 15 | 130 | 131 | 73 | 75 | 718 | 724 | |
| 65 | Textile yarn, fabrics, made-up articles and related products | 14 | 11 | 141 | 122 | 38 | 45 | 383 | 399 | |
| 66 | Non-metallic mineral manufactures nes | 39 | 39 | 383 | 390 | 45 | 55 | 435 | 460 | |
| 67 | Iron and steel | 12 | 15 | 135 | 142 | 53 | 69 | 542 | 611 | |
| 68 | Non-ferrous metals | 8 | 10 | 70 | 87 | 42 | 81 | 462 | 509 | |
| 69 | Manufactures of metals nes | 58 | 65 | 629 | 666 | 102 | 102 | 940 | 1,003 | |
| 7 | Machinery and transport equipment | 1,527 | 1,037 | 17,526 | 16,503 | 2,282 | 1,923 | 25,628 | 23,784 | |
| 71 | Power generating machinery and equipment | 63 | 54 | 559 | 631 | 87 | 72 | 647 | 832 | |
| 72 | Machinery specialised for particular industries | 40 | 49 | 578 | 583 | 93 | 91 | 1,049 | 1,075 | |
| 73 | Metalworking machinery | 2 | 3 | 20 | 29 | 9 | 8 | 93 | 97 | |
| 74 | General industrial machinery and equipment nes and parts nes | 139 | 122 | 1,415 | 1,540 | 126 | 133 | 1,314 | 1,292 | |
| 75 | Office machines and automatic data processing machines (including computers) | 272 | 265 | 3,030 | 2,765 | 302 | 263 | 2,766 | 2,713 | |
| 76 | Telecommunications and sound equipment | 64 | 76 | 741 | 834 | 141 | 155 | 1,260 | 1,277 | |
| 77 | Electrical machinery, apparatus and appliances nes and parts | 740 | 399 | 5,796 | 5,585 | 198 | 210 | 2,039 | 2,100 | |
| 78 | Road vehicles (including air-cushion vehicles) | 24 | 23 | 267 | 261 | 185 | 199 | 2,985 | 2,731 | |
| 79 | Other transport equipment (including aircraft) | 183 | 45 | 5,120 | 4,277 | 1,141 | 792 | 13,475 | 11,666 | |
| 8 | Miscellaneous manufactured articles | 1,204 | 1,185 | 12,101 | 12,396 | 740 | 792 | 6,726 | 6,760 | |
| 81 | Prefab buildings; plumbing and electrical fixtures and fittings | 14 | 14 | 135 | 121 | 25 | 26 | 200 | 216 | |
| 82 | Furniture and parts thereof; bedding, cushions etc | 14 | 15 | 158 | 155 | 38 | 39 | 359 | 393 | |
| 83 | Travel goods, handbags and similar containers | 2 | 1 | 22 | 21 | 11 | 13 | 112 | 121 | |
| 84 | Articles of apparel; clothing accessories | 35 | 21 | 277 | 222 | 170 | 178 | 1,549 | 1,495 | |
| 85 | Footwear | 5 | 4 | 40 | 33 | 31 | 38 | 323 | 336 | |
| 87 | Professional, scientific and controlling apparatus nes | 475 | 464 | 4,973 | 5,049 | 131 | 150 | 1,407 | 1,424 | |
| 88 | Photographic apparatus; optical goods; watches and clocks | 105 | 112 | 1,022 | 1,131 | 38 | 36 | 343 | 354 | |
| 89 | Miscellaneous manufactured articles nes | 555 | 552 | 5,474 | 5,664 | 295 | 310 | 2,434 | 2,422 | |
| 9 | Commodities and transactions not classified elsewhere | 15 | 43 | 185 | 326 | 33 | 40 | 302 | 349 | |
| Unclassified estimates2 | 55 | 109 | 526 | 618 | 153 | 166 | 1,467 | 1,451 | ||
| Total | 10,199 | 9,461 | 98,679 | 100,868 | 5,700 | 5,939 | 60,325 | 62,439 | ||
| 1 Trade statistics revised since 2000. October 2017 is based on current Intrastat response levels. See background notes. | ||||||||||
| 2 Estimates for which a commodity classification is not available. | ||||||||||
| Table 4 Goods Exports and Imports classified by country1 | ||||||||
| €million | ||||||||
| Country | Exports | Imports | ||||||
| Oct | Oct | Jan-Oct | Jan-Oct | Oct | Oct | Jan-Oct | Jan-Oct | |
| 2016 | 2017 | 2016 | 2017 | 2016 | 2017 | 2016 | 2017 | |
| Austria | 36 | 34 | 308 | 314 | 25 | 21 | 221 | 234 |
| Belgium | 1,287 | 1,160 | 12,341 | 10,887 | 129 | 118 | 1,161 | 1,154 |
| Bulgaria | 6 | 8 | 68 | 73 | 7 | 2 | 38 | 21 |
| Croatia | 2 | 2 | 32 | 31 | 2 | 1 | 27 | 9 |
| Cyprus | 2 | 2 | 26 | 22 | 0 | 1 | 3 | 3 |
| Czech Republic | 34 | 38 | 311 | 324 | 23 | 39 | 339 | 324 |
| Denmark | 57 | 56 | 508 | 516 | 40 | 32 | 408 | 348 |
| Estonia | 2 | 1 | 38 | 18 | 1 | 1 | 13 | 10 |
| Finland | 22 | 27 | 205 | 273 | 11 | 17 | 132 | 138 |
| France | 406 | 607 | 4,189 | 4,454 | 683 | 727 | 7,853 | 7,785 |
| Germany | 636 | 592 | 6,623 | 8,421 | 460 | 511 | 5,586 | 5,768 |
| Great Britain | 1,010 | 1,144 | 10,704 | 12,009 | 1,374 | 1,485 | 12,844 | 13,961 |
| Greece | 28 | 45 | 233 | 278 | 3 | 5 | 39 | 54 |
| Hungary | 18 | 20 | 249 | 243 | 9 | 7 | 130 | 97 |
| Italy | 174 | 221 | 1,992 | 2,130 | 149 | 133 | 1,197 | 1,323 |
| Latvia | 4 | 6 | 50 | 52 | 3 | 4 | 29 | 42 |
| Lithuania | 2 | 1 | 30 | 19 | 7 | 7 | 56 | 65 |
| Luxembourg | 5 | 11 | 56 | 96 | 3 | 3 | 25 | 25 |
| Malta | 2 | 3 | 37 | 27 | 1 | 1 | 10 | 8 |
| Netherlands | 491 | 513 | 4,872 | 4,853 | 214 | 222 | 2,179 | 1,963 |
| Northern Ireland | 139 | 156 | 1,355 | 1,633 | 92 | 111 | 869 | 1,044 |
| Poland | 78 | 100 | 1,173 | 1,037 | 49 | 58 | 468 | 524 |
| Portugal | 24 | 35 | 350 | 393 | 22 | 17 | 211 | 211 |
| Romania | 23 | 24 | 240 | 270 | 16 | 8 | 99 | 82 |
| Slovakia | 6 | 7 | 68 | 47 | 8 | 10 | 55 | 42 |
| Slovenia | 3 | 4 | 63 | 63 | 2 | 3 | 32 | 25 |
| Spain | 160 | 189 | 2,527 | 2,169 | 84 | 115 | 899 | 1,085 |
| Sweden | 88 | 61 | 664 | 622 | 38 | 57 | 365 | 406 |
| EU country not specified2 | 7 | 15 | 272 | 702 | 55 | 25 | 275 | 239 |
| Total EU | 4,753 | 5,085 | 49,584 | 51,976 | 3,509 | 3,739 | 35,560 | 36,989 |
| of which United Kingdom | 1,149 | 1,301 | 12,059 | 13,642 | 1,466 | 1,596 | 13,713 | 15,005 |
| Euro-Zone3 | 3,287 | 3,459 | 33,978 | 34,517 | 1,798 | 1,914 | 19,644 | 19,935 |
| Australia | 117 | 53 | 1,327 | 722 | 13 | 14 | 93 | 75 |
| Brazil | 18 | 17 | 192 | 144 | 11 | 30 | 264 | 177 |
| Canada | 86 | 87 | 790 | 890 | 32 | 36 | 447 | 509 |
| China4 | 319 | 271 | 2,652 | 4,263 | 396 | 430 | 3,396 | 3,658 |
| India | 22 | 26 | 236 | 284 | 39 | 68 | 464 | 591 |
| Japan | 366 | 224 | 2,304 | 1,860 | 90 | 84 | 1,030 | 971 |
| Malaysia | 16 | 19 | 171 | 154 | 24 | 28 | 250 | 269 |
| Mexico | 144 | 117 | 1,164 | 1,212 | 30 | 21 | 292 | 231 |
| Norway | 19 | 19 | 200 | 311 | 95 | 96 | 871 | 961 |
| Russia | 32 | 43 | 299 | 407 | 20 | 20 | 142 | 274 |
| Saudi Arabia | 42 | 60 | 678 | 598 | 0 | 1 | 8 | 7 |
| Singapore | 46 | 45 | 518 | 574 | 14 | 8 | 359 | 148 |
| South Africa | 21 | 24 | 185 | 195 | 6 | 10 | 80 | 93 |
| South Korea | 48 | 45 | 819 | 545 | 44 | 46 | 665 | 756 |
| Switzerland | 875 | 558 | 5,357 | 5,051 | 58 | 40 | 1,240 | 468 |
| Taiwan | 15 | 24 | 179 | 211 | 22 | 21 | 303 | 242 |
| Thailand | 21 | 16 | 174 | 146 | 32 | 32 | 361 | 320 |
| Turkey | 33 | 49 | 425 | 422 | 34 | 42 | 402 | 454 |
| USA | 2,890 | 2,389 | 26,483 | 27,161 | 1,048 | 948 | 11,431 | 12,549 |
| Other countries | 314 | 287 | 4,536 | 3,337 | 142 | 186 | 1,776 | 1,943 |
| Country unknown5 | 1 | 1 | 407 | 405 | 41 | 40 | 891 | 753 |
| Total Non-EU | 5,445 | 4,376 | 49,095 | 48,892 | 2,191 | 2,200 | 24,765 | 25,450 |
| Total | 10,199 | 9,461 | 98,679 | 100,868 | 5,700 | 5,939 | 60,325 | 62,439 |
| 1 Trade statistics revised since 2000. October 2017 is based on current Intrastat response levels. See background notes. | ||||||||
| 2 Includes estimates for traders below the Intrastat threshold and transactions where the EU country was not specified. | ||||||||
| 3 Euro-zone members from January 2015: Austria, Belgium, Germany, Spain, Finland, France, Luxembourg, Greece, Ireland, Italy, the Netherlands, Portugal, Slovenia, Malta, Cyprus, Slovakia, Estonia, Latvia and Lithuania. | ||||||||
| 4China includes Hong Kong and Macao. | ||||||||
| 5 Trade for which the country of origin or country of final destination is unknown. | ||||||||
| Table 5 Goods Exports and Imports classified by commodity and principal countries1 | |||||||||
| €million | |||||||||
| Exports | Imports | ||||||||
| Country by Section level of SITC | Oct | Oct | Jan-Oct | Jan-Oct | Oct | Oct | Jan-Oct | Jan-Oct | |
| 2016 | 2017 | 2016 | 2017 | 2016 | 2017 | 2016 | 2017 | ||
| Great Britain | 1,010 | 1,144 | 10,704 | 12,009 | 1,374 | 1,485 | 12,844 | 13,961 | |
| 0 | Food and live animals | 323 | 341 | 2,981 | 3,220 | 246 | 286 | 2,225 | 2,378 |
| 1 | Beverages and tobacco | 21 | 19 | 180 | 176 | 27 | 22 | 270 | 227 |
| 2 | Crude materials, inedible, except fuels | 32 | 28 | 311 | 321 | 13 | 16 | 129 | 156 |
| 3 | Mineral fuels, lubricants and related materials | 37 | 26 | 378 | 299 | 189 | 260 | 1,681 | 2,120 |
| 4 | Animal and vegetable oils, fats and waxes | 1 | 1 | 10 | 10 | 4 | 5 | 37 | 41 |
| 5 | Chemicals and related products | 245 | 367 | 3,003 | 4,122 | 198 | 217 | 1,965 | 2,524 |
| 6 | Manufactured goods classified chiefly by material | 79 | 83 | 790 | 795 | 154 | 165 | 1,449 | 1,507 |
| 7 | Machinery and transport equipment | 152 | 142 | 1,831 | 1,812 | 256 | 237 | 2,452 | 2,442 |
| 8 | Miscellaneous manufactured articles | 93 | 101 | 940 | 967 | 198 | 194 | 1,773 | 1,743 |
| 9 | Commodities and transactions not classified elsewhere | 28 | 35 | 281 | 288 | 89 | 83 | 862 | 823 |
| Other EU2 | 3,743 | 3,941 | 38,879 | 39,967 | 2,135 | 2,254 | 22,716 | 23,028 | |
| 0 | Food and live animals | 302 | 347 | 2,978 | 3,535 | 239 | 259 | 2,293 | 2,509 |
| 1 | Beverages and tobacco | 39 | 38 | 354 | 315 | 35 | 46 | 340 | 373 |
| 2 | Crude materials, inedible, except fuels | 59 | 85 | 646 | 793 | 21 | 26 | 230 | 259 |
| 3 | Mineral fuels, lubricants and related materials | 8 | 27 | 101 | 258 | 43 | 49 | 263 | 263 |
| 4 | Animal and vegetable oils, fats and waxes | 5 | 7 | 50 | 68 | 12 | 12 | 127 | 140 |
| 5 | Chemicals and related products | 2,370 | 2,438 | 23,391 | 23,473 | 404 | 458 | 4,194 | 4,801 |
| 6 | Manufactured goods classified chiefly by material | 66 | 76 | 690 | 730 | 146 | 191 | 1,471 | 1,538 |
| 7 | Machinery and transport equipment | 342 | 362 | 5,385 | 5,939 | 1,004 | 956 | 11,603 | 10,903 |
| 8 | Miscellaneous manufactured articles | 514 | 473 | 4,949 | 4,419 | 153 | 158 | 1,480 | 1,473 |
| 9 | Commodities and transactions not classified elsewhere | 37 | 87 | 335 | 436 | 76 | 99 | 715 | 770 |
| USA | 2,890 | 2,389 | 26,483 | 27,161 | 1,048 | 948 | 11,431 | 12,549 | |
| 0 | Food and live animals | 50 | 32 | 330 | 412 | 25 | 24 | 201 | 179 |
| 1 | Beverages and tobacco | 52 | 59 | 420 | 465 | 1 | 2 | 15 | 15 |
| 2 | Crude materials, inedible, except fuels | 2 | 3 | 31 | 36 | 3 | 7 | 39 | 44 |
| 3 | Mineral fuels, lubricants and related materials | 0 | 16 | 84 | 169 | 2 | 0 | 172 | 155 |
| 4 | Animal and vegetable oils, fats and waxes | - | 0 | 0 | 0 | 0 | 0 | 1 | 1 |
| 5 | Chemicals and related products | 1,724 | 1,596 | 15,874 | 17,219 | 275 | 416 | 2,776 | 5,049 |
| 6 | Manufactured goods classified chiefly by material | 20 | 14 | 179 | 193 | 27 | 34 | 316 | 330 |
| 7 | Machinery and transport equipment | 643 | 267 | 5,477 | 4,002 | 610 | 322 | 6,816 | 5,654 |
| 8 | Miscellaneous manufactured articles | 395 | 392 | 4,059 | 4,610 | 96 | 135 | 1,023 | 1,036 |
| 9 | Commodities and transactions not classified elsewhere | 3 | 11 | 31 | 53 | 8 | 9 | 72 | 86 |
| China3 | 319 | 271 | 2,652 | 4,263 | 396 | 430 | 3,396 | 3,658 | |
| 0 | Food and live animals | 63 | 86 | 690 | 753 | 3 | 3 | 26 | 30 |
| 1 | Beverages and tobacco | 0 | 0 | 5 | 4 | 0 | 0 | 0 | 0 |
| 2 | Crude materials, inedible, except fuels | 7 | 5 | 76 | 61 | 5 | 4 | 34 | 35 |
| 3 | Mineral fuels, lubricants and related materials | 0 | 0 | 0 | 1 | 0 | 0 | 0 | 0 |
| 4 | Animal and vegetable oils, fats and waxes | 0 | 0 | 2 | 1 | 0 | 0 | 0 | 0 |
| 5 | Chemicals and related products | 57 | 43 | 681 | 712 | 13 | 21 | 266 | 245 |
| 6 | Manufactured goods classified chiefly by material | 1 | 3 | 20 | 25 | 34 | 42 | 346 | 396 |
| 7 | Machinery and transport equipment | 162 | 93 | 832 | 2,244 | 193 | 195 | 1,598 | 1,774 |
| 8 | Miscellaneous manufactured articles | 29 | 41 | 346 | 462 | 143 | 160 | 1,074 | 1,123 |
| 9 | Commodities and transactions not classified elsewhere | 0 | 0 | 0 | 0 | 5 | 5 | 53 | 52 |
| Rest of World | 2,236 | 1,715 | 19,960 | 17,468 | 747 | 822 | 9,937 | 9,243 | |
| 0 | Food and live animals | 111 | 126 | 1,195 | 1,444 | 44 | 70 | 660 | 746 |
| 1 | Beverages and tobacco | 22 | 18 | 144 | 151 | 14 | 17 | 135 | 130 |
| 2 | Crude materials, inedible, except fuels | 18 | 20 | 180 | 257 | 20 | 26 | 250 | 254 |
| 3 | Mineral fuels, lubricants and related materials | 0 | 1 | 4 | 133 | 71 | 105 | 906 | 1,258 |
| 4 | Animal and vegetable oils, fats and waxes | 0 | 0 | 2 | 3 | 3 | 3 | 36 | 42 |
| 5 | Chemicals and related products | 1,670 | 1,167 | 12,435 | 10,739 | 182 | 184 | 2,963 | 1,906 |
| 6 | Manufactured goods classified chiefly by material | 12 | 13 | 129 | 133 | 38 | 47 | 386 | 442 |
| 7 | Machinery and transport equipment | 228 | 173 | 4,001 | 2,505 | 218 | 214 | 3,159 | 3,011 |
| 8 | Miscellaneous manufactured articles | 172 | 178 | 1,807 | 1,937 | 149 | 146 | 1,376 | 1,384 |
| 9 | Commodities and transactions not classified elsewhere | 2 | 19 | 63 | 167 | 8 | 10 | 67 | 70 |
| Total | 10,199 | 9,461 | 98,679 | 100,868 | 5,700 | 5,939 | 60,325 | 62,439 | |
| 1 Trade statistics revised since 2000. October 2017 is based on current Intrastat response levels. See background notes. | |||||||||
| 2 Includes estimates for traders below the Intrastat threshold and transactions where the EU country was not specified. | |||||||||
| 3 China includes Hong Kong and Macao. | |||||||||
Introduction
Goods Exports and Imports statistics provide data on the movement of goods between countries. The statistics are a combination of Customs-based non-EU trade statistics and data from the Intrastat Survey of Irish traders involved in trade with other EU member states. The collection of trade data is the responsibility of VIMA (a branch of Revenue). The CSO is responsible for processing and disseminating the data.
Revisions to the Trade in Goods statistics
Since May 2015, significant revisions were incorporated into International Trade in Goods statistics. While the most significant revision is due to recording trade in aircraft on a "transfer of economic ownership" basis, other revisions were incorporated into the Trade data back to 2000.
Along with the aircraft revisions Goods Exports revisions also include upward revisions due to revaluing some products that had previously been recorded on a “transfer of economic ownership” basis, which was not in line with goods statistics methodology. Also Goods Imports revisions include downward revisions due to a change in the estimation methodology for non-response.
The technical note gives more detail on the revised trade in aircraft methodology and explains the impact the revisions will have on Trade in Goods, National Accounts and Balance of Payments.
Standard Revisions
Trade figures are subject to revision on the incorporation of late Intrastat and VAT returns and corrections made by traders. When the preliminary results for a month are published, the results for months -1 (September 2017 in this publication), -4 (June 2017) and -8 (February 2017) are revised. Following the move to a "transfer of economic ownership" basis for recording exports and imports of aircraft, SITC 79 figures are subject to revision on the incorporation of transactions from quarterly Balance of Payments (BoP) surveys. Such revisions will generally be incorporated into Goods Exports and Imports releases that coincide with quarterly BoP publications, i.e. when initial results are published for January, April, July and October.
Intrastat System
The Intrastat system has two components. Firstly, the Intrastat survey (conducted by the Revenue Commissioners), in which traders, above the Intrastat survey trade thresholds, make detailed monthly returns giving information on the quantity and value of all exports to or imports from EU countries.
The total number of traders required to make a detailed import return is around 5,200 while around 2,200 must make a detailed export return. The response rate in terms of number of traders in October 2017 was 72%, covering an estimated 94% of the total value of intra-EU trade (these response rates will have increased by the next time data for October is published).
The second component of the Intrastat system is the regular VAT return, on which all traders are required to record the total value of goods imported from and exported to other EU countries. This information provides the basis for determining total EU trade for those traders below the Intrastat survey thresholds. It is also used to maintain the register of EU traders.
Extrastat System
The statistics of trade with non-EU countries are compiled from the documents supplied by importers and exporters to the Customs authorities. The document is the Single Administrative Document (SAD) used for Customs clearance purposes.
Estimation
The figures in this release include estimates for traders above the Intrastat thresholds who did not make detailed returns for the period and for traders below the thresholds who did not provide aggregate intra-EU trade figures on their VAT returns.
Estimates for Intrastat non-respondents are apportioned to individual commodities and countries whenever previous Intrastat returns are available. Estimates for traders below the Intrastat thresholds are assigned to partner country where possible, but not to commodity.
More information is now being processed on lower value transactions. Prior to January 2012, transactions below €254 were grouped together, this value has now decreased to €127. Therefore, this has resulted in more detail being available at commodity level in Table 3 and at country level in Tables 4 and 5.
Unit Value Indices
The monthly unit value index measures monthly unit value trends relative to the annual levels in the preceding year using value weights relating to that year’s trade (Laspeyres index).
The annual index is compiled using value weights for both the current and previous year (Fisher index) to allow for change in the structure of trade in goods.
The monthly index series should be regarded as interim measures suitable for month-to-month comparisons within a given year. Previous monthly indices are revised when late returns are received.
When the annual unit value index is compiled, the monthly unit value indices are rescaled to make their average equal to the annual index.
The unit value index series has been rebased to 2010 from 1990. In the course of this rebasing, a detailed examination of the series was undertaken. This exercise has produced a number of modifications enabling production of a more robust series.
Seasonally Adjusted Series
Monthly exports, imports, trade surplus and the volume series for exports and imports have been seasonally adjusted using the US Bureau of the Census X-11 Variant of the Census Method 11 Seasonal Adjustment Program. In the main, monthly projections are based on series recalculated at the end of the previous year.
Methodology
There are methodological differences between the measurement of exports and imports in this release compared with Industrial Production, National Accounts and Balance of Payments statistics. This release records the movement of all goods over the frontier at the valuation placed on the goods at the time of crossing the frontier. Industrial Production, National Accounts and Balance of Payments statistics take account of additional aspects of cross-frontier activities such as goods sent abroad for processing where goods cross the frontier without change of ownership. The CSO releases for those statistics provide more information on their methodology.
Services Exports and Imports
The quarterly Balance of Payments (BoP) statistics provide detail on Services exports and imports.
 Hide Background Notes
Scan the QR code below to view this release online or go to
http://www.cso.ie/en/releasesandpublications/er/gei/goodsexportsandimportsoctober2017/
 Show Table 1 Goods Exports and Imports summary analysis
 Hide Table 1 Goods Exports and Imports summary analysis