
| Tonnes (Live weight equivalent) | |||
| Year | Irish Vessels in Ireland | Irish Vessels in Foreign Ports | Foreign Vessels in Ireland |
| 2007 | 155,252 | 59,827 | 32,054 |
| 2008 | 149,209 | 52,723 | 73,464 |
| 2009 | 166,361 | 115,870 | 64,411 |
| 2010 | 164,615 | 153,440 | 81,340 |
| 2011 | 162,303 | 45,635 | 35,153 |
| 2012 | 249,205 | 57,339 | 80,349 |
| 2013 | 202,926 | 39,709 | 76,943 |
| 2014 | 220,344 | 55,352 | 74,039 |
| 2015 | 204,194 | 29,834 | 93,938 |
| 2016 | 207,620 | 33,933 | 68,012 |
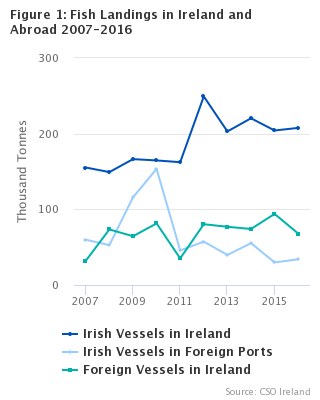
Landings by Irish trawlers increased by 3.2% from 234,028 tonnes in 2015 to 241,553 tonnes in 2016. Landings by Irish vessels in Ireland were higher by 1.7% or 3,426 tonnes. Landings by Irish vessels in foreign ports increased by 13.8% or 4,099 tonnes (see Table 1A). Landings by foreign vessels in Ireland decreased by 27.6% or 25,926 tonnes (see Table 2).
The highest level of landings by Irish vessels in Ireland during 2007-2016 was in 2012 when 249,205 tonnes were landed (see Figure 1). The highest level of landings by Irish vessels in foreign ports during the same period was in 2010 when 153,440 tonnes were landed. Almost half of this (73,535 tonnes) was boarfish (see Table 3B).
In 2016 similar amounts were landed by Irish vessels in the Faroe Islands (8,304 tonnes), Norway (8,312 tonnes) and the United Kingdom (7,494 tonnes).
In 2016 the species for which the largest quantities landed by Irish vessels in Ireland were Atlantic Mackerel (64,838 tonnes), Horse Mackerel (26,068 tonnes) and Blue Whiting (21,882 tonnes). In value terms, Table 3D shows that Lobster Norway (€62 million) and Atlantic Mackerel (€41 million) were the most important species.
The median prices per tonne for landings by Irish vessels in Ireland is given in Table 3G. Lobster, Sole and Turbot obtained the highest prices. The median price per tonne of Lobster Norway in 2016 was €6,761. In contrast species with much higher tonnages, like Atlantic Mackerel, obtained lower prices.
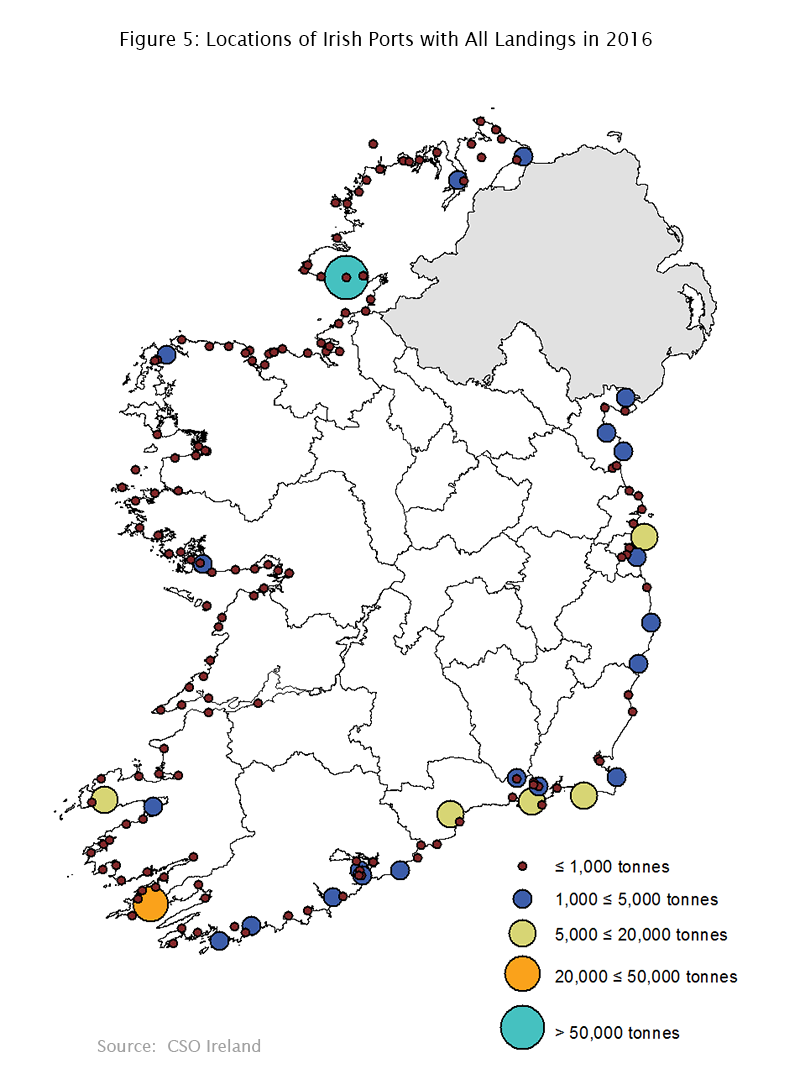
Killybegs was the most important port for Irish landings in 2016 accounting for just over half (50.8%) of all landings by Irish vessels (see Table 4A). Killybegs (48.4%) and Castletownbere (37.6%) were the ports with the highest tonnages landed by foreign vessels in Ireland (see Table 4B).
The West of Scotland and Rockall accounted for 31.9% of catch tonnages by Irish vessels that were landed in Ireland. The Celtic Sea was next with 17.5% (see Table 6A).
In terms of tonnes landed the busiest months are January to March and October to November. In 2016 almost one-quarter (23%) of the catch landed by Irish vessels was in February (see Table 9A). There was greater variability at species level e.g. 57% of landings by Irish vessels of Horse Mackerel in 2016 took place in January (see Table 9B).
| Atlantic Herring | Atlantic Mackerel | Blue Whiting | Boarfish | Horse Mackerel | |
| 2007 | 24.124 | 25.151 | 16.618 | 8.046 | 27.938 |
| 2008 | 19.983 | 25.331 | 22.042 | 4.015 | 33.61 |
| 2009 | 15.552 | 40.149 | 7.64 | 10.477 | 37.092 |
| 2010 | 17.47 | 38.334 | 5.816 | 14.921 | 37.268 |
| 2011 | 18.552 | 42.61 | 1.193 | 8.181 | 34.574 |
| 2012 | 21.934 | 48.054 | 10.824 | 26.83 | 45.312 |
| 2013 | 18.592 | 49.187 | 10.89 | 31.155 | 34.692 |
| 2014 | 21.033 | 79.018 | 16.914 | 14.277 | 32.385 |
| 2015 | 16.316 | 72.208 | 23.607 | 10.793 | 20.773 |
| 2016 | 16.738 | 64.838 | 21.882 | 9.189 | 26.068 |
| Castletownbere | Dunmore East | Killybegs | |
| 2007 | 14.734 | 8.392 | 86.711 |
| 2008 | 9.116 | 6.361 | 92.331 |
| 2009 | 12.815 | 5.556 | 96.878 |
| 2010 | 11.29 | 8.224 | 97.97 |
| 2011 | 14.182 | 8.409 | 84.561 |
| 2012 | 28.43 | 13.047 | 123.172 |
| 2013 | 17.687 | 11.707 | 117.39 |
| 2014 | 14.597 | 11.319 | 139.616 |
| 2015 | 15.436 | 10.839 | 123.337 |
| 2016 | 14.008 | 10.189 | 122.594 |
| Catch Zone | |
| Celtic Sea | 36.313 |
| Irish Sea | 11.253 |
| North Sea | 19.546 |
| Porcupine Bank | 17.702 |
| South-West of Ireland | 18.051 |
| West of Ireland | 23.151 |
| West of Scotland and Rockall | 66.242 |
| Atlantic Herring | Atlantic Mackerel | Blue Whiting | Horse Mackerel | Lobster Norway | |
| 2007 | 0.22 | 0.95 | 0.15 | 0.27 | 5 |
| 2008 | 0.22 | 0.95 | 0.141 | 0.256 | 4.972 |
| 2009 | 0.269 | 0.73 | 0.12 | 0.282 | 3.518 |
| 2010 | 0.22 | 0.95 | 0.34 | 0.28 | 4.098 |
| 2011 | 0.395 | 1.02 | 0.167 | 0.5 | 5.26 |
| 2012 | 0.442 | 1 | 0.167 | 0.509 | 5.27 |
| 2013 | 0.4 | 0.88 | 0.221 | 0.612 | 5.005 |
| 2014 | 0.234 | 0.85 | 0.58 | 0.635 | 5.711 |
| 2015 | 0.36 | 0.61 | 0.46 | 0.57 | 6.43 |
| 2016 | 0.534 | 0.75 | 0.25 | 0.54 | 6.761 |
| Atlantic Herring | Atlantic Mackerel | Blue Whiting | Horse Mackerel | Total | |
| January | 3 | 17 | 0 | 57 | 14 |
| February | 1 | 49 | 4 | 13 | 23 |
| March | 0 | 1 | 82 | 1 | 13 |
| April | 0 | 0 | 15 | 0 | 4 |
| May | 0 | 0 | 0 | 0 | 2 |
| June | 0 | 0 | 0 | 0 | 2 |
| July | 0 | 0 | 0 | 0 | 2 |
| August | 0 | 0 | 0 | 0 | 2 |
| September | 9 | 0 | 0 | 0 | 4 |
| October | 43 | 24 | 0 | 1 | 15 |
| November | 30 | 9 | 0 | 13 | 11 |
| December | 14 | 0 | 0 | 15 | 7 |
| Table 1A Landings by Irish Vessels in Ireland and in Foreign Ports 2007-2016 (Tonnage and Value) | |||||||
| Tonnes (Live weight equivalent) | €000 | ||||||
| Year | Ireland | Foreign | Total | Ireland | Foreign | Total | |
| 2007 | 155,252 | 59,827 | 215,079 | 166,350 | 33,412 | 199,762 | |
| 2008 | 149,209 | 52,723 | 201,932 | 163,726 | 27,090 | 190,816 | |
| 2009 | 166,361 | 115,870 | 282,231 | 153,605 | 32,494 | 186,099 | |
| 2010 | 164,615 | 153,440 | 318,055 | 159,390 | 49,510 | 208,900 | |
| 2011 | 162,303 | 45,635 | 207,939 | 216,908 | 33,774 | 250,682 | |
| 2012 | 249,205 | 57,339 | 306,544 | 295,575 | 31,370 | 326,945 | |
| 2013 | 202,926 | 39,709 | 242,635 | 212,306 | 20,482 | 232,788 | |
| 2014 | 220,344 | 55,352 | 275,696 | 241,202 | 31,401 | 272,603 | |
| 2015 | 204,194 | 29,834 | 234,028 | 220,404 | 22,204 | 242,608 | |
| 2016 | 207,620 | 33,933 | 241,553 | 255,783 | 24,788 | 280,570 | |
| Table 1B Landings by Irish Vessels by Landing Country 2007-2016 (Tonnage) | ||||||||||
| Tonnes (Live weight equivalent) | ||||||||||
| Year | Denmark | Faroe Islands | France | Ireland | Netherlands | Norway | Spain | United Kingdom | Other Foreign | Total |
| 2007 | 6,413 | 3,532 | 3,703 | 155,252 | 7,349 | 20,631 | 357 | 17,842 | 1 | 215,079 |
| 2008 | 2,530 | 10,169 | 3,616 | 149,209 | 3,877 | 19,121 | 2,173 | 11,226 | 12 | 201,932 |
| 2009 | 30,290 | 31,107 | 4,314 | 166,361 | 9,870 | 20,294 | 51 | 11,585 | 8,359 | 282,231 |
| 2010 | 34,411 | 40,501 | 5,577 | 164,615 | 7,336 | 17,155 | 30,707 | 11,077 | 6,677 | 318,055 |
| 2011 | 7,350 | 4,636 | 4,010 | 162,303 | 910 | 19,695 | 1,036 | 7,998 | – | 207,939 |
| 2012 | 19,553 | 9,671 | 3,782 | 249,205 | 1,232 | 12,830 | 989 | 9,279 | 2 | 306,544 |
| 2013 | 10,112 | 13,501 | 1,276 | 202,926 | 1,010 | 6,620 | 1,006 | 6,183 | – | 242,635 |
| 2014 | 9,492 | 15,717 | 4,010 | 220,344 | 1,312 | 10,775 | 913 | 13,133 | – | 275,696 |
| 2015 | 1,339 | 5,519 | 4,391 | 204,194 | 940 | 9,440 | 820 | 7,385 | – | 234,028 |
| 2016 | 5,823 | 8,304 | 1,903 | 207,620 | 1,269 | 8,312 | 827 | 7,494 | – | 241,553 |
| – No landings reported | ||||||||||
| Table 1C Landings by Irish Vessels by Landing Country 2007-2016 (Value) | ||||||||||
| €000 | ||||||||||
| Year | Denmark | Faroe Islands | France | Ireland | Netherlands | Norway | Spain | United Kingdom | Other Foreign | Total |
| 2007 | 1,396 | 419 | 2,978 | 166,350 | 3,526 | 9,579 | 964 | 14,548 | 2 | 199,762 |
| 2008 | 336 | 931 | 2,333 | 163,726 | 3,077 | 9,327 | 1,052 | 10,018 | 17 | 190,816 |
| 2009 | 2,032 | 4,002 | 2,692 | 153,605 | 4,960 | 10,035 | 124 | 6,856 | 1,793 | 186,099 |
| 2010 | 3,804 | 10,743 | 3,731 | 159,390 | 5,914 | 8,820 | 6,657 | 8,697 | 1,144 | 208,900 |
| 2011 | 1,058 | 632 | 4,239 | 216,908 | 1,489 | 16,183 | 2,057 | 8,116 | – | 250,682 |
| 2012 | 2,820 | 1,364 | 3,431 | 295,575 | 1,522 | 9,504 | 2,625 | 10,103 | 2 | 326,945 |
| 2013 | 1,537 | 2,170 | 1,379 | 212,306 | 1,748 | 4,283 | 3,031 | 6,333 | – | 232,788 |
| 2014 | 2,124 | 2,858 | 3,210 | 241,202 | 2,394 | 7,954 | 3,149 | 9,712 | – | 272,603 |
| 2015 | 704 | 640 | 3,939 | 220,404 | 1,901 | 5,447 | 2,913 | 6,659 | – | 242,608 |
| 2016 | 1,411 | 1,073 | 3,344 | 255,783 | 2,605 | 5,141 | 2,633 | 8,580 | – | 280,570 |
| – No landings reported | ||||||||||
| Table 2 Landings by Foreign Vessels in Ireland 2007-2016 (Tonnage and Value) | ||
| Tonnes (Live weight equivalent) | €000 | |
| Year | Ireland | Ireland |
| 2007 | 32,054 | 47,322 |
| 2008 | 73,464 | 50,017 |
| 2009 | 64,411 | 50,779 |
| 2010 | 81,340 | 49,006 |
| 2011 | 35,153 | 50,953 |
| 2012 | 80,349 | 29,022 |
| 2013 | 76,943 | 70,508 |
| 2014 | 74,039 | 104,638 |
| 2015 | 93,938 | 136,236 |
| 2016 | 68,012 | 116,229 |
| Table 3A Landings by Irish Vessels in Ireland by Species 2007-2016 (Tonnage) | ||||||||||
| Tonnes (Live weight equivalent) | ||||||||||
| Species | 2007 | 2008 | 2009 | 2010 | 2011 | 2012 | 2013 | 2014 | 2015 | 2016 |
| Atlantic Herring | 24,124 | 19,983 | 15,552 | 17,470 | 18,552 | 21,934 | 18,592 | 21,033 | 16,316 | 16,738 |
| Atlantic Mackerel | 25,151 | 25,331 | 40,149 | 38,334 | 42,610 | 48,054 | 49,187 | 79,018 | 72,208 | 64,838 |
| Blue Whiting | 16,618 | 22,042 | 7,640 | 5,816 | 1,193 | 10,824 | 10,890 | 16,914 | 23,607 | 21,882 |
| Boarfish | 8,046 | 4,015 | 10,477 | 14,921 | 8,181 | 26,830 | 31,155 | 14,277 | 10,793 | 9,189 |
| Cod Atlantic | 1,585 | 1,405 | 1,064 | 1,252 | 1,239 | 1,850 | 1,604 | 1,363 | 1,274 | 1,012 |
| Crab Edible | 6,786 | 5,662 | 3,613 | 6,354 | 4,966 | 6,076 | 5,235 | 5,717 | 5,826 | 9,323 |
| Haddock | 3,496 | 3,710 | 3,977 | 3,469 | 4,140 | 6,077 | 3,983 | 3,336 | 3,090 | 3,793 |
| Hake European | 1,300 | 1,321 | 1,605 | 2,003 | 1,860 | 8,828 | 1,741 | 2,538 | 2,703 | 3,525 |
| Horse Mackerel | 27,938 | 33,610 | 37,092 | 37,268 | 34,574 | 45,312 | 34,692 | 32,385 | 20,773 | 26,068 |
| John Dory | 249 | 191 | 179 | 175 | 216 | 422 | 273 | 220 | 195 | 247 |
| Lemon Sole | 337 | 249 | 279 | 259 | 338 | 464 | 409 | 448 | 467 | 462 |
| Ling | 694 | 517 | 473 | 602 | 656 | 1,156 | 614 | 582 | 499 | 736 |
| Lobster European | 305 | 496 | 393 | 475 | 734 | 251 | 373 | 451 | 237 | 434 |
| Lobster Norway | 9,137 | 9,070 | 7,015 | 7,631 | 7,725 | 10,277 | 8,366 | 8,987 | 8,249 | 9,441 |
| Megrim nei | 2,004 | 1,731 | 2,218 | 2,611 | 2,307 | 4,653 | 3,067 | 2,603 | 2,732 | 3,005 |
| Monkfish Angler nei | 3,429 | 2,794 | 3,286 | 4,083 | 3,684 | 7,011 | 3,481 | 3,706 | 3,635 | 4,288 |
| Plaice | 367 | 265 | 265 | 272 | 288 | 324 | 275 | 297 | 371 | 759 |
| Pollack | 825 | 758 | 819 | 955 | 979 | 1,190 | 1,283 | 1,119 | 1,083 | 1,235 |
| Razor Shells | 415 | 454 | 290 | 495 | 462 | 497 | 867 | 983 | 816 | 1,190 |
| Saithe | 632 | 451 | 643 | 808 | 995 | 1,467 | 1,659 | 1,152 | 751 | 922 |
| Scallop Great Atlantic | 913 | 1,072 | 2,635 | 1,966 | 2,259 | 2,518 | 2,415 | 2,517 | 1,734 | 1,637 |
| Sole Black | 242 | 195 | 181 | 202 | 174 | 224 | 216 | 199 | 187 | 219 |
| Sprat European | 3,920 | 2,353 | 3,772 | 3,201 | 3,931 | 9,667 | 5,454 | 2,991 | 10,366 | 5,405 |
| Thornback Ray | 0 | – | 29 | 194 | 268 | 389 | 333 | 389 | 390 | 498 |
| Tuna Albacore | 568 | 1,515 | 1,990 | 755 | 3,507 | 3,665 | 2,231 | 2,485 | 2,362 | 1,779 |
| Turbot | 201 | 169 | 131 | 160 | 160 | 215 | 171 | 164 | 160 | 230 |
| Whelk | 3,503 | 1,871 | 2,198 | 2,845 | 2,828 | 3,442 | 2,647 | 2,130 | 3,098 | 6,272 |
| Whiting | 5,126 | 2,567 | 2,991 | 4,522 | 4,984 | 6,070 | 7,016 | 7,030 | 6,579 | 7,793 |
| Witch | 529 | 403 | 387 | 394 | 446 | 560 | 658 | 538 | 490 | 553 |
| Other Species | 6,813 | 5,009 | 15,017 | 5,124 | 8,047 | 18,959 | 4,042 | 4,772 | 3,204 | 4,149 |
| Total | 155,252 | 149,209 | 166,361 | 164,615 | 162,303 | 249,205 | 202,926 | 220,344 | 204,194 | 207,620 |
| – No landings reported | ||||||||||
| Table 3B Landings by Irish Vessels in Foreign Ports by Species 2007-2016 (Tonnage) | ||||||||||
| Tonnes (Live weight equivalent) | ||||||||||
| Species | 2007 | 2008 | 2009 | 2010 | 2011 | 2012 | 2013 | 2014 | 2015 | 2016 |
| Atlantic Herring | 6,800 | 8,080 | 10,702 | 9,191 | 7,345 | 6,356 | 4,600 | 3,022 | 2,935 | 2,920 |
| Atlantic Mackerel | 24,119 | 19,564 | 21,271 | 19,909 | 20,110 | 16,693 | 7,417 | 24,339 | 16,632 | 11,939 |
| Blue Whiting | 14,514 | 809 | 1,134 | 2,508 | 2 | – | 2,315 | 4,554 | 1,178 | 5,776 |
| Boarfish | 9,569 | 17,569 | 58,151 | 73,535 | 11,947 | 29,119 | 21,095 | 20,348 | 5,531 | 8,306 |
| Cod Atlantic | 209 | 120 | 142 | 20 | 17 | 361 | 355 | 10 | 260 | 8 |
| Crab Edible | 1,330 | 1,317 | 1,917 | 1,823 | 973 | 1,324 | 1,135 | 1,405 | 1,127 | 1,323 |
| Haddock | 106 | 12 | 7 | 39 | 25 | 49 | 86 | 58 | 35 | 42 |
| Hake European | 131 | 71 | 20 | 44 | 48 | 56 | 32 | 63 | 31 | 39 |
| Horse Mackerel | 2,153 | 2,910 | 3,950 | 7,849 | 3,891 | 2,002 | 1,100 | 284 | 883 | 1,464 |
| John Dory | 2 | 1 | 0 | 3 | 11 | 9 | 9 | 8 | 5 | 6 |
| Lemon Sole | 2 | 1 | 0 | 2 | 5 | 17 | 18 | 17 | 12 | 11 |
| Ling | 13 | 6 | 1 | 11 | 9 | 13 | 7 | 8 | 11 | 16 |
| Lobster European | 0 | 1 | 4 | 0 | 0 | 1 | 0 | 0 | – | 1 |
| Lobster Norway | 195 | 153 | 104 | 127 | 151 | 239 | 75 | 95 | 129 | 130 |
| Megrim nei | 38 | 23 | 7 | 108 | 325 | 401 | 372 | 293 | 277 | 281 |
| Monkfish Angler nei | 83 | 41 | 14 | 61 | 207 | 295 | 264 | 229 | 183 | 174 |
| Plaice | 29 | 11 | 0 | 1 | 2 | 3 | 2 | 2 | 5 | 1 |
| Pollack | 1 | 0 | 0 | 27 | 1 | 0 | 1 | 1 | 0 | 0 |
| Razor Shells | 0 | – | – | – | – | – | – | 0 | – | – |
| Saithe | 11 | 2 | 25 | 15 | 49 | 9 | 14 | 12 | 13 | 13 |
| Scallop Great Atlantic | 5 | 0 | – | 9 | 10 | 216 | 479 | 359 | 308 | 597 |
| Sole Black | 37 | 19 | 0 | 1 | 1 | 1 | 1 | 0 | 0 | 1 |
| Thornback Ray | 0 | – | 0 | 1 | 2 | 3 | 8 | 6 | 4 | 3 |
| Tuna Albacore | 29 | 7 | 7 | – | 90 | – | – | – | 5 | 546 |
| Turbot | 4 | 2 | 0 | 0 | 1 | 1 | 1 | 0 | 0 | 1 |
| Whelk | 97 | – | – | – | – | – | – | 1 | – | – |
| Whiting | 23 | – | 4 | 9 | 9 | 4 | 14 | 7 | 1 | 75 |
| Witch | 7 | 4 | 1 | 2 | 15 | 40 | 38 | 47 | 53 | 41 |
| Other Species | 320 | 1,999 | 18,409 | 38,145 | 388 | 126 | 272 | 184 | 212 | 220 |
| Total | 59,827 | 52,723 | 115,870 | 153,440 | 45,635 | 57,339 | 39,709 | 55,352 | 29,834 | 33,933 |
| – No landings reported | ||||||||||
| Table 3C Landings by Foreign Vessels in Ireland by Species 2007-2016 (Tonnage) | ||||||||||
| Tonnes (Live weight equivalent) | ||||||||||
| Species | 2007 | 2008 | 2009 | 2010 | 2011 | 2012 | 2013 | 2014 | 2015 | 2016 |
| Atlantic Herring | 1,521 | – | – | – | – | 6,411 | 8,113 | 1,370 | 7,167 | 23 |
| Atlantic Mackerel | 1 | 407 | 1,850 | 520 | 2 | 1 | 3,921 | 4,054 | 4,631 | 6,659 |
| Blue Whiting | 13,527 | 54,426 | 40,174 | 59,118 | 10,638 | 66,535 | 36,002 | 33,269 | 37,884 | 15,646 |
| Boarfish | 0 | 0 | – | 426 | 1 | – | 932 | 12 | – | 66 |
| Cod Atlantic | 53 | 38 | 108 | 39 | 133 | 1 | 90 | 99 | 157 | 123 |
| Crab Edible | 1,055 | 667 | 531 | 403 | 441 | – | 1,275 | 1,387 | 1,402 | 1,858 |
| Haddock | 389 | 350 | 1,597 | 616 | 459 | 55 | 628 | 543 | 590 | 433 |
| Hake European | 7,499 | 6,263 | 9,656 | 8,234 | 11,457 | 4,100 | 11,869 | 16,612 | 24,088 | 21,632 |
| Horse Mackerel | 16 | 2,030 | 419 | 1,889 | 1,732 | – | 1,133 | 2,673 | 1,218 | 6,406 |
| John Dory | 114 | 103 | 81 | 108 | 95 | 24 | 149 | 140 | 271 | 177 |
| Lemon Sole | 37 | 37 | 54 | 103 | 57 | 9 | 39 | 49 | 76 | 116 |
| Ling | 499 | 410 | 638 | 676 | 804 | 420 | 1,070 | 809 | 620 | 825 |
| Lobster European | 1 | 1 | 2 | 1 | 1 | – | 1 | 1 | 2 | 6 |
| Lobster Norway | 270 | 321 | 423 | 250 | 207 | 50 | 195 | 146 | 142 | 504 |
| Megrim nei | 1,273 | 1,437 | 2,071 | 2,332 | 2,165 | 931 | 2,885 | 3,301 | 3,474 | 3,522 |
| Monkfish Angler nei | 3,492 | 4,507 | 4,294 | 4,061 | 4,470 | 1,122 | 5,349 | 6,451 | 5,738 | 7,301 |
| Plaice | 21 | 18 | 24 | 18 | 33 | 10 | 12 | 29 | 26 | 29 |
| Pollack | 23 | 15 | 27 | 12 | 24 | 3 | 38 | 44 | 552 | 31 |
| Razor Shells | 0 | 10 | – | 26 | 9 | – | 0 | 39 | 36 | – |
| Saithe | 94 | 75 | 129 | 103 | 307 | 7 | 87 | 38 | 109 | 41 |
| Scallop Great Atlantic | 0 | 44 | 2 | 7 | 8 | 2 | 169 | 487 | 134 | 249 |
| Sole Black | 15 | 12 | 21 | 19 | 23 | 12 | 7 | 19 | 16 | 24 |
| Sprat European | 0 | 5 | – | – | – | 19 | – | – | – | – |
| Thornback Ray | 0 | 6 | 66 | 83 | 51 | 4 | 58 | 64 | 59 | 96 |
| Tuna Albacore | 69 | 0 | 24 | 44 | 3 | 3 | – | – | – | 0 |
| Turbot | 11 | 11 | 18 | 25 | 21 | 3 | 11 | 13 | 13 | 18 |
| Whelk | 35 | 77 | 42 | 0 | 0 | – | – | 274 | 15 | 20 |
| Whiting | 125 | 83 | 72 | 99 | 104 | 53 | 181 | 342 | 239 | 119 |
| Witch | 136 | 106 | 140 | 223 | 173 | 220 | 199 | 237 | 956 | 307 |
| Other Species | 1,777 | 2,005 | 1,949 | 1,907 | 1,736 | 352 | 2,531 | 1,537 | 4,322 | 1,781 |
| Total | 32,054 | 73,464 | 64,411 | 81,340 | 35,153 | 80,349 | 76,943 | 74,039 | 93,938 | 68,012 |
| – No landings reported | ||||||||||
| Table 3D Landings by Irish Vessels in Ireland by Species 2007-2016 (Value) | ||||||||||
| €000 | ||||||||||
| Species | 2007 | 2008 | 2009 | 2010 | 2011 | 2012 | 2013 | 2014 | 2015 | 2016 |
| Atlantic Herring | 5,254 | 4,266 | 4,023 | 3,293 | 7,867 | 9,601 | 7,423 | 6,302 | 5,657 | 8,890 |
| Atlantic Mackerel | 23,893 | 18,831 | 27,514 | 27,519 | 44,772 | 47,987 | 40,038 | 58,133 | 42,061 | 41,087 |
| Blue Whiting | 2,478 | 3,053 | 954 | 2,043 | 197 | 1,738 | 2,407 | 8,254 | 9,578 | 4,977 |
| Boarfish | 1,223 | 128 | 388 | 1,647 | 1,135 | 3,822 | 4,225 | 1,749 | 1,257 | 1,181 |
| Cod Atlantic | 5,154 | 3,583 | 2,387 | 2,854 | 2,700 | 3,700 | 3,585 | 3,300 | 3,180 | 2,331 |
| Crab Edible | 10,173 | 8,058 | 4,700 | 9,095 | 6,371 | 7,172 | 7,236 | 7,169 | 7,968 | 12,493 |
| Haddock | 5,904 | 6,246 | 5,129 | 4,715 | 5,512 | 8,016 | 5,732 | 5,548 | 5,389 | 6,357 |
| Hake European | 3,938 | 3,411 | 3,221 | 3,708 | 3,465 | 16,133 | 3,474 | 6,177 | 6,629 | 8,518 |
| Horse Mackerel | 7,697 | 10,852 | 11,177 | 10,419 | 17,575 | 23,063 | 21,418 | 20,408 | 11,954 | 13,799 |
| John Dory | 1,299 | 998 | 713 | 781 | 1,026 | 2,225 | 1,237 | 1,010 | 1,076 | 1,306 |
| Lemon Sole | 931 | 770 | 673 | 618 | 854 | 1,161 | 985 | 1,084 | 1,327 | 1,483 |
| Ling | 945 | 694 | 598 | 746 | 856 | 1,457 | 746 | 717 | 693 | 1,015 |
| Lobster European | 4,665 | 6,521 | 4,615 | 5,617 | 9,098 | 2,846 | 4,777 | 6,070 | 3,372 | 6,169 |
| Lobster Norway | 35,081 | 37,879 | 21,135 | 24,181 | 31,807 | 53,455 | 41,343 | 48,907 | 49,803 | 62,145 |
| Megrim nei | 7,010 | 5,990 | 5,771 | 6,212 | 6,947 | 12,781 | 8,187 | 7,560 | 8,727 | 9,646 |
| Monkfish Angler nei | 12,179 | 10,192 | 10,971 | 12,726 | 12,364 | 22,678 | 11,636 | 11,892 | 12,528 | 14,535 |
| Plaice | 719 | 508 | 480 | 427 | 549 | 580 | 518 | 545 | 735 | 1,407 |
| Pollack | 1,690 | 1,504 | 1,369 | 1,516 | 1,740 | 2,127 | 2,300 | 1,794 | 3,030 | 2,595 |
| Razor Shells | 999 | 1,134 | 951 | 1,471 | 1,261 | 1,349 | 2,861 | 4,871 | 3,223 | 7,326 |
| Saithe | 527 | 429 | 606 | 815 | 1,109 | 1,631 | 1,758 | 1,542 | 948 | 1,205 |
| Scallop Great Atlantic | 2,300 | 12,374 | 10,453 | 11,090 | 18,448 | 12,592 | 7,833 | 6,679 | 8,025 | 3,963 |
| Sole Black | 2,831 | 2,382 | 1,658 | 1,965 | 1,750 | 2,111 | 2,089 | 1,779 | 1,765 | 2,056 |
| Sprat European | 885 | 568 | 595 | 614 | 666 | 1,743 | 1,231 | 735 | 1,971 | 1,560 |
| Thornback Ray | 0 | – | 38 | 331 | 439 | 482 | 501 | 578 | 588 | 770 |
| Tuna Albacore | 1,362 | 4,195 | 9,179 | 3,455 | 8,146 | 8,582 | 4,774 | 4,605 | 5,047 | 7,551 |
| Turbot | 1,904 | 1,723 | 1,047 | 1,336 | 1,387 | 1,808 | 1,510 | 1,435 | 1,409 | 2,065 |
| Whelk | 2,409 | 2,012 | 1,443 | 1,825 | 2,286 | 2,760 | 3,159 | 2,904 | 3,915 | 8,745 |
| Whiting | 6,749 | 3,479 | 3,635 | 5,591 | 5,732 | 7,341 | 7,904 | 8,001 | 8,092 | 9,756 |
| Witch | 1,039 | 809 | 767 | 570 | 874 | 935 | 1,242 | 958 | 924 | 963 |
| Other Species | 15,113 | 11,136 | 17,416 | 12,210 | 19,973 | 33,697 | 10,178 | 10,498 | 9,534 | 9,887 |
| Total | 166,350 | 163,726 | 153,605 | 159,390 | 216,908 | 295,575 | 212,306 | 241,202 | 220,404 | 255,783 |
| – No landings reported | ||||||||||
| Table 3E Landings by Irish Vessels in Foreign Ports by Species 2007-2016 (Value) | ||||||||||
| €000 | ||||||||||
| Species | 2007 | 2008 | 2009 | 2010 | 2011 | 2012 | 2013 | 2014 | 2015 | 2016 |
| Atlantic Herring | 1,496 | 1,778 | 2,879 | 2,022 | 3,296 | 2,644 | 1,842 | 935 | 1,139 | 1,630 |
| Atlantic Mackerel | 22,913 | 18,586 | 15,549 | 18,914 | 22,143 | 16,272 | 6,667 | 18,348 | 11,405 | 10,099 |
| Blue Whiting | 1,597 | 89 | 136 | 853 | 0 | – | 512 | 2,222 | 478 | 1,311 |
| Boarfish | 1,074 | 1,448 | 4,472 | 13,684 | 1,661 | 4,106 | 2,861 | 2,492 | 642 | 1,072 |
| Cod Atlantic | 661 | 318 | 341 | 45 | 27 | 722 | 791 | 31 | 654 | 24 |
| Crab Edible | 2,020 | 1,948 | 2,538 | 2,734 | 1,574 | 1,601 | 1,931 | 2,505 | 2,137 | 2,709 |
| Haddock | 183 | 21 | 9 | 50 | 28 | 63 | 109 | 86 | 57 | 60 |
| Hake European | 372 | 190 | 41 | 78 | 52 | 103 | 72 | 148 | 79 | 96 |
| Horse Mackerel | 538 | 727 | 1,123 | 2,159 | 1,852 | 1,019 | 680 | 227 | 589 | 934 |
| John Dory | 8 | 5 | 0 | 13 | 50 | 45 | 39 | 24 | 26 | 33 |
| Lemon Sole | 5 | 3 | 0 | 5 | 8 | 42 | 50 | 53 | 37 | 34 |
| Ling | 17 | 7 | 2 | 12 | 11 | 16 | 8 | 10 | 16 | 23 |
| Lobster European | 44 | 13 | 43 | 4 | 3 | 1 | – | 0 | – | 4 |
| Lobster Norway | 975 | 806 | 367 | 552 | 796 | 1,259 | 368 | 517 | 781 | 833 |
| Megrim nei | 106 | 71 | 16 | 225 | 920 | 1,091 | 1,397 | 1,161 | 1,088 | 1,037 |
| Monkfish Angler nei | 280 | 147 | 45 | 196 | 664 | 957 | 840 | 917 | 771 | 735 |
| Plaice | 57 | 20 | 1 | 1 | 3 | 6 | 4 | 4 | 9 | 1 |
| Pollack | 2 | 1 | 0 | 43 | 2 | 1 | 2 | 2 | 0 | 0 |
| Razor Shells | 0 | – | – | – | – | – | – | 1 | – | – |
| Saithe | 9 | 2 | 22 | 15 | 55 | 10 | 16 | 14 | 15 | 16 |
| Scallop Great Atlantic | 12 | 0 | – | 45 | 73 | 1,080 | 1,554 | 953 | 1,427 | 1,245 |
| Sole Black | 439 | 241 | 2 | 6 | 12 | 13 | 11 | 2 | 5 | 6 |
| Thornback Ray | 0 | – | 0 | 1 | 3 | 5 | 12 | 9 | 6 | 4 |
| Tuna Albacore | 72 | 17 | 34 | – | 208 | – | – | – | 11 | 2,090 |
| Turbot | 32 | 15 | 0 | 3 | 4 | 9 | 15 | 1 | 2 | 7 |
| Whelk | 62 | – | – | – | – | – | – | 1 | – | – |
| Whiting | 30 | – | 5 | 11 | 9 | 4 | 16 | 8 | 1 | 95 |
| Witch | 15 | 8 | 1 | 3 | 37 | 73 | 98 | 140 | 170 | 130 |
| Other Species | 392 | 628 | 4,866 | 7,837 | 281 | 228 | 589 | 590 | 659 | 561 |
| Total | 33,412 | 27,090 | 32,494 | 49,510 | 33,774 | 31,370 | 20,482 | 31,401 | 22,204 | 24,788 |
| – No landings reported | ||||||||||
| Table 3F Landings by Foreign Vessels in Ireland by Species 2007-2016 (Value) | ||||||||||
| €000 | ||||||||||
| Species | 2007 | 2008 | 2009 | 2010 | 2011 | 2012 | 2013 | 2014 | 2015 | 2016 |
| Atlantic Herring | 335 | – | – | – | – | 2,831 | 3,241 | 412 | 2,695 | 12 |
| Atlantic Mackerel | 1 | 249 | 1,363 | 337 | 2 | 1 | 3,237 | 3,000 | 2,557 | 4,435 |
| Blue Whiting | 2,029 | 6,130 | 4,821 | 12,412 | 2,127 | 11,111 | 7,200 | 16,235 | 15,381 | 3,552 |
| Boarfish | 0 | 0 | – | 47 | 0 | – | 126 | 1 | – | 8 |
| Cod Atlantic | 139 | 95 | 249 | 89 | 239 | 2 | 201 | 240 | 393 | 285 |
| Crab Edible | 1,693 | 918 | 571 | 594 | 592 | – | 1,868 | 1,917 | 2,091 | 2,843 |
| Haddock | 653 | 566 | 2,081 | 827 | 634 | 82 | 902 | 900 | 1,028 | 723 |
| Hake European | 21,216 | 13,254 | 17,119 | 11,803 | 20,967 | 6,966 | 17,039 | 40,188 | 59,087 | 52,632 |
| Horse Mackerel | 4 | 587 | 146 | 550 | 990 | – | 699 | 1,648 | 705 | 3,427 |
| John Dory | 498 | 400 | 273 | 455 | 498 | 124 | 673 | 635 | 1,497 | 938 |
| Lemon Sole | 100 | 93 | 123 | 237 | 135 | 24 | 95 | 120 | 216 | 372 |
| Ling | 759 | 590 | 831 | 787 | 1,088 | 551 | 1,299 | 989 | 861 | 1,138 |
| Lobster European | 11 | 13 | 24 | 10 | 10 | – | 6 | 11 | 24 | 93 |
| Lobster Norway | 1,490 | 2,084 | 1,297 | 1,254 | 795 | 259 | 965 | 794 | 854 | 3,317 |
| Megrim nei | 3,553 | 3,667 | 4,822 | 5,026 | 6,049 | 2,417 | 8,040 | 9,938 | 11,331 | 11,456 |
| Monkfish Angler nei | 11,587 | 17,563 | 13,756 | 11,140 | 13,209 | 3,637 | 17,817 | 21,000 | 19,991 | 24,763 |
| Plaice | 44 | 32 | 54 | 28 | 70 | 18 | 22 | 54 | 51 | 53 |
| Pollack | 46 | 26 | 46 | 21 | 40 | 5 | 68 | 71 | 1,191 | 62 |
| Razor Shells | 0 | 34 | – | 86 | 21 | – | 1 | 194 | 142 | – |
| Saithe | 79 | 71 | 126 | 115 | 381 | 7 | 91 | 69 | 138 | 53 |
| Scallop Great Atlantic | 0 | 474 | 4 | 54 | 25 | 10 | 549 | 1,293 | 621 | 578 |
| Sole Black | 172 | 170 | 192 | 183 | 255 | 117 | 67 | 169 | 155 | 221 |
| Sprat European | 0 | 1 | – | – | – | 3 | – | – | – | – |
| Thornback Ray | 0 | 7 | 89 | 104 | 64 | 5 | 87 | 94 | 89 | 146 |
| Tuna Albacore | 160 | 0 | 98 | 180 | 7 | 7 | – | – | – | 0 |
| Turbot | 117 | 107 | 123 | 180 | 165 | 17 | 97 | 113 | 118 | 163 |
| Whelk | 14 | 80 | 48 | 0 | 0 | – | – | 373 | 19 | 31 |
| Whiting | 146 | 106 | 87 | 133 | 127 | 62 | 204 | 389 | 294 | 149 |
| Witch | 284 | 197 | 249 | 287 | 285 | 387 | 384 | 445 | 1,926 | 564 |
| Other Species | 2,191 | 2,506 | 2,185 | 2,068 | 2,178 | 377 | 5,531 | 3,344 | 12,779 | 4,213 |
| Total | 47,322 | 50,017 | 50,779 | 49,006 | 50,953 | 29,022 | 70,508 | 104,638 | 136,236 | 116,229 |
| – No landings reported | ||||||||||
| Table 3G Landings by Irish Vessels in Ireland by Species Medians 2007-2016 (€/Tonne) | ||||||||||
| €/Tonne | ||||||||||
| Species | 2007 | 2008 | 2009 | 2010 | 2011 | 2012 | 2013 | 2014 | 2015 | 2016 |
| Atlantic Herring | 220 | 220 | 269 | 220 | 395 | 442 | 400 | 234 | 360 | 534 |
| Atlantic Mackerel | 950 | 950 | 730 | 950 | 1,020 | 1,000 | 880 | 850 | 610 | 750 |
| Blue Whiting | 150 | 141 | 120 | 340 | 167 | 167 | 221 | 580 | 460 | 250 |
| Boarfish | 135 | 30 | 30 | 110 | 104 | 141 | 100 | 110 | 110 | 120 |
| Cod Atlantic | 3,169 | 2,659 | 2,402 | 2,282 | 2,127 | 2,000 | 2,205 | 2,419 | 2,530 | 2,325 |
| Crab Edible | 1,520 | 1,478 | 1,326 | 1,500 | 1,238 | 1,239 | 1,318 | 1,150 | 1,220 | 1,300 |
| Haddock | 1,733 | 1,663 | 1,340 | 1,299 | 1,408 | 1,402 | 1,410 | 1,573 | 1,744 | 1,624 |
| Hake European | 3,152 | 2,875 | 2,155 | 1,949 | 1,911 | 1,835 | 1,998 | 2,087 | 2,162 | 1,924 |
| Horse Mackerel | 270 | 256 | 282 | 280 | 500 | 509 | 612 | 635 | 570 | 540 |
| John Dory | 5,221 | 5,854 | 3,982 | 4,549 | 5,174 | 5,174 | 4,712 | 4,522 | 5,191 | 5,283 |
| Lemon Sole | 2,481 | 2,871 | 2,211 | 2,324 | 2,356 | 2,500 | 2,229 | 2,297 | 2,722 | 2,935 |
| Ling | 1,295 | 1,274 | 1,189 | 1,159 | 1,198 | 1,260 | 1,193 | 1,143 | 1,293 | 1,260 |
| Lobster European | 15,500 | 12,828 | 11,571 | 12,132 | 11,961 | 11,961 | 12,780 | 12,497 | 14,414 | 14,739 |
| Lobster Norway | 5,000 | 4,972 | 3,518 | 4,098 | 5,260 | 5,270 | 5,005 | 5,711 | 6,430 | 6,761 |
| Megrim nei | 2,962 | 3,245 | 2,365 | 2,068 | 2,746 | 2,761 | 2,464 | 2,541 | 2,876 | 2,887 |
| Monkfish Angler nei | 3,283 | 3,453 | 3,269 | 3,203 | 3,246 | 3,249 | 3,148 | 3,106 | 3,328 | 3,212 |
| Plaice | 1,952 | 1,833 | 1,821 | 1,559 | 1,800 | 1,810 | 1,832 | 1,785 | 1,943 | 1,710 |
| Pollack | 2,018 | 1,941 | 1,710 | 1,605 | 1,796 | 1,794 | 1,735 | 1,709 | 2,028 | 2,000 |
| Razor Shells | 3,300 | 2,665 | 3,300 | 3,300 | 2,670 | 2,729 | 3,307 | 4,956 | 5,100 | 6,169 |
| Saithe | 805 | 983 | 859 | 983 | 1,098 | 1,109 | 1,000 | 1,152 | 1,273 | 1,328 |
| Scallop Great Atlantic | 2,540 | 10,380 | 5,310 | 5,200 | 9,050 | 5,000 | 3,244 | 2,654 | 3,622 | 3,100 |
| Sole Black | 11,705 | 12,686 | 9,083 | 8,881 | 9,420 | 9,420 | 9,308 | 9,058 | 9,087 | 9,308 |
| Sprat European | 230 | 230 | 200 | 190 | 180 | 180 | 220 | 223 | 180 | 350 |
| Thornback Ray | 1,687 | – | 1,217 | 1,565 | 1,461 | 1,381 | 1,548 | 1,347 | 1,504 | 1,522 |
| Tuna Albacore | 2,500 | 2,500 | 5,000 | 3,710 | 2,350 | 2,350 | 2,160 | 1,880 | 2,075 | 4,680 |
| Turbot | 8,705 | 9,800 | 8,407 | 8,022 | 8,509 | 8,472 | 8,624 | 8,770 | 8,898 | 8,800 |
| Whelk | 668 | 740 | 640 | 500 | 801 | 802 | 1,193 | 1,363 | 1,288 | 1,523 |
| Whiting | 1,355 | 1,389 | 1,256 | 1,246 | 1,190 | 1,201 | 1,127 | 1,185 | 1,280 | 1,286 |
| Witch | 2,057 | 2,003 | 1,914 | 1,403 | 1,806 | 1,798 | 1,764 | 1,690 | 1,797 | 1,679 |
| Other Species | 1,170 | 1,300 | 1,304 | 1,435 | 1,855 | 2,171 | 1,751 | 1,717 | 2,000 | 2,276 |
| – No landings reported | ||||||||||
| Table 4A Landings by Irish Vessels by Port 2007-2016 (Tonnage) | ||||||||||
| Tonnes (Live weight equivalent) | ||||||||||
| Port | 2007 | 2008 | 2009 | 2010 | 2011 | 2012 | 2013 | 2014 | 2015 | 2016 |
| Achill | 183 | 650 | 223 | 205 | 110 | 125 | 147 | 168 | 55 | 531 |
| Arklow | 1,359 | 274 | 368 | 730 | 730 | 738 | 453 | 615 | 527 | 967 |
| Arranmore | 20 | 36 | 37 | 84 | 67 | 80 | 90 | 132 | 99 | 48 |
| Balbriggan | 280 | 344 | 136 | 240 | 312 | 319 | 256 | 395 | 343 | 354 |
| Ballycotton | 307 | 588 | 741 | 571 | 1,171 | 1,211 | 1,120 | 1,158 | 1,056 | 1,373 |
| Ballycrovane | 155 | 67 | 135 | 188 | 163 | 216 | 166 | 162 | 540 | 355 |
| Ballyglass | 260 | 58 | 144 | 161 | 161 | 232 | 452 | 313 | 401 | 930 |
| Baltimore | 1,722 | 2,138 | 2,510 | 2,766 | 2,697 | 3,306 | 3,721 | 2,294 | 2,430 | 2,699 |
| Belmullet/Blacksod | 338 | 111 | 84 | 154 | 80 | 47 | 69 | 75 | 35 | 146 |
| Burtonport | 59 | 190 | 58 | 223 | 128 | 26 | 88 | 408 | 285 | 194 |
| Castletownbere | 14,734 | 9,116 | 12,815 | 11,290 | 14,182 | 28,430 | 17,687 | 14,597 | 15,436 | 14,008 |
| Clogherhead | 1,183 | 1,365 | 1,140 | 1,143 | 1,334 | 1,485 | 1,383 | 1,741 | 1,554 | 1,834 |
| Cobh | 635 | 189 | 409 | 586 | 391 | 1,080 | 3,860 | 4,628 | 3,848 | 237 |
| Dingle | 5,143 | 5,153 | 5,420 | 6,040 | 4,490 | 10,587 | 5,348 | 5,248 | 4,871 | 4,137 |
| Duncannon/St. Helens | 369 | 525 | 748 | 1,107 | 2,195 | 5,639 | 2,979 | 1,666 | 4,048 | 3,015 |
| Dundalk | 603 | 80 | 113 | 18 | 122 | 79 | 161 | 79 | 40 | 101 |
| Dunmore East | 8,392 | 6,361 | 5,556 | 8,224 | 8,409 | 13,047 | 11,707 | 11,319 | 10,839 | 10,189 |
| Greencastle | 2,065 | 2,633 | 2,581 | 3,290 | 2,642 | 7,155 | 2,327 | 2,605 | 2,588 | 3,298 |
| Howth | 3,755 | 2,819 | 1,769 | 2,475 | 3,343 | 4,589 | 4,983 | 4,303 | 4,190 | 5,703 |
| Killybegs | 86,711 | 92,331 | 96,878 | 97,970 | 84,561 | 123,172 | 117,390 | 139,616 | 123,337 | 122,594 |
| Kilmore Quay | 2,615 | 2,217 | 2,544 | 3,260 | 3,722 | 5,128 | 4,665 | 4,681 | 4,428 | 5,435 |
| Kinsale | 1,200 | 878 | 1,199 | 1,005 | 1,292 | 1,495 | 1,262 | 2,063 | 1,615 | 1,599 |
| Malin Head | 808 | 705 | 375 | 765 | 541 | 717 | 660 | 1,368 | 856 | 898 |
| Rathmullan | 374 | 281 | 19 | 437 | 548 | 1,104 | 677 | 1,249 | 1,041 | 960 |
| Ringaskiddy | 4,046 | 2,980 | 2,268 | 2,566 | 7,896 | 9,387 | 906 | 600 | 3,377 | 3,658 |
| Ros a' Mhil | 3,739 | 4,474 | 4,256 | 4,822 | 4,230 | 6,019 | 5,715 | 4,579 | 3,484 | 3,074 |
| Rosslare | 1,105 | 639 | 1,658 | 515 | 1,446 | 1,517 | 1,001 | 1,378 | 961 | 957 |
| Skerries | 940 | 935 | 717 | 871 | 1,065 | 717 | 441 | 427 | 182 | 401 |
| Union Hall | 1,929 | 2,213 | 2,766 | 2,716 | 3,000 | 3,351 | 3,269 | 2,528 | 2,283 | 2,305 |
| Wicklow | 1,350 | 1,415 | 1,585 | 1,678 | 1,835 | 1,778 | 1,265 | 1,323 | 1,348 | 1,844 |
| Other Irish Ports | 8,871 | 7,441 | 17,111 | 8,514 | 9,439 | 16,429 | 8,676 | 8,625 | 8,092 | 13,774 |
| Foreign Ports | 59,827 | 52,723 | 115,870 | 153,440 | 45,635 | 57,339 | 39,709 | 55,352 | 29,834 | 33,933 |
| Total | 215,079 | 201,932 | 282,231 | 318,055 | 207,939 | 306,544 | 242,635 | 275,696 | 234,028 | 241,553 |
| Table 4B Landings by Foreign Vessels in Ireland by Port 2007-2016 (Tonnage) | ||||||||||
| Tonnes (Live weight equivalent) | ||||||||||
| Port | 2007 | 2008 | 2009 | 2010 | 2011 | 2012 | 2013 | 2014 | 2015 | 2016 |
| Castletownbere | 8,173 | 5,326 | 7,301 | 7,740 | 11,245 | 4,136 | 14,418 | 20,407 | 30,326 | 25,554 |
| Dingle | 3,531 | 6,165 | 8,907 | 6,721 | 6,436 | 1,340 | 6,775 | 6,973 | 7,739 | 6,317 |
| Dunmore East | 8 | 155 | 77 | 162 | 109 | 442 | 287 | 215 | 139 | 198 |
| Greencastle | 11 | 130 | 163 | 749 | 695 | – | 1,466 | 1,103 | 238 | 284 |
| Howth | 1 | 115 | 42 | – | 19 | 1 | 71 | 179 | 221 | 294 |
| Killybegs | 19,244 | 60,816 | 47,277 | 65,476 | 16,067 | 74,351 | 52,749 | 43,436 | 53,699 | 32,941 |
| Rathmullan | 962 | 579 | 371 | 229 | 392 | – | 457 | 709 | 796 | 1,030 |
| Ros a' Mhil | – | 4 | – | – | – | – | 80 | 191 | 153 | 317 |
| Other Irish Ports | 125 | 174 | 273 | 262 | 190 | 80 | 639 | 824 | 627 | 1,076 |
| Total | 32,054 | 73,464 | 64,411 | 81,340 | 35,153 | 80,349 | 76,943 | 74,039 | 93,938 | 68,012 |
| – No landings reported | ||||||||||
| Table 4C Landings by Irish Vessels by Port 2007-2016 (Value) | ||||||||||
| €000 | ||||||||||
| Port | 2007 | 2008 | 2009 | 2010 | 2011 | 2012 | 2013 | 2014 | 2015 | 2016 |
| Achill | 342 | 1,004 | 575 | 793 | 387 | 439 | 311 | 468 | 157 | 1,978 |
| Arklow | 1,232 | 469 | 470 | 624 | 959 | 699 | 696 | 820 | 1,085 | 1,625 |
| Arranmore | 81 | 155 | 137 | 259 | 100 | 127 | 174 | 199 | 224 | 144 |
| Balbriggan | 801 | 791 | 300 | 828 | 775 | 1,462 | 728 | 1,406 | 1,225 | 1,567 |
| Ballycotton | 792 | 1,979 | 1,955 | 1,349 | 2,855 | 2,996 | 2,995 | 3,218 | 3,389 | 4,425 |
| Ballycrovane | 238 | 120 | 193 | 263 | 299 | 311 | 429 | 241 | 787 | 732 |
| Ballyglass | 436 | 81 | 221 | 183 | 148 | 295 | 556 | 388 | 344 | 1,121 |
| Baltimore | 2,278 | 1,524 | 1,777 | 1,598 | 2,179 | 3,004 | 2,537 | 2,422 | 2,658 | 3,243 |
| Belmullet/Blacksod | 699 | 224 | 243 | 288 | 131 | 119 | 141 | 102 | 69 | 347 |
| Burtonport | 245 | 420 | 102 | 622 | 454 | 52 | 159 | 941 | 423 | 489 |
| Castletownbere | 15,746 | 16,088 | 19,804 | 16,083 | 21,354 | 43,887 | 24,606 | 26,424 | 30,190 | 39,142 |
| Clogherhead | 2,398 | 6,342 | 3,780 | 4,330 | 4,830 | 6,588 | 4,681 | 7,974 | 6,122 | 9,335 |
| Cobh | 1,465 | 855 | 1,241 | 1,628 | 1,317 | 2,847 | 4,582 | 5,899 | 6,359 | 1,407 |
| Dingle | 4,840 | 6,242 | 4,988 | 5,323 | 5,275 | 17,744 | 5,280 | 8,231 | 6,940 | 6,999 |
| Duncannon/St. Helens | 1,223 | 4,111 | 4,341 | 2,104 | 4,395 | 4,649 | 1,941 | 2,041 | 2,400 | 3,331 |
| Dundalk | 1,492 | 201 | 303 | 46 | 166 | 163 | 362 | 389 | 215 | 369 |
| Dunmore East | 19,353 | 14,283 | 10,208 | 13,138 | 12,485 | 17,899 | 14,234 | 16,171 | 15,881 | 18,068 |
| Greencastle | 5,667 | 5,834 | 4,868 | 6,573 | 5,464 | 9,908 | 4,730 | 5,005 | 6,199 | 8,141 |
| Howth | 9,808 | 9,121 | 3,981 | 5,274 | 9,563 | 18,974 | 12,457 | 10,463 | 11,579 | 14,911 |
| Killybegs | 41,770 | 36,337 | 39,589 | 42,633 | 63,562 | 77,738 | 67,112 | 86,878 | 64,350 | 64,108 |
| Kilmore Quay | 9,431 | 11,790 | 8,680 | 13,547 | 18,432 | 15,204 | 14,398 | 13,372 | 15,580 | 12,952 |
| Kinsale | 2,696 | 2,535 | 2,438 | 1,820 | 2,523 | 3,081 | 2,355 | 2,703 | 3,222 | 3,391 |
| Malin Head | 1,341 | 814 | 616 | 1,210 | 815 | 879 | 1,129 | 1,448 | 993 | 1,237 |
| Rathmullan | 518 | 186 | 23 | 261 | 537 | 938 | 624 | 768 | 545 | 1,030 |
| Ringaskiddy | 717 | 504 | 499 | 463 | 3,150 | 3,992 | 343 | 139 | 1,242 | 2,127 |
| Ros a' Mhil | 8,915 | 7,665 | 6,739 | 7,199 | 9,893 | 12,689 | 15,933 | 13,615 | 11,654 | 12,877 |
| Rosslare | 2,960 | 3,155 | 3,390 | 1,636 | 3,937 | 2,846 | 2,399 | 3,161 | 1,997 | 2,243 |
| Skerries | 2,500 | 2,416 | 1,141 | 1,385 | 2,286 | 3,680 | 1,341 | 1,500 | 625 | 1,092 |
| Union Hall | 5,985 | 8,273 | 6,735 | 6,236 | 7,734 | 7,942 | 7,143 | 6,892 | 6,681 | 8,547 |
| Wicklow | 897 | 1,750 | 1,246 | 1,486 | 2,012 | 1,954 | 2,017 | 1,480 | 1,678 | 3,047 |
| Other Irish Ports | 19,481 | 18,454 | 23,025 | 20,207 | 28,891 | 32,468 | 15,912 | 16,444 | 15,593 | 25,757 |
| Foreign Ports | 33,412 | 27,090 | 32,494 | 49,510 | 33,774 | 31,370 | 20,482 | 31,401 | 22,204 | 24,788 |
| Total | 199,762 | 190,816 | 186,099 | 208,900 | 250,682 | 326,945 | 232,788 | 272,603 | 242,608 | 280,570 |
| Table 4D Landings by Foreign Vessels in Ireland by Port 2007-2016 (Value) | ||||||||||
| €000 | ||||||||||
| Port | 2007 | 2008 | 2009 | 2010 | 2011 | 2012 | 2013 | 2014 | 2015 | 2016 |
| Castletownbere | 22,108 | 13,138 | 15,604 | 13,799 | 25,066 | 9,606 | 33,068 | 55,705 | 82,475 | 71,674 |
| Dingle | 8,902 | 17,875 | 17,939 | 13,526 | 12,356 | 2,007 | 12,918 | 17,629 | 21,954 | 16,577 |
| Dunmore East | 21 | 406 | 185 | 563 | 198 | 210 | 522 | 398 | 302 | 953 |
| Greencastle | 62 | 160 | 202 | 899 | 835 | – | 3,452 | 1,993 | 727 | 550 |
| Howth | 2 | 521 | 54 | – | 56 | 1 | 135 | 289 | 401 | 709 |
| Killybegs | 14,376 | 16,725 | 15,842 | 19,241 | 11,358 | 17,022 | 18,559 | 26,004 | 27,811 | 21,043 |
| Rathmullan | 1,558 | 837 | 417 | 350 | 539 | – | 669 | 981 | 1,189 | 1,605 |
| Ros a' Mhil | – | 13 | – | – | – | – | 102 | 254 | 207 | 1,107 |
| Other Irish Ports | 293 | 343 | 536 | 627 | 546 | 176 | 1,084 | 1,385 | 1,169 | 2,011 |
| Total | 47,322 | 50,017 | 50,779 | 49,006 | 50,953 | 29,022 | 70,508 | 104,638 | 136,236 | 116,229 |
| – No landings reported | ||||||||||
| Table 5A Landings by Irish Vessels in Ireland by County 2007-2016 (Tonnage) | ||||||||||
| Tonnes (Live weight equivalent) | ||||||||||
| County | 2007 | 2008 | 2009 | 2010 | 2011 | 2012 | 2013 | 2014 | 2015 | 2016 |
| Cork | 26,589 | 19,440 | 24,139 | 23,134 | 32,199 | 50,405 | 35,040 | 30,731 | 33,891 | 30,408 |
| Donegal | 93,044 | 98,960 | 101,110 | 104,514 | 89,595 | 133,800 | 123,001 | 146,970 | 129,571 | 131,657 |
| Dublin | 5,342 | 4,401 | 2,744 | 3,713 | 5,576 | 5,728 | 6,047 | 5,396 | 5,439 | 8,170 |
| Galway | 4,003 | 5,613 | 5,439 | 6,176 | 4,476 | 6,332 | 6,039 | 5,982 | 3,712 | 3,499 |
| Kerry | 6,404 | 5,694 | 6,740 | 7,289 | 5,500 | 12,630 | 6,686 | 6,195 | 5,718 | 5,750 |
| Louth | 2,572 | 1,611 | 4,007 | 1,285 | 1,710 | 2,320 | 1,709 | 1,896 | 1,597 | 1,947 |
| Mayo | 1,378 | 1,182 | 933 | 1,217 | 687 | 688 | 944 | 971 | 714 | 2,040 |
| Waterford | 8,493 | 6,506 | 7,507 | 8,534 | 11,122 | 17,136 | 12,529 | 11,629 | 11,470 | 10,580 |
| Wexford | 4,343 | 3,412 | 11,114 | 5,623 | 8,736 | 17,488 | 9,033 | 8,062 | 10,144 | 10,553 |
| Wicklow | 2,810 | 1,690 | 1,953 | 2,408 | 2,565 | 2,517 | 1,719 | 1,939 | 1,876 | 2,811 |
| Other Counties | 273 | 700 | 674 | 721 | 138 | 161 | 179 | 573 | 62 | 207 |
| Total | 155,252 | 149,209 | 166,361 | 164,615 | 162,303 | 249,205 | 202,926 | 220,344 | 204,194 | 207,620 |
| Table 5B Landings by Foreign Vessels in Ireland by County 2007-2016 (Tonnage) | ||||||||||
| Tonnes (Live weight equivalent) | ||||||||||
| County | 2007 | 2008 | 2009 | 2010 | 2011 | 2012 | 2013 | 2014 | 2015 | 2016 |
| Cork | 8,173 | 5,336 | 7,319 | 7,740 | 11,254 | 4,142 | 14,418 | 20,414 | 30,331 | 25,673 |
| Donegal | 20,217 | 61,585 | 47,935 | 66,603 | 17,195 | 74,351 | 55,198 | 45,773 | 55,066 | 34,716 |
| Dublin | 36 | 115 | 42 | 15 | 19 | 1 | 71 | 179 | 224 | 296 |
| Galway | – | 4 | – | – | – | – | 80 | 191 | 156 | 317 |
| Kerry | 3,534 | 6,165 | 8,922 | 6,721 | 6,436 | 1,344 | 6,775 | 6,973 | 7,739 | 6,318 |
| Louth | 16 | 10 | 7 | 20 | 17 | 0 | 20 | 49 | 26 | 49 |
| Mayo | – | – | 13 | 0 | – | – | – | – | 187 | 302 |
| Waterford | 8 | 156 | 77 | 162 | 109 | 442 | 313 | 215 | 139 | 198 |
| Wexford | 71 | 48 | 87 | 66 | 77 | 58 | 67 | 60 | 18 | 100 |
| Wicklow | – | 45 | 10 | 12 | 46 | 12 | – | 56 | 51 | 45 |
| Other Counties | – | – | – | – | – | – | – | 130 | – | – |
| Total | 32,054 | 73,464 | 64,411 | 81,340 | 35,153 | 80,349 | 76,943 | 74,039 | 93,938 | 68,012 |
| – No landings reported | ||||||||||
| Table 5C Landings by Irish Vessels in Ireland by County 2007-2016 (Value) | ||||||||||
| €000 | ||||||||||
| County | 2007 | 2008 | 2009 | 2010 | 2011 | 2012 | 2013 | 2014 | 2015 | 2016 |
| Cork | 34,547 | 34,885 | 37,316 | 32,363 | 44,157 | 72,190 | 49,183 | 52,596 | 62,047 | 70,979 |
| Donegal | 54,591 | 47,486 | 46,743 | 54,707 | 72,462 | 91,276 | 76,539 | 96,971 | 75,048 | 81,017 |
| Dublin | 13,520 | 12,878 | 5,553 | 7,667 | 19,286 | 24,257 | 14,999 | 13,861 | 13,710 | 19,349 |
| Galway | 9,585 | 12,457 | 10,889 | 12,120 | 10,532 | 13,420 | 16,824 | 17,462 | 12,342 | 14,129 |
| Kerry | 8,568 | 7,683 | 8,451 | 9,158 | 8,629 | 22,237 | 8,905 | 10,358 | 9,210 | 11,262 |
| Louth | 6,118 | 7,015 | 5,689 | 4,718 | 5,590 | 7,795 | 5,421 | 8,658 | 6,346 | 9,768 |
| Mayo | 2,746 | 2,377 | 2,074 | 2,557 | 1,403 | 1,465 | 1,546 | 1,767 | 958 | 4,257 |
| Waterford | 19,653 | 14,663 | 14,196 | 13,775 | 22,373 | 31,862 | 16,341 | 16,734 | 16,624 | 18,768 |
| Wexford | 13,852 | 19,107 | 18,984 | 17,894 | 29,118 | 28,014 | 19,316 | 19,162 | 21,127 | 20,827 |
| Wicklow | 2,187 | 2,219 | 1,716 | 2,110 | 2,971 | 2,654 | 2,714 | 2,300 | 2,763 | 4,672 |
| Other Counties | 983 | 2,956 | 1,993 | 2,322 | 388 | 405 | 518 | 1,333 | 230 | 756 |
| Total | 166,350 | 163,726 | 153,605 | 159,390 | 216,908 | 295,575 | 212,306 | 241,202 | 220,404 | 255,783 |
| Table 5D Landings by Foreign Vessels in Ireland by County 2007-2016 (Value) | ||||||||||
| €000 | ||||||||||
| County | 2007 | 2008 | 2009 | 2010 | 2011 | 2012 | 2013 | 2014 | 2015 | 2016 |
| Cork | 22,108 | 13,171 | 15,643 | 13,799 | 25,090 | 9,616 | 33,068 | 55,716 | 82,490 | 71,994 |
| Donegal | 15,996 | 17,784 | 16,574 | 20,711 | 12,783 | 17,022 | 23,458 | 29,704 | 30,246 | 23,945 |
| Dublin | 16 | 521 | 54 | 49 | 56 | 1 | 135 | 290 | 416 | 721 |
| Galway | – | 13 | – | – | – | – | 102 | 254 | 211 | 1,107 |
| Kerry | 8,911 | 17,875 | 17,974 | 13,526 | 12,356 | 2,012 | 12,918 | 17,629 | 21,954 | 16,584 |
| Louth | 54 | 34 | 32 | 66 | 34 | 0 | 59 | 220 | 103 | 69 |
| Mayo | – | – | 25 | 2 | – | – | – | – | 279 | 432 |
| Waterford | 21 | 413 | 185 | 563 | 198 | 210 | 558 | 398 | 302 | 953 |
| Wexford | 216 | 161 | 264 | 259 | 268 | 122 | 211 | 164 | 60 | 283 |
| Wicklow | – | 47 | 28 | 30 | 169 | 38 | – | 167 | 175 | 142 |
| Other Counties | – | – | – | – | – | – | – | 96 | – | – |
| Total | 47,322 | 50,017 | 50,779 | 49,006 | 50,953 | 29,022 | 70,508 | 104,638 | 136,236 | 116,229 |
| – No landings reported | ||||||||||
| Table 6A Landings by Irish Vessels in Ireland by Catch Zone 2007-2016 (Tonnage) | ||||||||||
| Tonnes (Live weight equivalent) | ||||||||||
| Catch Zone | 2007 | 2008 | 2009 | 2010 | 2011 | 2012 | 2013 | 2014 | 2015 | 2016 |
| Azores Grounds | 0 | 0 | 0 | 0 | 0 | 0 | 405 | 199 | 28 | 227 |
| Bay of Biscay | 60 | 6 | 39 | 63 | 723 | 1,180 | 395 | 11 | 731 | 2,932 |
| Bristol Channel | 110 | 116 | 62 | 74 | 302 | 436 | 71 | 39 | 96 | 147 |
| Celtic Sea | 20,581 | 17,704 | 22,322 | 25,076 | 28,761 | 74,817 | 40,801 | 37,432 | 37,664 | 36,313 |
| Irish Sea | 12,656 | 9,556 | 19,813 | 11,065 | 19,027 | 21,294 | 15,685 | 13,287 | 15,627 | 11,253 |
| North Sea | 1,826 | 1,741 | 1,773 | 5,436 | 7,032 | 13,324 | 8,748 | 27,515 | 25,450 | 19,546 |
| Porcupine Bank | 16,023 | 12,174 | 4,269 | 8,901 | 2,914 | 3,728 | 4,843 | 7,184 | 11,715 | 17,702 |
| South-West of Ireland | 31,238 | 19,188 | 33,519 | 31,250 | 17,413 | 46,800 | 35,471 | 34,356 | 30,011 | 18,051 |
| West of Ireland | 17,609 | 26,048 | 34,440 | 23,678 | 13,045 | 24,080 | 32,773 | 34,045 | 34,463 | 23,151 |
| West of Scotland and Rockall | 53,518 | 62,073 | 49,736 | 58,981 | 63,696 | 18,486 | 63,713 | 64,546 | 47,294 | 66,242 |
| Other Areas | 1,018 | 583 | 228 | 19 | 164 | 4,560 | 22 | 1,731 | 1,114 | 70 |
| Not Stated | 613 | 19 | 161 | 71 | 9,227 | 40,500 | – | – | – | 11,986 |
| Total | 155,252 | 149,209 | 166,361 | 164,615 | 162,303 | 249,205 | 202,926 | 220,344 | 204,194 | 207,620 |
| – No landings reported | ||||||||||
| Table 6B Landings by Irish Vessels in Foreign Ports by Catch Zone 2007-2016 (Tonnage) | ||||||||||
| Tonnes (Live weight equivalent) | ||||||||||
| Catch Zone | 2007 | 2008 | 2009 | 2010 | 2011 | 2012 | 2013 | 2014 | 2015 | 2016 |
| Bay of Biscay | 1,307 | 246 | 3 | 285 | 0 | 1 | 770 | 119 | 34 | 4,994 |
| Bristol Channel | 5 | 2 | 34 | 25 | 42 | 11 | – | 2 | – | – |
| Celtic Sea | 172 | 99 | 18,625 | 10,247 | 8,707 | 14,475 | 6,059 | 16,666 | 6,490 | 4,887 |
| Irish Sea | 414 | 199 | 5,654 | 1,004 | 483 | 881 | 95 | 122 | 149 | 135 |
| North Sea | 13,416 | 11,998 | 13,040 | 10,732 | 11,548 | 843 | 6,153 | 19,111 | 10,050 | 6,325 |
| Porcupine Bank | 15,425 | 837 | 1,675 | 1,010 | 126 | 21 | 2,421 | 929 | 324 | 5,845 |
| South-West of Ireland | 11,209 | 19,286 | 41,621 | 63,674 | 5,427 | 12,371 | 9,598 | 7,123 | 2,336 | 263 |
| West of Ireland | 5,291 | 3,380 | 568 | 2,739 | 751 | 8,026 | 6,083 | 1,613 | 2,003 | 388 |
| West of Scotland and Rockall | 5,816 | 7,143 | 12,289 | 16,511 | 10,616 | 6,450 | 4,087 | 8,087 | 6,445 | 8,397 |
| Other Areas | 6,773 | 9,532 | 22,362 | 43,378 | 6,117 | 4,979 | 4,442 | 1,579 | 2,003 | 2,679 |
| Not Stated | – | – | – | 3,834 | 1,819 | 9,280 | – | – | – | 18 |
| Total | 59,827 | 52,723 | 115,870 | 153,440 | 45,635 | 57,339 | 39,709 | 55,352 | 29,834 | 33,933 |
| – No landings reported | ||||||||||
| Table 7A Landings by All Vessels in Castletownbere by Species 2007-2016 (Tonnage) | ||||||||||||||
| Tonnes (Live weight equivalent) | ||||||||||||||
| Year | Atlantic Herring | Atlantic Mackerel | Boarfish | Haddock | Hake European | Horse Mackerel | Lobster Norway | Megrim nei | Monkfish Angler nei | Sprat European | Tuna Albacore | Whiting | Other Species | Total |
| 2007 | 2,047 | 1,440 | 3,113 | 661 | 3,564 | 803 | 505 | 1,348 | 3,037 | 2,723 | 455 | 531 | 2,681 | 22,907 |
| 2008 | 946 | 1,403 | – | 479 | 2,185 | 686 | 507 | 1,122 | 2,466 | 1,252 | 1,019 | 458 | 1,920 | 14,443 |
| 2009 | 1,100 | 2,030 | 3 | 620 | 3,294 | 1,018 | 539 | 1,804 | 3,113 | 2,908 | 1,569 | 547 | 1,572 | 20,116 |
| 2010 | 1,535 | 1,253 | 1 | 666 | 3,278 | 1,070 | 486 | 2,245 | 3,738 | 1,588 | 610 | 974 | 1,585 | 19,030 |
| 2011 | 1,492 | 1,024 | 1,415 | 664 | 5,850 | 1,405 | 603 | 2,274 | 3,902 | 1,028 | 3,060 | 862 | 1,849 | 25,427 |
| 2012 | 1,568 | 1,040 | 6,937 | 813 | 5,662 | 813 | 722 | 2,773 | 3,896 | 1,269 | 3,106 | 1,401 | 2,567 | 32,566 |
| 2013 | 1,779 | 1,187 | 5,528 | 617 | 6,527 | 263 | 672 | 3,328 | 4,710 | 562 | 1,809 | 1,662 | 3,460 | 32,105 |
| 2014 | 2,220 | 1,139 | 700 | 655 | 10,823 | 472 | 748 | 3,630 | 6,287 | 1,147 | 2,053 | 1,406 | 3,725 | 35,004 |
| 2015 | 1,901 | 1,757 | 131 | 900 | 19,354 | 284 | 1,031 | 3,818 | 5,718 | 2,174 | 2,089 | 1,247 | 5,361 | 45,763 |
| 2016 | 1,875 | 513 | 381 | 975 | 14,566 | 424 | 1,371 | 3,978 | 7,464 | 1,861 | 1,479 | 1,308 | 3,367 | 39,563 |
| – No landings reported | ||||||||||||||
| Table 7B Landings by All Vessels in Killybegs by Species 2007-2016 (Tonnage) | |||||||||
| Tonnes (Live weight equivalent) | |||||||||
| Year | Atlantic Herring | Atlantic Mackerel | Blue Whiting | Boarfish | Horse Mackerel | Monkfish Angler nei | Sprat European | Other Species | Total |
| 2007 | 17,001 | 21,259 | 29,768 | 4,918 | 25,513 | 997 | 374 | 6,125 | 105,955 |
| 2008 | 12,851 | 20,290 | 76,401 | 4,013 | 32,862 | 1,008 | 223 | 5,498 | 153,147 |
| 2009 | 9,760 | 35,966 | 47,815 | 10,451 | 34,071 | 903 | 104 | 5,085 | 144,155 |
| 2010 | 8,853 | 33,933 | 64,689 | 15,338 | 34,844 | 913 | 372 | 4,504 | 163,447 |
| 2011 | 7,562 | 38,040 | 11,761 | 4,401 | 32,794 | 1,032 | 465 | 4,572 | 100,627 |
| 2012 | 12,664 | 43,739 | 77,007 | 16,936 | 41,968 | 683 | 108 | 4,417 | 197,523 |
| 2013 | 12,592 | 49,504 | 46,484 | 22,967 | 34,248 | 457 | 406 | 3,481 | 170,140 |
| 2014 | 6,932 | 76,831 | 49,267 | 12,765 | 33,866 | 445 | 3 | 2,943 | 183,053 |
| 2015 | 8,602 | 71,086 | 60,793 | 10,246 | 20,907 | 320 | 1,391 | 3,691 | 177,036 |
| 2016 | 3,047 | 68,599 | 37,521 | 8,601 | 31,639 | 419 | 472 | 5,237 | 155,536 |
| Table 8A Landings by All Vessels in Ireland for Blue Whiting by Port 2007-2016 (Tonnage) | ||||
| Tonnes (Live weight equivalent) | ||||
| Year | Castletownbere | Killybegs | Other Irish Ports | Total |
| 2007 | 167 | 29,768 | 210 | 30,145 |
| 2008 | 67 | 76,401 | 1 | 76,469 |
| 2009 | 0 | 47,815 | – | 47,815 |
| 2010 | 126 | 64,689 | 118 | 64,933 |
| 2011 | 70 | 11,761 | – | 11,831 |
| 2012 | 175 | 77,007 | 177 | 77,359 |
| 2013 | 190 | 46,484 | 218 | 46,892 |
| 2014 | 624 | 49,267 | 292 | 50,184 |
| 2015 | 698 | 60,793 | 0 | 61,491 |
| 2016 | 0 | 37,521 | 7 | 37,528 |
| – No landings reported | ||||
| Table 8B Landings by All Vessels in Ireland for Atlantic Herring by Port 2007-2016 (Tonnage) | |||||||||
| Tonnes (Live weight equivalent) | |||||||||
| Year | Castletownbere | Cobh | Dingle | Dunmore East | Howth | Killybegs | Ringaskiddy | Other Irish Ports | Total |
| 2007 | 2,047 | 104 | 490 | 844 | – | 17,001 | 4,043 | 1,115 | 25,645 |
| 2008 | 946 | – | 1,119 | 676 | 0 | 12,851 | 2,934 | 1,456 | 19,983 |
| 2009 | 1,100 | – | 809 | 504 | – | 9,760 | 2,268 | 1,112 | 15,552 |
| 2010 | 1,535 | 46 | 1,172 | 1,739 | – | 8,853 | 2,566 | 1,561 | 17,470 |
| 2011 | 1,492 | 63 | 571 | 1,574 | – | 7,562 | 5,866 | 1,423 | 18,552 |
| 2012 | 1,568 | – | 453 | 2,726 | 446 | 12,664 | 8,858 | 1,630 | 28,345 |
| 2013 | 1,779 | 2,593 | 1,057 | 4,514 | 1,087 | 12,592 | 906 | 2,176 | 26,705 |
| 2014 | 2,220 | 3,572 | 454 | 4,766 | 926 | 6,932 | 599 | 2,934 | 22,403 |
| 2015 | 1,901 | 2,768 | 727 | 3,402 | 1,066 | 8,602 | 3,334 | 1,682 | 23,483 |
| 2016 | 1,875 | – | 518 | 3,459 | 2,253 | 3,047 | 3,399 | 2,209 | 16,761 |
| – No landings reported | |||||||||
| Table 8C Landings by All Vessels in Ireland for Atlantic Mackerel by Port 2007-2016 (Tonnage) | ||||||
| Tonnes (Live weight equivalent) | ||||||
| Year | Castletownbere | Dingle | Killybegs | Ros a'Mhil | Other Irish Ports | Total |
| 2007 | 1,440 | 1,393 | 21,259 | 760 | 300 | 25,152 |
| 2008 | 1,403 | 1,529 | 20,290 | 1,536 | 980 | 25,738 |
| 2009 | 2,030 | 1,684 | 35,966 | 1,363 | 956 | 41,999 |
| 2010 | 1,253 | 1,534 | 33,933 | 1,381 | 754 | 38,854 |
| 2011 | 1,024 | 1,231 | 38,040 | 1,296 | 1,020 | 42,612 |
| 2012 | 1,040 | 1,239 | 43,739 | 1,632 | 405 | 48,055 |
| 2013 | 1,187 | 400 | 49,504 | 1,313 | 704 | 53,108 |
| 2014 | 1,139 | 1,678 | 76,831 | 1,622 | 1,803 | 83,072 |
| 2015 | 1,757 | 1,592 | 71,086 | 1,865 | 542 | 76,840 |
| 2016 | 513 | 835 | 68,599 | 845 | 704 | 71,497 |
| Table 8D Landings by All Vessels in Ireland for Horse Mackerel by Port 2007-2016 (Tonnage) | ||||||
| Tonnes (Live weight equivalent) | ||||||
| Year | Castletownbere | Dingle | Killybegs | Ros a'Mhil | Other Irish Ports | Total |
| 2007 | 803 | 1,054 | 25,513 | 317 | 267 | 27,954 |
| 2008 | 686 | 1,129 | 32,862 | 640 | 323 | 35,640 |
| 2009 | 1,018 | 1,362 | 34,071 | 571 | 489 | 37,510 |
| 2010 | 1,070 | 1,558 | 34,844 | 1,095 | 589 | 39,156 |
| 2011 | 1,405 | 827 | 32,794 | 815 | 465 | 36,305 |
| 2012 | 813 | 1,038 | 41,968 | 1,258 | 235 | 45,312 |
| 2013 | 263 | 655 | 34,248 | 651 | 8 | 35,824 |
| 2014 | 472 | 493 | 33,866 | 227 | 0 | 35,058 |
| 2015 | 284 | 200 | 20,907 | 113 | 487 | 21,991 |
| 2016 | 424 | 27 | 31,639 | 142 | 241 | 32,474 |
| Table 9A Landings by Irish Vessels by Month 2003-2016 (Tonnage Percent) | ||||||||||||
| % | ||||||||||||
| Year | January | February | March | April | May | June | July | August | September | October | November | December |
| 2003 | 8 | 13 | 15 | 3 | 5 | 5 | 2 | 5 | 7 | 10 | 12 | 14 |
| 2004 | 12 | 7 | 17 | 13 | 4 | 2 | 4 | 5 | 9 | 6 | 11 | 10 |
| 2005 | 10 | 16 | 18 | 12 | 2 | 5 | 4 | 5 | 3 | 13 | 10 | 3 |
| 2006 | 15 | 25 | 10 | 2 | 1 | 5 | 6 | 3 | 6 | 7 | 11 | 7 |
| 2007 | 10 | 24 | 9 | 5 | 2 | 2 | 2 | 2 | 3 | 15 | 17 | 8 |
| 2008 | 17 | 17 | 9 | 6 | 2 | 2 | 2 | 3 | 4 | 12 | 16 | 10 |
| 2009 | 12 | 18 | 8 | 5 | 2 | 3 | 3 | 2 | 7 | 19 | 12 | 8 |
| 2010 | 16 | 14 | 11 | 4 | 3 | 3 | 3 | 3 | 9 | 15 | 13 | 7 |
| 2011 | 27 | 8 | 5 | 2 | 2 | 2 | 3 | 4 | 5 | 21 | 13 | 9 |
| 2012 | 20 | 16 | 9 | 2 | 2 | 2 | 2 | 2 | 5 | 17 | 15 | 8 |
| 2013 | 24 | 15 | 11 | 2 | 2 | 2 | 3 | 2 | 6 | 16 | 11 | 6 |
| 2014 | 14 | 15 | 12 | 3 | 2 | 2 | 2 | 2 | 3 | 19 | 18 | 6 |
| 2015 | 13 | 21 | 12 | 4 | 2 | 2 | 2 | 2 | 5 | 17 | 12 | 7 |
| 2016 | 14 | 23 | 13 | 4 | 2 | 2 | 2 | 2 | 4 | 15 | 11 | 7 |
| Table 9B Landings by Irish Vessels by Species by Month 2016 (Tonnage Percent) | ||||||||||||
| % | ||||||||||||
| Species | January | February | March | April | May | June | July | August | September | October | November | December |
| Atlantic Herring | 3 | 1 | – | – | – | – | 0 | 0 | 9 | 43 | 30 | 14 |
| Atlantic Mackerel | 17 | 49 | 1 | 0 | 0 | 0 | 0 | 0 | 0 | 24 | 9 | 0 |
| Blue Whiting | 0 | 4 | 82 | 15 | – | – | – | – | – | 0 | – | 0 |
| Boarfish | 2 | 33 | 6 | – | – | – | – | – | 9 | 0 | 26 | 24 |
| Cod Atlantic | 6 | 12 | 25 | 23 | 13 | 7 | 5 | 4 | 4 | 1 | 0 | 0 |
| Crab Edible | 4 | 3 | 4 | 4 | 8 | 10 | 13 | 11 | 11 | 16 | 9 | 6 |
| Haddock | 5 | 8 | 11 | 11 | 11 | 11 | 8 | 8 | 8 | 8 | 5 | 5 |
| Hake European | 3 | 11 | 15 | 16 | 12 | 9 | 9 | 6 | 4 | 5 | 5 | 5 |
| Horse Mackerel | 57 | 13 | 1 | – | – | – | – | – | 0 | 1 | 13 | 15 |
| John Dory | 4 | 4 | 8 | 20 | 17 | 11 | 7 | 8 | 6 | 5 | 5 | 4 |
| Lemon Sole | 5 | 6 | 9 | 13 | 10 | 10 | 9 | 8 | 9 | 9 | 8 | 6 |
| Ling | 6 | 9 | 18 | 16 | 10 | 7 | 5 | 5 | 4 | 6 | 6 | 6 |
| Lobster European | 0 | 1 | 3 | 10 | 16 | 19 | 18 | 15 | 10 | 6 | 2 | 1 |
| Lobster Norway | 5 | 5 | 10 | 9 | 14 | 16 | 13 | 9 | 3 | 3 | 7 | 7 |
| Megrim nei | 5 | 6 | 10 | 10 | 13 | 12 | 8 | 8 | 6 | 7 | 8 | 7 |
| Monkfish Angler nei | 8 | 7 | 9 | 9 | 12 | 12 | 9 | 6 | 3 | 6 | 9 | 10 |
| Plaice | 8 | 6 | 2 | 2 | 8 | 10 | 15 | 13 | 12 | 12 | 7 | 4 |
| Pollack | 10 | 20 | 25 | 13 | 6 | 3 | 5 | 5 | 4 | 4 | 4 | 2 |
| Razor Shells | 9 | 9 | 10 | 8 | 8 | 1 | 12 | 9 | 7 | 6 | 10 | 11 |
| Saithe | 3 | 10 | 18 | 10 | 5 | 5 | 11 | 11 | 7 | 9 | 7 | 4 |
| Scallop Great Atlantic | 4 | 6 | 5 | 7 | 6 | 10 | 8 | 7 | 4 | 25 | 10 | 7 |
| Sole Black | 6 | 8 | 9 | 8 | 9 | 9 | 9 | 6 | 6 | 13 | 9 | 9 |
| Sprat European | 19 | – | – | – | 3 | – | – | 0 | 7 | 39 | 19 | 13 |
| Thornback Ray | 15 | 11 | 9 | 8 | 5 | 4 | 2 | 6 | 5 | 12 | 13 | 11 |
| Tuna Albacore | – | – | – | – | – | – | 14 | 33 | 54 | – | – | – |
| Turbot | 4 | 4 | 6 | 8 | 15 | 17 | 10 | 8 | 6 | 8 | 9 | 6 |
| Whelk | 4 | 6 | 15 | 12 | 13 | 12 | 12 | 9 | 5 | 5 | 4 | 3 |
| Whiting | 3 | 6 | 9 | 7 | 5 | 6 | 10 | 11 | 11 | 18 | 11 | 3 |
| Witch | 7 | 8 | 9 | 9 | 10 | 9 | 9 | 9 | 6 | 7 | 9 | 8 |
| Other Species | 5 | 6 | 6 | 6 | 5 | 5 | 5 | 13 | 17 | 12 | 11 | 11 |
| Total | 14 | 23 | 13 | 4 | 2 | 2 | 2 | 2 | 4 | 15 | 11 | 7 |
| – No landings reported | ||||||||||||
Introduction
This release contains data on fish landings by: Irish vessels to Irish ports; Irish vessels to foreign ports; and foreign vessels to Irish ports.
Coverage
The Sea Fisheries Protection Authority Statistics Unit is responsible for collating all sea-fisheries data particularly domestic and foreign landings by Irish vessels. Irish fishing vessels of 10 metres or longer are required to complete a logbook. Fishing vessels of less than 10 metres are not generally required to complete a fishing logbook so landing statistics are gathered using sales notes and gatherers documents.
Aquaculture and angling are not included in this release.
Data Quality
The CSO has made some changes to the value data received from the Sea Fisheries Protection Authority, particularly for 2012. The data published by the SFPA should be regarded as the definitive fish landings data for Ireland, see http://www.sfpa.ie/Sea-Fisheries-Conservation/Fisheries-Statistics-and-Quota-Uptake/Annual-Landing-Statistics-2016
Data Source
The data were obtained by the CSO from the Sea Fisheries Protection Authority. Data at annual level were obtained for 2007 to 2016. Monthly data for landings by Irish vessels into Ireland were also received from the Sea Fisheries Protection Authority for 2003 to 2016 but the monthly data are not fully consistent with the annual data. Two tables have been included showing the monthly profile of catches for all landings by Irish vessels for each year and a second table showing the monthly distribution for the most recent year.
Historical Data
The CSO previously published an annual fishery statistics release. Fish landings by Irish vessels covering the period 1990 to 2004 were included in these releases.
ICES Regions
International Council for the Exploration of the Seas (ICES) standardise the division of sea areas for statistical analysis. Each ICES statistical rectangle is '30 min latitude by 1 degree longitude' in size which is approximately 30 nautical miles by 30 nautical miles. A number of rectangles are amalgamated to create ICES areas. The ICES areas have been further aggregated by the CSO to show meaningful areas for fish landings relating to Ireland.
Fishing Ports
The SFPA microdata included the name of the harbour that the fish were landed into. The CSO has grouped these together to show data for the main harbours in Ireland. Irish ports have also been aggregated at county level. Landings by Irish vessels into foreign ports have been aggregated to country level.
Revisions
All data are subject to revision. There are mostly small differences between the official SFPA figures and those published in this release. If the causes of these differences are identified then the CSO will amend these figures as necessary e.g. estimation method for unusually low or high or missing unit values.
Species
This release contains data for the main species landed. The microdata contain data at a more detailed level.
Units
The quantity figures presented are in live weight equivalent. The landed weight may differ from the weight of the fish as it was taken from the sea due to the processing of the catch on board the vessel (e.g. gutting, filleting, etc). Conversion factors were applied to the landed weight by SFPA to calculate the live weight equivalent.
Vessels
The name of the fishing vessel was included for most years in the data provided to the CSO by SFPA. However even in those years, the name of the vessel is not on all records. Hence no tables have been presented showing vessel characteristics (number, length, engine power, etc.).
 Hide Background Notes
Scan the QR code below to view this release online or go to
http://www.cso.ie/en/releasesandpublications/er/fl/fishlandings2007-2016/
 Show Table 1A Landings by Irish Vessels in Ireland and in Foreign Ports 2007-2016 (Tonnage and Value)
  Hide Table 1A Landings by Irish Vessels in Ireland and in Foreign Ports 2007-2016 (Tonnage and Value)