
| Summary of main indicators for banks and insurance, 2009 - 2011 | |||||||||||
| Banks (€millions) | Insurance (€millions) | Total (€millions) | |||||||||
| 20091 | 20101 | 2011 | 20091 | 20101 | 2011 | 20091 | 20101 | 2011 | |||
| Turnover2 | 10,779 | 11,050 | 11,733 | 37,655 | 39,144 | 38,870 | 48,434 | 50,194 | 50,603 | ||
| Gross value added | 7,316 | 7,217 | 8,793 | 3,273 | 3,799 | 2,533 | 10,589 | 11,016 | 11,326 | ||
| of which | |||||||||||
| Gross operating surplus | 4,963 | 4,601 | 5,804 | 2,508 | 3,037 | 1,785 | 7,471 | 7,638 | 7,589 | ||
| Personnel costs | 2,354 | 2,617 | 2,989 | 765 | 762 | 749 | 3,119 | 3,379 | 3,738 | ||
| 1 2009 and 2010 data for banks and insurance were revised following initial publication. | |||||||||||
| 2 In this release, turnover is defined as production value for banks (see Table 1) and gross premiums earned for insurance (see Table 2). | |||||||||||
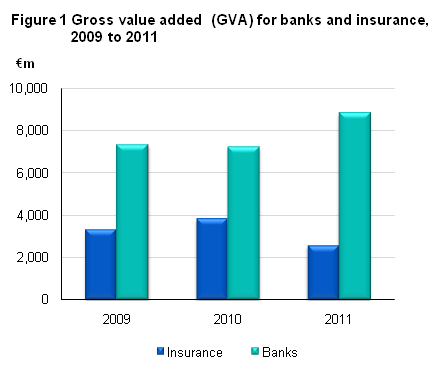
Gross value added (GVA) for all resident banks was €8.8 billion in 2011. This was an increase of €1.6 billion compared to 2010 despite falling interest receivable. GVA is the gross income from operating activities before personnel costs have been deducted. The rise in GVA resulted mainly from a significant rise in other operating income and a reduction in interest payable and commissions payable. See Headline Table, Table 1 and Figure 1.
Gross operating surplus, which is GVA minus personnel costs, was €5.8 billion in 2011 for banks, rising from €4.6 billion in 2010. This was the amount of money that was earned by banks through their normal operations which was used to fund the operation of the business, meet tax obligations, pay out dividends, or to meet the cost of write-downs on the value of loans advanced to customers. See Headline Table.
GVA for insurance companies (life, non-life and reinsurance) was €2.5 billion in 2011, a decrease of almost €1.3 billion compared to 2010. There were numerous factors at play that caused the fall in GVA including falling income (in particular portfolio investment income), inflated gross claims, investment losses, increases in reinsurance services received and a rise in other intermediate consumption (e.g. commissions, brokerage, fronting fees etc.). The offsetting change in the life insurance provision was not enough to compensate for these factors. See Headline Table, Table 2 and Figure 1.
Gross operating surplus or profit for insurance companies was €1.8 billion in 2011 dropping from just over €3.0 billion in 2010. See Headline Table.
In 2011, interest receivable for all resident banks in Ireland was €20.6 billion, a reduction of €2.3 billion from 2010. The 2011 figure comprised of €15.0 billion in interest from loans and deposits and €5.5 billion in interest from securities held as assets. See Figure 2 and Table 1.
| X-axis label | Interest receiveable from securities | Interest receiveable from loans and deposits |
|---|---|---|
| 2009 | 8960000000 | 21310000000 |
| 2010 | 6487000000 | 16396000000 |
| 2011 | 5530000000 | 15023000000 |
Interest payable in 2011 from resident banks was €15.4 billion which comprised €11.3 billion in interest paid for loans and deposits and €4.0 billion in interest paid to holders of issued securities. Interest payable in 2010 was €16.7 billion while in 2009 it was €23.7 billion. See Figure 3 and Table 1.
| X-axis label | Interest payable linked to securities | Interest payable linked to loans and deposits |
|---|---|---|
| 2009 | 5498000000 | 18232000000 |
| 2010 | 4925000000 | 11814000000 |
| 2011 | 4020000000 | 11334000000 |
Gross premiums earned, which is defined as turnover in enterprise statistics, amounted to €38.9 billion in 2011 for all insurance companies in Ireland. This is a fall of approximately €300 million on the 2010 figure. See Figure 4 and Table 2.
Gross claims incurred by insurance companies in 2011 were €40.1 billion, which was a large increase of €10.1 billion from 2010. This large increase was caused by a small number of large transactions in 2011. The outcome was that gross claims incurred were greater than gross premiums earned for 2011. See Figure 4 and Table 2.
| X-axis label | Gross premiums earned | Gross claims incurred |
|---|---|---|
| 2009 | 37655000000 | 27280000000 |
| 2010 | 39144000000 | 29949000000 |
| 2011 | 38870000000 | 40078000000 |
| Table 1 Production account and generation of income for all banks, 2009 - 2011 | |||
| 2009 | 2010 | 2011 | |
| €m | €m | €m | |
| All interest receivable | 30,270 | 22,881 | 20,552 |
| Interest receivable from securities | 8,960 | 6,487 | 5,530 |
| Interest receivable from loans and deposits | 21,310 | 16,396 | 15,023 |
| Commissions receivable | 1,683 | 2,122 | 1,916 |
| Other operating income | 2,555 | 2,785 | 4,618 |
| All Income | 34,508 | 27,788 | 27,087 |
| All Interest payable and similar charges | 23,729 | 16,739 | 15,355 |
| Interest payable linked to securities | 5,498 | 4,925 | 4,020 |
| Interest payable linked to loans and deposits | 18,232 | 11,814 | 11,334 |
| Production value1 excluding value adjustments and profits from affiliates | 10,779 | 11,050 | 11,733 |
| Interest Margin2 | 6,541 | 6,143 | 5,198 |
| Commissions payable | 914 | 1,067 | 450 |
| Other administrative expenses (other than labour costs) | 486 | 822 | 625 |
| Other operating charges | 2,063 | 1,942 | 1,864 |
| Gross value added at factor cost3 | 7,316 | 7,217 | 8,793 |
| Personnel costs | 2,354 | 2,617 | 2,989 |
| Gross operating surplus at factor cost4 | 4,963 | 4,601 | 5,804 |
| 1 All income less all interest payable and similar charges. | |||
| 2 All interest received less all interest payable and similar charges. | |||
| 3 Production value less commissions payable, other administrative expenses (other than labour costs) and other operating expenses. | |||
| 4 Gross value added less personnel costs. | |||
| Source: CSO/Central Bank survey of credit institutions. | |||
| Table 2 Production account and generation of income for all insurance companies, 2009-2011 | |||
| 2009 | 2010 | 2011 | |
| €m | €m | €m | |
| Gross premiums earned | 37,655 | 39,144 | 38,870 |
| Portfolio investment income | 4,664 | 4,717 | 4,122 |
| Investment income - Technical a/c | 3,760 | 4,131 | 3,623 |
| Investment income - Non-Technical a/c | 903 | 586 | 500 |
| Other services produced | 1,876 | 2,045 | 1,673 |
| Fees receivable (commissions etc) | 879 | 1,114 | 1,262 |
| Other income - Technical a/c | 998 | 932 | 411 |
| Gross claims incurred | 27,280 | 29,949 | 40,078 |
| Gross claims payments | 27,593 | 30,175 | 40,308 |
| Gross change in the provision for outstanding claims | -314 | -227 | -230 |
| Capital gains and provisions | -5,377 | -4,030 | 6,349 |
| Capital gains/losses realised and unrealised | 11,834 | 8,682 | -4,004 |
| Gross change in life insurance provision | -17,211 | -12,711 | 10,352 |
| Production value1 | 11,539 | 11,928 | 10,936 |
| Gross value of reinsurance services received | 1,622 | 1,358 | 1,501 |
| Other intermediate consumption | 6,644 | 6,772 | 6,901 |
| Gross value added at factor cost2 | 3,273 | 3,799 | 2,533 |
| Personnel Costs | 765 | 762 | 749 |
| Gross operating surplus3 | 2,508 | 3,037 | 1,785 |
| 1 Includes gross premium earned, portfolio investment income, other services produced, capital gains and provisions less gross claims incurred. | |||
| 2 Production value less gross value of reinsurance services received and other intermediate consumption. | |||
| 3 Gross value added at factor cost less personnel costs. | |||
| Source: CSO Balance of Payments surveys of insurance corporations. | |||
Introduction
The objective behind producing Structural Business Statistics for the Financial Sector is to complete the coverage of the business economy in Ireland and to allow meaningful comparisons with other business sectors such as Industry and Services.
Coverage
This release covers banks (NACE K6419 excluding credit unions), life insurance companies (NACE K6511), non-life insurance companies (NACE K6512) and reinsurance companies (NACE K6520).
The coverage of NACE Rev. 2 Section K (Financial Sector) is wider than the coverage of this release. NACE Rev. 2 Section K includes:
• K64 – Financial Service Activities except Insurance and Pension Funding.
• K65 – Insurance, Reinsurance and Pension Funding.
• K66 – Activities Auxiliary to Financial Services and Insurance Activities.
K64 is dominated by credit institutions which in Ireland are banks and credit unions. However, it also includes activities of holding companies, investment funds and other financial service activities.
K65 includes life insurance companies, non-life insurance companies and reinsurance companies as well as pension funds.
K66 is the most diverse category and includes all financial auxiliaries including brokerage firms, insurance agents and fund management activities.
Definitions
Turnover:
In Structural Business Statistics (SBS), turnover comprises the totals invoiced by the enterprise during the reference period, and this corresponds to market sales of goods or services supplied to third parties.
This definition is difficult to translate to a meaningful value for enterprises in the Financial Sector. Therefore, for the purposes of this release, turnover is equal to production value for the statistics on banks and equal to gross premiums earned for statistics on insurance companies.
Production Value:
Production value measures the amount actually produced by the unit, based on sales, including changes in stocks and the resale of goods and services.
For the statistics on activities of insurance companies, production value is defined as gross premiums earned, plus total portfolio investment income, plus other services produced, minus gross claims incurred, excluding claims management expenses, plus capital gains and provisions.
For the statistics on banks, production value is defined as interest receivable and similar income, less interest payable and similar charges, plus commissions’ receivable, plus income from shares and other variable-yield securities, plus net profit or net loss on financial operations, plus other operating income.
Note that the concept of Financial Intermediation Services Indirectly Measured (FISIM) is used in National Accounts for the calculation of production for banks; however, this concept is not used in Structural Business Statistics.
Gross value added (GVA) at factor cost
GVA at factor cost is the gross income from operating activities after adjusting for operating subsidies and indirect taxes.
For the statistics on insurance companies, value added at factor cost is defined as production value, minus gross value of reinsurance services received, minus commissions, minus other external expenditure on goods and services.
For the statistics on banks, value added at factor cost is defined as production value less total purchases of goods and services.
Gross operating surplus
Gross operating surplus is the surplus generated by operating activities after the labour factor input has been recompensed. It can be calculated by subtracting personnel costs from GVA at factor cost. It is the balance available to the unit which allows it to recompense the providers of own funds and debt, to pay taxes and eventually to finance all or a part of its investment.
 Hide Background Notes
Scan the QR code below to view this release online or go to
http://www.cso.ie/en/releasesandpublications/er/esfs/enterprisestatisticsforthefinancialsector2011/
 Show Table 1 Production account and generation of income for all banks, 2009-2011
 Hide Table 1 Production account and generation of income for all banks, 2009-2011