
This release has been compiled during the COVID-19 crisis. The results contained in this release reflect some of the Employment and Life effects of COVID-19.
The data in this release was collected as part of the Q2 Labour Force Survey data collection, and refers to data collected from households between April 8th-23rd, and is based on 2,288 responses. To ensure a timely release of this information, the data was weighted to agree with the most up to date population estimates (Q4 2019). The full quarter results for Q2 2020 will be published in the coming months. Due to the choices made around sample size and weighting to ensure a timely dissemination of this data, some care should be exercised in interpreting the data. For further information see Background Notes.
Please note that tables 2a-2d are based on a subset of the data which answered “Yes” in table 1. Please also note, respondents may have selected more than one answer option presented in tables 2a-2d and tables 4a-4d.
| Percentage of persons aged 15 and over by employment and life effects of COVID-19, April 20201 | |||||||
| % | |||||||
| Life Effects | |||||||
| Effect on employment situation | Feeling lonely | Afraid to go shopping | Childcare issues | More contact with family by telephone, Skype, FaceTime,etc | |||
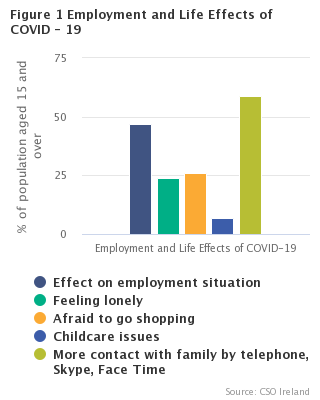
| State | 47 | 24 | 26 | 7 | 59 | ||
| Sex | |||||||
| Male | 50 | 20 | 20 | 6 | 55 | ||
| Female | 44 | 27 | 32 | 9 | 62 | ||
| 1 Results are based on a sample of persons aged 15 and over from weeks 1, 2 and 3 of the Q2 2020 Labour Force Survey | |||||||
Since the emergence of the COVID-19 pandemic there have been many changes to employment and day-to-day life for the people of Ireland. This release analyses changes to work/employment, emotional well-being, effect on finances, and the impact on families for the Irish population aged 15 and over. See release Infographic.
Of the 47% of the population who have had their employment impacted by COVID-19, just over a third (34%) have started remote working from home and 23% of these employment affected persons have seen a change to their work hours. See Tables 2b, 2d and Figure 3.
The COVID-19 pandemic has affected the emotional well-being of the population aged 15 years and over, in that 17% are worried about money, 24% are feeling lonely and 26% are afraid to go shopping. Older people aged 65 years and over are the most afraid to go shopping (41%). See Table 4b.
The COVID-19 pandemic has seen 46% of the population aged 15 years and over increasing positive family time, with 59% of the population increasing their contact with family via telephone, Skype, Face Time etc. See Table 4d and Figure 1.
Please note, respondents may have selected more than one of the answer options presented above.
Since the beginning of COVID-19 pandemic, just under half of the population aged 15 years and over (47%) have seen their employment situation affected. Employment effects due to COVID-19 include: Loss of employment, Temporary layoff, Change in work hours, Remote working from home or Change to business model to online/takeaway etc. For the full list of effects of COVID-19 on employment please see Background Notes.
The age groups with the lowest affected employment are the age groups 15-24 years and 65 years and over. Employment impacts are most felt in the age group 35-44 years, where two-thirds report employment effects. Employment affected rates are highest in the Eastern and Midland region where 51% of persons aged 15 years and over reported employment effects, compared to 44% in the Northern and Western, and Southern regions. For the full list of effects of COVID-19 on employment, please see background notes. See Table 1 and Figure 2.
| Table 1 Percentage of persons aged 15 years and over by effect of COVID-19 on employment1, April 20202 | ||
| % | ||
| Effect on employment | ||
| State | 47 | |
| Sex | ||
| Male | 50 | |
| Female | 44 | |
| Age Group | ||
| 15-24 | 34 | |
| 25-34 | 62 | |
| 35-44 | 66 | |
| 45-54 | 60 | |
| 55-64 | 46 | |
| 65+ | 14 | |
| Region(NUTS2) | ||
| Northern and Western | 44 | |
| Southern | 44 | |
| Eastern and Midland | 51 | |
| 1 This question was asked of all respondents regardless of their current employment status. | ||
| 2 Results are based on a sample of persons aged 15 and over from weeks 1, 2 and 3 of the Q2 2020 Labour Force Survey | ||
| Effect on Employment | |
| 15-24 | 34 |
| 25-34 | 62 |
| 35-44 | 66 |
| 45-54 | 60 |
| 55-64 | 46 |
| 65+ | 14 |
Of those 47% of persons aged 15 years and over whose employment situation has been affected, 14% have lost employment and 33% have been temporarily laid off due to the COVID-19 pandemic. More men (36%) than women (31%) have been temporarily laid off, with loss of employment at equal levels for males and females (both 14%). Younger persons have experienced the highest rates of loss of employment and temporary layoff, with 46% of 15-24 year olds being temporarily laid off and over a fifth (22%) experiencing loss of employment. The highest rates of these employment effects can be seen in the Southern region. See Table 2a.
Please note, respondents may have selected more than one of the options presented in tables 2a-2d. For this reason, percentages will not add to 100%.
| Table 2(a) Percentage of persons aged 15 years and over by effect of COVID-19 on job/employment status1, April 20202 | |||
| % | |||
| Effect on Job/Employment Status | |||
| Loss of employment | Temporary layoff | ||
| State | 14 | 33 | |
| Sex | |||
| Male | 14 | 36 | |
| Female | 14 | 31 | |
| Age Group | |||
| 15-24 | 22 | 46 | |
| 25-34 | 15 | 39 | |
| 35-44 | 10 | 29 | |
| 45-54 | 13 | 26 | |
| 55-64 | 16 | 35 | |
| 65+ | 9 | 35 | |
| Region(NUTS2) | |||
| Northern and Western | 14 | 35 | |
| Southern | 16 | 38 | |
| Eastern and Midland | 13 | 31 | |
| 1 Figures in this table are calculated from the 47% of population whose employment was affected by COVID-19 | |||
| 2 Results are based on a sample of persons aged 15 and over from weeks 1, 2 and 3 of the Q2 2020 Labour Force Survey | |||
| Note: The survey allowed for multiple responses to the question relating to life effects due to COVID19 for this reason percentages will not add to 100%. | |||
Of those 47% of persons aged 15 years and over that indicated COVID-19 had an effect on their employment situation, a third (34%) started working from home, while 12% have increased their hours working from home. 11% of persons aged 15 years and over whose employment situation was affected were unable to work as their business was unable to offer remote working as an option. 20% were unable to work remotely as their work was not suitable for this format. The age group 35-44 years is the age group who most used remote working as a result of the COVID-19 pandemic. The Eastern & Midland region, at 39% of persons aged 15 years and over, had the most people using remote working as a response to the COVID-19 pandemic (with the Southern and Northern & Western regions each around 30%). See Table 2b and Figure 3.
| Table 2(b) Percentage of persons aged 15 years and over by effect of COVID-19 on remote working1, April 20202 | |||||||
| % | |||||||
| Effect on Remote Working | |||||||
| Unable to work | |||||||
| Started remote working | Increased number of hours remote working | Business was unable to offer the facility of remote working | Work was not suitable for remote working | ||||
| State | 34 | 12 | 11 | 20 | |||
| Sex | |||||||
| Male | 31 | 12 | 13 | 21 | |||
| Female | 38 | 13 | 9 | 18 | |||
| Age Group | |||||||
| 15-24 | 23 | 3 | 18 | 23 | |||
| 25-34 | 35 | 10 | 5 | 14 | |||
| 35-44 | 42 | 19 | 11 | 16 | |||
| 45-54 | 38 | 15 | 10 | 19 | |||
| 55-64 | 28 | 8 | 13 | 32 | |||
| 65+ | 18 | 6 | 16 | 25 | |||
| Region(NUTS2) | |||||||
| Northern and Western | 30 | 8 | 11 | 23 | |||
| Southern | 29 | 9 | 11 | 21 | |||
| Eastern and Midland | 39 | 15 | 11 | 18 | |||
| 1 Figures in this table are calculated from the 47% of population whose employment was affected by COVID-19 | |||||||
| 2 Results are based on a sample of persons aged 15 and over from weeks 1, 2 and 3 of the Q2 2020 Labour Force Survey | |||||||
| Note: The survey allowed for multiple responses to the question relating to life effects due to COVID19 for this reason percentages will not add to 100%. | |||||||
| Type of device used | Started remote working | Increased number of hours remote working |
|---|---|---|
| 15-24 | 23 | 3 |
| 25-34 | 35 | 10 |
| 35-44 | 42 | 19 |
| 45-54 | 38 | 15 |
| 55-64 | 28 | 8 |
| 65+ | 18 | 6 |
Of those 47% that indicated the COVID-19 pandemic had an effect on their employment situation, 4% had to take paid leave. Almost double this figure (7%) had to take unpaid leave. Higher rates of unpaid leave verses paid leave are reflected throughout both genders, all age groups and regions. Higher rates of males have had to take leave (either paid or unpaid) than that of the female population. The highest rates of leave (either paid or unpaid) are seen in the 55-64 age group. See table 2c and Figure 4.
| Table 2(c) Percentage of persons aged 15 years and over by effect of COVID-19 on paid and unpaid leave1, April 20202 | |||
| % | |||
| Effect on Paid and Unpaid Leave | |||
| Had to take paid leave | Had to take unpaid leave | ||
| State | 4 | 7 | |
| Sex | |||
| Male | 5 | 8 | |
| Female | 3 | 7 | |
| Age Group | |||
| 15-24 | 1 | 8 | |
| 25-34 | 2 | 9 | |
| 35-44 | 6 | 5 | |
| 45-54 | 4 | 4 | |
| 55-64 | 6 | 13 | |
| 65+ | 4 | 11 | |
| Region(NUTS2) | |||
| Northern and Western | 3 | 8 | |
| Southern | 3 | 9 | |
| Eastern and Midland | 5 | 7 | |
| 1 Figures in this table are calculated from the 47% of population whose employment was affected by COVID-19 | |||
| 2 Results are based on a sample of persons aged 15 and over from weeks 1, 2 and 3 of the Q2 2020 Labour Force Survey | |||
| Note: The survey allowed for multiple responses to the question relating to life effects due to COVID19 for this reason percentages will not add to 100%. | |||
| Had to take paid leave | Had to take unpaid leave | |
| Male | 5 | 8 |
| Female | 3 | 7 |
| 15-24 | 1 | 8 |
| 25-34 | 2 | 9 |
| 35-44 | 6 | 5 |
| 45-54 | 4 | 4 |
| 55-64 | 6 | 13 |
| 65+ | 4 | 11 |
Of those that indicated that the COVID-19 pandemic had an effect on their employment situation, 23% of persons aged 15 years and over have had a change in their work hours, while only 5% have changed their business model to online or takeaway. The most change in work hours is experienced by those aged 65 and over, while changes to their business model to online or takeaway is mostly experienced by the 45-54 age group. See table 2d.
| Table 2(d) Percentage of persons aged 15 years and over by effect of COVID-19 on change of work hours and work model1, April 20202 | |||
| % | |||
| Effect on Work Model and Hours | |||
| Change of work hours | Changed business model to online or takeaway | ||
| State | 23 | 5 | |
| Sex | |||
| Male | 23 | 5 | |
| Female | 22 | 6 | |
| Age Group | |||
| 15-24 | 14 | 3 | |
| 25-34 | 15 | 4 | |
| 35-44 | 27 | 5 | |
| 45-54 | 27 | 9 | |
| 55-64 | 22 | 6 | |
| 65+ | 28 | 5 | |
| Region(NUTS2) | |||
| Northern and Western | 22 | 4 | |
| Southern | 20 | 4 | |
| Eastern and Midland | 24 | 6 | |
| 1 Figures in this table are calculated from the 47% of population whose employment was affectted by COVID-19 | |||
| 2 Results are based on a sample of persons aged 15 and over from weeks 1, 2 and 3 of the Q2 2020 Labour Force Survey | |||
| Note: The survey allowed for multiple responses to the question relating to life effects due to COVID19 for this reason percentages will not add to 100%. | |||
94% of the population aged 15 years and over whose employment situation was affected by COVID-19 in that they lost their employment, were temporarily laid off, are on paid leave or unpaid leave expect to return to the same job after the lifting of restrictions. A small percentage, 5% do not expect to return to the same job. In general, older people are more confident of returning to their same job, but all age groups report high levels here. See Table 3.
| Table 3 Percentage of persons aged 15 years and over by whether they expect to return to their same job1 after restrictions due to COVID-19 are removed, April 20202 | |||||
| % | |||||
| Expect to return to same job after restrictions | |||||
| Yes, expect to return to same job | Yes, have already returned to same job | No | |||
| State | 94 | 1 | 5 | ||
| Sex | |||||
| Male | 93 | 2 | 5 | ||
| Female | 95 | 0 | 5 | ||
| Age Group | |||||
| 15-24 | 91 | 0 | 9 | ||
| 25-34 | 90 | 2 | 8 | ||
| 35-44 | 97 | 2 | 1 | ||
| 45-54 | 97 | 0 | 3 | ||
| 55-64 | 97 | 0 | 3 | ||
| 65+ | * | * | * | ||
| Region(NUTS2) | |||||
| Northern and Western | 98 | 0 | 2 | ||
| Southern | 94 | 1 | 4 | ||
| Eastern and Midland | 93 | 1 | 6 | ||
| 1 Figures in this table are based on the population who lost their employment, are temporarily laid off, are on paid leave or unpaid leave. | |||||
| 2 Results are based on a sample of persons aged 15 and over from weeks 1, 2 and 3 of the Q2 2020 Labour Force Survey | |||||
| * Sample occurance too small for estimation. | |||||
In this section, we examine and present findings on the life effects experienced by the population aged 15 years and over which have arisen due to the COVID-19 pandemic. These life effects encompass a broad range of life experiences from feeling of loneliness, to money worries, to fears around shopping in person.
Note, respondents may have selected more than one of the answer options presented within tables 4a-4d. For this reason percentages will not add to 100%.
There are more people working from home now, and this can bring challenges. Over a fifth (22%) of the age group 35-44 years experience difficulties in working from home with their family around, with difficulties declining as the age groups get older from the 35-44 age group. No paid work is the lowest concern for the older age group (65+) as only 5% of this age group are affected. These difficulties are most pronounced for younger age groups which are most affected by the unavailability of paid work, with over a fifth (21%) of this age group experiencing this particular life effect. A higher percentage of males have been affected by no paid work than females, while a higher percentage of females find it more difficult to work from home with family around than men. There is little regional variation in the life effects being experienced by persons aged 15 years and over regarding the availability of paid work and the difficulties in working from home with family around. See Table 4a and Figure 5.
| Table 4(a) Percentage of persons aged 15 years and over by effect of COVID-19 on paid work, April 20201 | |||
| % | |||
| Effect on Paid Work | |||
| No paid work | Difficult to work from home with family around | ||
| State | 15 | 10 | |
| Sex | |||
| Male | 18 | 9 | |
| Female | 13 | 11 | |
| Age Group | |||
| 15-24 | 21 | 10 | |
| 25-34 | 18 | 7 | |
| 35-44 | 16 | 22 | |
| 45-54 | 16 | 15 | |
| 55-64 | 16 | 3 | |
| 65+ | 5 | 2 | |
| Region(NUTS2) | |||
| Northern and Western | 16 | 11 | |
| Southern | 16 | 10 | |
| Eastern and Midland | 14 | 10 | |
| 1 Results are based on a sample of persons aged 15 and over from weeks 1, 2 and 3 of the Q2 2020 Labour Force Survey | |||
| Note: The survey allowed for multiple responses to the question relating to life effects due to COVID19 for this reason percentages will not add to 100%. | |||
| Type of device used | No paid work | Difficult to work from home with family around |
|---|---|---|
| Male | 18 | 9 |
| Female | 13 | 11 |
Females are experiencing loneliness and fear to go shopping more than men, with 27% of females feeling lonely (compared to 20% of men) and almost a third (32%) of females saying they are afraid to go shopping (compared to a 20% of men). Men exhibit marginally more money worries than females (18% to 17%). See Table 4b.
The oldest age group (persons aged 65 years and over) are experiencing the most loneliness (30%) and fears around shopping (41%). The youngest age group (15-24 years) report the second highest feelings of loneliness at 27%. This age group report the least fears around shopping. See Table 4b.
| Table 4(b) Percentage of persons aged 15 years and over by effect of COVID-19 on emotional wellbeing, April 20201 | ||||
| % | ||||
| Effect on Emotional Wellbeing | ||||
| Money worries | Feeling lonely | Afraid to go shopping | ||
| State | 17 | 24 | 26 | |
| Sex | ||||
| Male | 18 | 20 | 20 | |
| Female | 17 | 27 | 32 | |
| Age Group | ||||
| 15-24 | 12 | 27 | 16 | |
| 25-34 | 20 | 23 | 21 | |
| 35-44 | 27 | 20 | 24 | |
| 45-54 | 22 | 19 | 26 | |
| 55-64 | 15 | 23 | 27 | |
| 65+ | 5 | 30 | 41 | |
| Region(NUTS2) | ||||
| Northern and Western | 18 | 23 | 32 | |
| Southern | 17 | 23 | 27 | |
| Eastern and Midland | 17 | 24 | 24 | |
| 1 Results are based on a sample of persons aged 15 and over from weeks 1, 2 and 3 of the Q2 2020 Labour Force Survey. | ||||
| Note: The survey allowed for multiple responses to the question relating to life effects due to COVID19 for this reason percentages will not add to 100%. | ||||
In the population aged 15 years and over, low levels of the population report financial difficulties as a consequence of the COVID-19 pandemic, with 3% of the population aged 15 years and over reporting that they are unable to pay bills, 5% deferring bills and 2% reporting rent or mortgage payment difficulties. The age groups from 35-44 to 55-64 years all report the highest rates for the deferring of bills and rent and mortgage payment difficulties. See Table 4c.
| Table 4(c) Percentage of persons aged 15 years and over by effect of COVID-19 on their finances, April 20201 | |||||
| % | |||||
| Effect on Finances | |||||
| Unable to pay bills | Had to defer bills | Couldn’t pay rent or mortgage | |||
| State | 3 | 5 | 2 | ||
| Sex | |||||
| Male | 4 | 5 | 2 | ||
| Female | 3 | 5 | 2 | ||
| Age Group | |||||
| 15-24 | 2 | 1 | 1 | ||
| 25-34 | 4 | 5 | 2 | ||
| 35-44 | 5 | 7 | 4 | ||
| 45-54 | 4 | 7 | 4 | ||
| 55-64 | 5 | 7 | 2 | ||
| 65+ | 2 | 2 | 0 | ||
| Region(NUTS2) | |||||
| Northern and Western | 4 | 5 | 2 | ||
| Southern | 4 | 6 | 3 | ||
| Eastern and Midland | 3 | 4 | 2 | ||
| 1 Results are based on a sample of persons aged 15 and over from weeks 1, 2 and 3 of the Q2 2020 Labour Force Survey. | |||||
| Note: The survey allowed for multiple responses to the question relating to life effects due to COVID19 for this reason percentages will not add to 100%. | |||||
18% of the population (aged 15 and over) are caring for a dependent family member or friend because of the COVID-19 pandemic. More females (21%) than men (15%) are caring for a dependent family member or friend, with persons in the 45-54 age group reporting the highest rates for caring (31%) as a result of COVID-19. See Table 4d and Figure 6.
The measures introduced as a response to the COVID-19 pandemic include more staying at home and less face to face family visits. The COVID-19 pandemic has resulted in almost 60% of the population aged 15 years and over having increased contact with family via telephone, Skype, Face Time etc. This life effect of the COVID-19 pandemic is the one reported by the population aged 15 years and over as the highest life effect experienced The rates of this effect increase with age, with two-thirds of the population aged 65 years and over experiencing this increased family contact via telephone and internet, as compared to just under half of 15-24 year olds. See Table 4d.
Almost half (46%) of the population have increased positive family time. The lowest rates of increased positive family time are experienced by the 65+ age group. See Table 4d.
With schools closed, childcare issues can be a significant life effect arising from the COVID-19 pandemic. Almost a quarter (24%) of persons aged 35-44 reported experiencing childcare issues, with more females than men experiencing this life effect. See Table 4d.
| Table 4(d) Percentage of persons aged 15 years and over by effect of COVID-19 on family life, April 20201 | |||||||
| % | |||||||
| Effect on Family Life | |||||||
| Childcare issues | Caring for dependent family/friend | More contact with family by telephone, Skype, Facetime,etc | Increased positive family time | ||||
| State | 7 | 18 | 59 | 46 | |||
| Sex | |||||||
| Male | 6 | 15 | 55 | 44 | |||
| Female | 9 | 21 | 62 | 47 | |||
| Age Group | |||||||
| 15-24 | 1 | 4 | 48 | 52 | |||
| 25-34 | 7 | 11 | 51 | 39 | |||
| 35-44 | 24 | 30 | 60 | 54 | |||
| 45-54 | 7 | 31 | 62 | 54 | |||
| 55-64 | 1 | 21 | 63 | 46 | |||
| 65+ | 2 | 9 | 67 | 29 | |||
| Region(NUTS2) | |||||||
| Northern and Western | 9 | 19 | 54 | 48 | |||
| Southern | 6 | 17 | 60 | 45 | |||
| Eastern and Midland | 8 | 19 | 60 | 45 | |||
| 1 Results are based on a sample of persons aged 15 and over from weeks 1, 2 and 3 of the Q2 2020 Labour Force Survey. | |||||||
| Note: The survey allowed for multiple responses to the question relating to life effects due to COVID19 for this reason percentages will not add to 100%. | |||||||
| Type of device used | Childcare issues | Caring for dependent family/friend | More contact with family by telephone, Skype, Face Time,etc | Increased positive family time |
|---|---|---|---|---|
| Male | 6 | 15 | 55 | 44 |
| Female | 9 | 21 | 62 | 47 |
The Labour Force Survey and COVID19
The CSO introduced a special module of questions into the Labour Force Survey (LFS) for Q2 2020 to provide insight into the effects of COVID19 on people’s employment situation and their general wellbeing. The questions (see below) are being asked of all respondents throughout the survey and is not confined to a specific reference week as is usually the case with Labour Force Survey.
Purpose of the LFS
The purpose of the LFS is the production of quarterly labour force estimates and occasional reports on special social topics. The survey meets the requirements of Council Regulation (EC) No. 577/98, adopted in March 1998, which requires the introduction of quarterly labour force surveys in EU member states.
Reference period
Information is collected continuously throughout the year from households surveyed each week in each quarter. The LFS is undertaken on a calendar quarter basis.
The reference quarters for survey results are:
Q1 - January to March, Q2 - April to June, Q3 - July to September and Q4 - October to December
The results presented in this release are based on responses provided in the first three weeks of data collection for Q2 2020 and is based on those who responded to this special module.
Data Collection
The LFS is generally conducted using mixed mode data collection with the introduction of Computer Assisted Telephone Interviewing (CATI). Information is collected from each sample household over 5 successive quarters or Waves. In the LFS, the first interview is conducted by a team of face-to-face interviewers using Computer Assisted Personal Interviewing (CAPI). The four follow-up interviews are conducted using CATI from a dedicated call centre, where householders have agreed to conduct a telephone interview, and are conducted using face-to-face interviews where householders have not agreed to conduct a telephone interview.
Changes to data collection resulting from COVID19
In line with HSE guidelines, all CAPI operations ceased for Q2 and field staff are now carrying out household interviews by phone where possible.
The LFS module on COVID19 -survey questions
Questionnaire:
Was your employment situation affected by COVID-19?
Note, this question relates to Table 1 of the release.
How was your employment status or situation affected by COVID-19: ( if previous question was “1. Yes” then Select all that apply)
1 Loss of employment
2 Temporary layoff
3 Started new job
4 Change in work hours
5 Started remote working from home
6 Increased number of hours remote working from home
7 Was unable to work as business was unable to offer the facility of remote working
8 Was unable to work as work was not suitable for remote working
9 Had to take paid leave
10 Had to take unpaid leave
11 Changed business model to online/takeaway model
12 Unable to start new job
13 Other
Note, this question relates to Tables 2a, 2b, 2c and 2d of the release.
Do you expect to return to the same job[after the COVID-19 restrictions are removed] or have you already returned to the same job?
1 Yes, expect to return to same job
2 Yes, have already returned to same job
3 No
Note, this question relates to Table 3 of the release.
Which of the following has affected your life since the start of COVID-19? (Select all that apply)
1 No paid work
2 Childcare issues
3 Health worries
4 Money worries
5 Feeling lonely
6 Caring for dependent family/friends
7 Afraid to go shopping
8 Increased positive family time
9 More contact with family by telephone, skype, FaceTime, etc.
10 Difficult to work from home with family around
11 Unable to pay bills
12 Had to defer bills
13 Couldn't pay rent or mortgage
14 Other
15 None
Note, this question relates to Tables 4a, 4b, 4c and 4d of the release.
The current LFS sample which is based on the 2016 Census of Population was introduced on a phased basis (over five quarters) from Q2 2019 and is now fully operational. The sample is stratified using administrative county and the Pobal HP (Haase and Pratschke) Deprivation Index. A two-stage sample design is used. In the first stage 1,300 blocks were selected using Probability Proportional to Size (PPS) sampling. In the second stage households are selected using Simple Random Sampling (SRS). This ensured each household in the sample frame has an equal probability of selection. The actual achieved sample varied over time depending on the level of response.
Households are asked to take part in the survey for five consecutive quarters and are then replaced by other households in the same block. Thus, one fifth of the households in the survey are replaced each quarter and the LFS sample involves an overlap of 80% between consecutive quarters and 20% between the same quarter in consecutive years.
The survey results are weighted to agree with population estimates broken down by age, sex and region and are also calibrated to nationality control totals. The LFS results also contain a non-response adjustment to make the results from the achieved sample representative of the target sample and the population. The population estimates for April of each year are published in a separate release.
This release is based on the achieved sample of 2,288 respondents gathered over the first 3 weeks of the Labour Force Survey for Q2 2020. The survey was weighted by age, sex and NUTS2 region, to agree with the most up to date population estimates available (Q4 2019). Please note, due to this, additional figures relating to Q2 2020 to be published in the coming months will not be directly comparable. Details of the sample and weighted proportions can be seen in the following table:
Details of sample and weighted proportions of COVID-19 Module
|
Q4 2019 (Grossed) |
Q2 2020 (COVID-19 Sample) |
Q2 2020 (Weighted by age, Sex and Region) | |
|---|---|---|---|
| State | 100 | 100 | 100 |
| Sex | |||
| Male | 49 | 49 | 49 |
| Female | 51 | 51 | 51 |
| Age Groups | |||
| 15-24 | 16 | 14 | 16 |
| 25-34 | 16 | 11 | 16 |
| 35-44 | 20 | 19 | 20 |
| 45-54 | 17 | 17 | 17 |
| 55-64 | 14 | 20 | 14 |
| 65+ | 18 | 18 | 18 |
| Region (NUTS2) | |||
| Northern and Western | 18 | 15 | 18 |
| Southern | 33 | 35 | 33 |
| Eastern and Midland | 49 | 50 | 49 |
Estimates for percentage share of persons where there are less than 30 persons in a cell are too small to be considered reliable. These estimates are presented with an asterisk (*) in the relevant tables.
Where there are 30-49 persons in a cell, estimates are considered to have a wider margin of error and should be treated with caution. These cells are presented with parentheses [ ].
The Nomenclature of Territorial Units for Statistics (NUTS) were created by Eurostat in order to define territorial units for the production of regional statistics across the European Union. In 2003 the NUTS classification was established within a legal framework (Regulation (EC) No 1059/2003).
As the administrative territorial breakdown of EU Member States is the basis of the NUTS classification, changes made under the 2014 Local Government Act prompted a revision to the Irish NUTS 2 and NUTS 3 Regions. These changes included the amalgamation of the local authorities of Tipperary North and South, Limerick City and County Councils and Waterford City and County Councils. In addition three Regional Assemblies were established (Northern & Western, Southern, Eastern & Midland).
The main changes at NUTS 3 level are the transfer of South Tipperary from the South-East into the Mid-West NUTS 3 region and the movement of Louth from the Border to the Mid-East NUTS 3 Region. There are now three NUTS 2 Regions which correspond to the Regional Assemblies established in the 2014 Local Government Act and are groupings of the new NUTS 3 Regions. The revisions made to the NUTS boundaries have been given legal status under Commission Regulation (EU) 2016/2066. The new NUTS 2 and NUTS 3 structure and classification are displayed in the table below:
NUTS2 Code |
NUTS 2 Name |
NUTS3 Code |
NUTS 3 Name |
County |
IE04 |
Northern & Western |
IE041 |
Border |
Donegal |
Sligo |
||||
Leitrim |
||||
Cavan |
||||
Monaghan |
||||
IE042 |
West |
Galway |
||
Mayo |
||||
Roscommon |
||||
IE05 |
Southern |
IE051 |
Mid-West |
Clare |
Tipperary |
||||
Limerick |
||||
IE052 |
South-East |
Waterford |
||
Kilkenny |
||||
Carlow |
||||
Wexford |
||||
IE053 |
South-West |
Cork |
||
Kerry |
||||
IE06 |
Eastern & Midland |
IE061 |
Dublin |
Dublin |
IE062 |
Mid-East |
Wicklow |
||
Kildare |
||||
Meath |
||||
Louth |
||||
IE063 |
Midlands |
Longford |
||
Westmeath |
||||
Offaly |
||||
Laois |
The Central Statistics Office as always, wishes to thank the participating households for their co-operation in agreeing to take part in the survey and for facilitating the collection of the relevant data.
 Hide Background Notes
Scan the QR code below to view this release online or go to
http://www.cso.ie/en/releasesandpublications/er/elec19/employmentandlifeeffectsofcovid-19/
 Show Table 1 Percentage of persons aged 15 years and over by effect of COVID-19 on employment, April 2020
 Hide Table 1 Percentage of persons aged 15 years and over by effect of COVID-19 on employment, April 2020