
| Greenhouse Gas Emissions by Sector | ||||||||||
| '000 tonnes CO2 equivalent | ||||||||||
| NACE Sector | 2011 | 2012 | 2013 | 2014 | 2015 | 2014-2015 % change | ||||
| Agriculture, Forestry and Fishing | 18,670 | 18,987 | 19,757 | 19,625 | 19,947 | 1.6 | ||||
| Industry | 19,033 | 19,952 | 18,773 | 19,238 | 20,302 | 5.5 | ||||
| Services | 6,240 | 6,030 | 6,026 | 6,222 | 6,395 | 2.8 | ||||
| Households | 13,630 | 13,159 | 13,370 | 12,677 | 13,236 | 4.4 | ||||
| Total | 57,567 | 58,124 | 57,922 | 57,758 | 59,878 | 3.7 | ||||
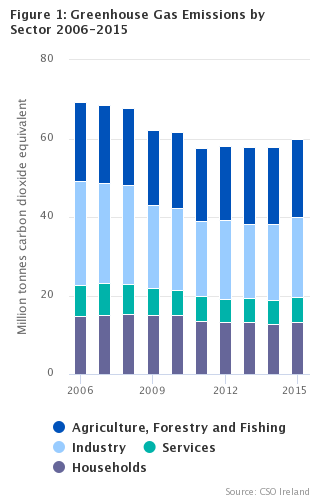
In 2015 greenhouse gas emissions by the industry sector constituted 33.9% of total greenhouse gas emissions while emissions by the agriculture, forestry and fishing sector were 33.3% of the total.
The household sector was the third-largest emitter of greenhouse gases at 22.1% of the total and the remaining 10.7% of emissions originated with the services sector (see Figure 1 and Table 1).
Agriculture, Forestry and Fishing
Emissions from agriculture, forestry and fishing increased by 1.6% from 2014 to 2015. Data for 2006 to 2015 are shown in Table 1 and the trend can be seen in Figure 2. During this period there was an overall reduction in agriculture, forestry and fishing emissions of 1.1%. From 2006 to 2011 emissions from this sector generally fell, reaching a low in 2011 of 18.7 million tonnes of carbon dioxide equivalent. Emissions increased from 2012 onwards and in 2015 reached 19.9 million tonnes of carbon dioxide equivalent.
Industry
Greenhouse gas emissions by the industry sector increased by 5.5% on the previous year in 2015. However industry emissions fell by 23.0% from 2006 to 2015, largely as a result of a reduction in emissions from the electricity and gas supply industry (see Table 1). Emissions from industry were at their lowest in 2013 at 18.8 million tonnes of carbon dioxide equivalent, while 20.3 million tonnes of carbon dioxide equivalent were released into the atmosphere as a result of industrial activity in 2015.
Services
Emissions by the services sector increased by 2.8% on 2014 emissions to 6.4 million tonnes of carbon dioxide equivalent. The services sector was the source of between 10% and 12% of total greenhouse gas emissions for each of the ten years from 2006 to 2015. There was a 20.2% decrease in emissions from this sector over the ten-year period.
Households
Household emissions of greenhouse gases rose by 4.4% from 2014 to 2015 when 13.2 million tonnes of carbon dioxide equivalent were emitted due to household activities such as transport and heating. Emissions from households fell by 10.3% from 2006 to 2015. The trend in emissions from the household sector can also be seen in Figure 2.
| Year | Agriculture, Forestry and Fishing | Industry | Services | Households |
|---|---|---|---|---|
| 2006 | 20.1788777279834 | 26.369266670606 | 8.01708500490237 | 14.7480238645324 |
| 2007 | 19.788924755333 | 25.6030540037189 | 8.22132944768727 | 14.9343662367231 |
| 2008 | 19.6617272411358 | 25.3711283749005 | 7.44315950392476 | 15.4123576307342 |
| 2009 | 19.3087275320703 | 21.1022919768783 | 6.84680423124852 | 14.9891940800676 |
| 2010 | 19.310269717295 | 20.9508846136128 | 6.45460511842762 | 14.9816684363539 |
| 2011 | 18.6704321857542 | 19.0332066381861 | 6.23991880664614 | 13.6300004350262 |
| 2012 | 18.9874308702638 | 19.952433870362 | 6.03006025431413 | 13.159423571918 |
| 2013 | 19.7569001367291 | 18.7733141329014 | 6.02593987987317 | 13.3704194745698 |
| 2014 | 19.6254405707689 | 19.2380171807851 | 6.2219157438826 | 12.677390122007 |
| 2015 | 19.9473596105315 | 20.302331106794 | 6.39494049289068 | 13.2360901071064 |
Sulphur dioxide emissions decreased by 9.0% in 2015, while emissions of nitrogen oxides increased by 3.6% (see Tables 5 and 6). In the period from 2006 to 2015 sulphur dioxide emissions fell by 72.0% and nitrogen oxide emissions by 40.1%.
Ammonia emissions increased by 2.0% from 2014 to 2015 and emissions of non-methane volatile organic compounds (NMVOCs) increased by 1.8% (see Tables 7 and 8).
Carbon monoxide emissions fell by 2.6% in 2015 and by 45.4% between 2006 and 2015 (see Table 9).
Emissions of fine particulate matter (PM2.5) decreased by 1.1% from 2014 to 2015, while larger particulate matter (PM10) emissions fell by 0.7% (see Tables 10 and 11).
| Air pollutant | Percentage change 2014-2015 |
|---|---|
| Sulphur dioxide | -9.02838899935304 |
| Nitrogen oxides | 3.57220655619152 |
| Ammonia | 2.01208896842243 |
| NMVOCs | 1.78005434831188 |
| Carbon monoxide | -2.64205639843719 |
| PM2.5 | -1.11748525293431 |
| PM10 | -0.653322305393577 |
The NACE sector distribution of air emissions of each of the seven pollutants presented in this release is shown in Figure 4.
Industry activities were the source of 58.7% of sulphur dioxide emissions in 2015, while just over 60% of emissions of carbon monoxide and fine particulate matter (PM2.5) were produced by households, and over 40% of NMVOC and PM10 emissions came from the agriculture, forestry and fishing sector.
The agriculture, forestry and fishing sector also produced 98.8% of ammonia emissions in 2015.
All sectors contributed emissions of nitrogen oxides with 37.9% arising from the services sector.
| Agriculture, Forestry and Fishing | Industry | Services | Households | |
| Sulphur dioxide | 0.388535067969534 | 58.7346380912953 | 2.4969233648464 | 38.3799034758888 |
| Carbon monoxide | 1.30305597465748 | 27.3808713277928 | 10.2429467551431 | 61.0731259424066 |
| PM2.5 | 16.8627600418166 | 14.6448821354669 | 8.29502298620828 | 60.1973348365082 |
| Nitrogen oxides | 7.54117696161946 | 30.2107072671793 | 37.8830686931387 | 24.3650470780625 |
| NMVOCs | 42.8056887003071 | 28.4045637881909 | 4.41500376204162 | 24.3747437494604 |
| PM10 | 46.3063702285621 | 10.0238841212221 | 6.36633782246597 | 37.3034078277499 |
| Ammonia | 98.8378461412685 | 0.262918559706808 | 0.0973471018844793 | 0.801888197140181 |
The national emissions inventories produced annually by the Environmental Protection Agency present emissions of greenhouse gases and air pollutants according to the territorial principle, i.e. they include emissions originating from the geographic territory of Ireland.
Air emissions accounts, are compiled according to national accounts principles. They record emissions arising from the activities of resident units of Ireland, regardless of where these emissions occur geographically. The data presented in the headline table and in Tables 1-13 are territorial emissions, while provisional data on residence principle emissions are shown in Table 14. Further information is provided in the background notes to this release.
| Table 1 Greenhouse Gas Emissions (CO2, N2O, CH4, HFC, PFC, SF6, NF3) by NACE Sector | '000 tonnes CO2 equivalent | ||||||||||||
| NACE Rev. 2 | 2006 | 2007 | 2008 | 2009 | 2010 | 2011 | 2012 | 2013 | 2014 | 2015 | |||
| Agriculture, Forestry and Fishing (01-03) | 20,179 | 19,789 | 19,662 | 19,309 | 19,310 | 18,670 | 18,987 | 19,757 | 19,625 | 19,947 | |||
| Industry (05-43) | 26,369 | 25,603 | 25,371 | 21,102 | 20,951 | 19,033 | 19,952 | 18,773 | 19,238 | 20,302 | |||
| Mining and quarrying (05-09) | 387 | 371 | 339 | 282 | 226 | 214 | 203 | 226 | 245 | 229 | |||
| Food products, beverages and tobacco products (10-12) | 1,486 | 1,429 | 1,436 | 1,349 | 1,280 | 1,116 | 1,082 | 1,198 | 1,192 | 1,195 | |||
| Textiles, wearing apparel and leather products (13-15) | 22 | 19 | 19 | 18 | 14 | 6 | 5 | 10 | 9 | 10 | |||
| Wood and paper products and printing (16-18) | 122 | 116 | 110 | 96 | 96 | 50 | 61 | 85 | 83 | 87 | |||
| Coke and refined petroleum products (19) | 378 | 361 | 368 | 316 | 311 | 286 | 314 | 295 | 280 | 359 | |||
| Chemicals and chemical products (20) | 252 | 226 | 144 | 89 | 95 | 94 | 109 | 135 | 119 | 129 | |||
| Basic pharmaceutical products and pharmaceutical preparations (21) | 261 | 228 | 294 | 310 | 276 | 255 | 254 | 240 | 232 | 251 | |||
| Rubber and plastic products and other non-metallic mineral products (22-23) | 4,623 | 4,734 | 4,215 | 2,750 | 2,408 | 2,145 | 2,486 | 2,407 | 2,967 | 3,195 | |||
| Basic metals and fabricated metal products, except machinery and equipment (24-25) | 1,496 | 1,578 | 1,579 | 1,255 | 1,562 | 1,528 | 1,507 | 1,482 | 1,484 | 1,496 | |||
| Computer, electronic and optical products (26) | 412 | 451 | 454 | 344 | 248 | 132 | 127 | 138 | 122 | 157 | |||
| Electrical equipment (27) | 82 | 87 | 59 | 46 | 49 | 42 | 42 | 49 | 52 | 48 | |||
| Machinery and equipment not elsewhere classified (28) | 48 | 52 | 77 | 64 | 91 | 60 | 58 | 65 | 64 | 65 | |||
| Transport equipment (29-30) | 29 | 31 | 24 | 26 | 19 | 10 | 11 | 12 | 11 | 12 | |||
| Furniture; other manufacturing; repair and installation of machinery and equipment (31-33) | 222 | 190 | 201 | 177 | 174 | 117 | 124 | 135 | 131 | 138 | |||
| Electricity, gas, steam and air conditioning supply (35) | 14,582 | 14,106 | 14,201 | 12,652 | 12,932 | 11,572 | 12,302 | 10,887 | 10,701 | 11,254 | |||
| Water supply; sewerage, waste management and remediation activities (36-39) | 1,317 | 927 | 1,312 | 943 | 816 | 793 | 741 | 893 | 1,073 | 1,186 | |||
| Construction (41-43) | 651 | 696 | 538 | 386 | 354 | 612 | 527 | 516 | 473 | 491 | |||
| Services (45-96) | 8,017 | 8,221 | 7,443 | 6,847 | 6,455 | 6,240 | 6,030 | 6,026 | 6,222 | 6,395 | |||
| Households | 14,748 | 14,934 | 15,412 | 14,989 | 14,982 | 13,630 | 13,159 | 13,370 | 12,677 | 13,236 | |||
| Total greenhouse gas emissions | 69,311 | 68,546 | 67,883 | 62,240 | 61,692 | 57,567 | 58,124 | 57,922 | 57,758 | 59,878 | |||
| Table 2 Carbon Dioxide (CO2) Emissions | '000 tonnes C02 | ||||||||||||
| NACE Rev. 2 | 2006 | 2007 | 2008 | 2009 | 2010 | 2011 | 2012 | 2013 | 2014 | 2015 | |||
| Agriculture, Forestry and Fishing (01-03) | 1,438 | 1,472 | 1,396 | 1,298 | 1,358 | 1,242 | 1,073 | 1,308 | 1,095 | 1,088 | |||
| Industry (05-43) | 24,398 | 24,051 | 24,056 | 20,041 | 19,929 | 17,938 | 18,952 | 17,572 | 17,812 | 18,785 | |||
| Mining and quarrying (05-09) | 358 | 324 | 297 | 256 | 202 | 190 | 179 | 203 | 212 | 198 | |||
| Food products, beverages and tobacco products (10-12) | 1,314 | 1,258 | 1,291 | 1,189 | 1,121 | 953 | 921 | 1,005 | 976 | 1,011 | |||
| Textiles, wearing apparel and leather products (13-15) | 22 | 19 | 19 | 18 | 14 | 6 | 5 | 10 | 9 | 10 | |||
| Wood and paper products and printing (16-18) | 121 | 115 | 109 | 95 | 94 | 50 | 60 | 84 | 82 | 86 | |||
| Coke and refined petroleum products (19) | 377 | 360 | 367 | 315 | 310 | 285 | 313 | 294 | 279 | 358 | |||
| Chemicals and chemical products (20) | 251 | 225 | 144 | 89 | 94 | 94 | 108 | 134 | 119 | 128 | |||
| Basic pharmaceutical products and pharmaceutical preparations (21) | 260 | 227 | 293 | 308 | 275 | 254 | 253 | 239 | 231 | 250 | |||
| Rubber and plastic products and other non-metallic mineral products (22-23) | 4,610 | 4,721 | 4,202 | 2,740 | 2,398 | 2,136 | 2,476 | 2,397 | 2,955 | 3,183 | |||
| Basic metals and fabricated metal products, except machinery and equipment (24-25) | 1,492 | 1,574 | 1,575 | 1,252 | 1,558 | 1,524 | 1,505 | 1,479 | 1,481 | 1,494 | |||
| Computer, electronic and optical products (26) | 161 | 210 | 271 | 234 | 178 | 90 | 95 | 102 | 97 | 106 | |||
| Electrical equipment (27) | 52 | 58 | 35 | 19 | 22 | 15 | 14 | 16 | 15 | 16 | |||
| Machinery and equipment not elsewhere classified (28) | 38 | 42 | 66 | 56 | 82 | 52 | 49 | 55 | 53 | 55 | |||
| Transport equipment (29-30) | 29 | 31 | 24 | 25 | 18 | 9 | 11 | 11 | 11 | 12 | |||
| Furniture; other manufacturing; repair and installation of machinery and equipment (31-33) | 192 | 160 | 188 | 161 | 159 | 94 | 107 | 115 | 110 | 117 | |||
| Electricity, gas, steam and air conditioning supply (35) | 14,411 | 13,932 | 14,005 | 12,466 | 12,745 | 11,404 | 12,135 | 10,736 | 10,553 | 11,113 | |||
| Water supply; sewerage, waste management and remediation activities (36-39) | 98 | 140 | 664 | 463 | 336 | 206 | 230 | 216 | 197 | 194 | |||
| Construction (41-43) | 612 | 657 | 507 | 353 | 321 | 576 | 492 | 475 | 430 | 453 | |||
| Services (45-96) | 7,569 | 7,764 | 7,021 | 6,396 | 6,004 | 5,780 | 5,577 | 5,514 | 5,670 | 5,896 | |||
| Households | 14,081 | 14,288 | 14,779 | 14,334 | 14,340 | 13,005 | 12,542 | 12,729 | 12,056 | 12,624 | |||
| Total carbon dioxide emissions | 47,485 | 47,576 | 47,252 | 42,069 | 41,630 | 37,965 | 38,144 | 37,123 | 36,633 | 38,393 | |||
| Table 3 Nitrous Oxide (N2O) Emissions | '000 tonnes N2O | |||||||||||
| NACE Rev. 2 | 2006 | 2007 | 2008 | 2009 | 2010 | 2011 | 2012 | 2013 | 2014 | 2015 | ||
| Agriculture, Forestry and Fishing (01-03) | 22.5 | 21.8 | 21.8 | 21.6 | 22.2 | 20.8 | 21.1 | 22.4 | 22.2 | 22.3 | ||
| Industry (05-43) | 0.8 | 0.9 | 1.0 | 0.9 | 1.0 | 0.9 | 0.9 | 0.9 | 0.9 | 0.9 | ||
| Services (45-96) | 0.3 | 0.3 | 0.3 | 0.3 | 0.3 | 0.3 | 0.3 | 0.3 | 0.3 | 0.3 | ||
| Households | 0.5 | 0.4 | 0.3 | 0.3 | 0.3 | 0.3 | 0.3 | 0.3 | 0.3 | 0.3 | ||
| Total nitrous oxide emissions | 24.1 | 23.5 | 23.5 | 23.2 | 23.7 | 22.3 | 22.6 | 23.9 | 23.7 | 23.8 | ||
| Table 4 Methane (CH4) Emissions | '000 tonnes CH4 | |||||||||||||
| NACE Rev. 2 | 2006 | 2007 | 2008 | 2009 | 2010 | 2011 | 2012 | 2013 | 2014 | 2015 | ||||
| Agriculture, Forestry and Fishing (01-03) | 481.7 | 472.4 | 470.3 | 463.0 | 453.9 | 448.9 | 464.4 | 471.0 | 477.0 | 488.9 | ||||
| Industry (05-43) | 47.7 | 31.0 | 24.7 | 16.7 | 16.2 | 20.0 | 16.7 | 22.8 | 30.6 | 34.2 | ||||
| Water supply; sewerage, waste management and remediation activities (36-39) | 43.8 | 26.4 | 20.7 | 13.5 | 13.2 | 17.3 | 14.2 | 20.5 | 28.1 | 31.8 | ||||
| Other industry | 4.0 | 4.6 | 4.0 | 3.2 | 3.0 | 2.7 | 2.5 | 2.3 | 2.5 | 2.3 | ||||
| Services (45-96) | 0.6 | 0.6 | 0.6 | 0.6 | 0.6 | 0.6 | 0.6 | 0.6 | 0.7 | 0.5 | ||||
| Households | 8.5 | 8.1 | 8.5 | 9.0 | 8.6 | 7.9 | 7.7 | 8.1 | 7.0 | 7.0 | ||||
| Total methane emissions | 538.5 | 512.1 | 504.2 | 489.3 | 479.2 | 477.5 | 489.4 | 502.6 | 515.3 | 530.5 | ||||
| Table 5 Sulphur Dioxide (SO2) Emissions | '000 tonnes SO2 | ||||||||||||||
| NACE Rev. 2 | 2006 | 2007 | 2008 | 2009 | 2010 | 2011 | 2012 | 2013 | 2014 | 2015 | |||||
| Agriculture, Forestry and Fishing (01-03) | 0.9 | 0.8 | 0.4 | 0.5 | 0.4 | 0.1 | 0.1 | 0.1 | 0.1 | 0.1 | |||||
| Industry (05-43) | 48.7 | 43.4 | 36.7 | 23.9 | 18.2 | 17.7 | 16.7 | 16.2 | 11.8 | 10.4 | |||||
| Electricity, gas, steam and air conditioning supply (35) | 36.8 | 30.8 | 25.2 | 15.7 | 9.5 | 9.4 | 9.6 | 8.7 | 5.9 | 5.2 | |||||
| Other industry | 11.9 | 12.5 | 11.5 | 8.3 | 8.7 | 8.3 | 7.1 | 7.6 | 5.9 | 5.2 | |||||
| Services (45-96) | 2.2 | 2.1 | 1.2 | 0.9 | 0.8 | 0.8 | 0.8 | 0.7 | 0.4 | 0.4 | |||||
| Households | 11.2 | 10.7 | 9.3 | 9.2 | 8.8 | 8.1 | 7.6 | 8.3 | 7.0 | 6.8 | |||||
| Total sulphur dioxide emissions | 63.0 | 57.0 | 47.5 | 34.4 | 28.3 | 26.7 | 25.3 | 25.4 | 19.4 | 17.6 | |||||
| Table 6 Nitrogen Oxide (NOx) Emissions | '000 tonnes NOx | ||||||||||||||
| NACE Rev. 2 | 2006 | 2007 | 2008 | 2009 | 2010 | 2011 | 2012 | 2013 | 2014 | 2015 | |||||
| Agriculture, Forestry and Fishing (01-03) | 14.4 | 13.0 | 12.5 | 10.6 | 9.3 | 8.2 | 8.0 | 7.5 | 6.7 | 6.0 | |||||
| Industry (05-43) | 53.4 | 52.6 | 44.6 | 28.6 | 26.0 | 20.6 | 24.6 | 23.2 | 22.3 | 24.0 | |||||
| Electricity, gas, steam and air conditioning supply (35) | 29.9 | 27.3 | 22.0 | 13.3 | 11.5 | 8.0 | 10.3 | 8.6 | 7.5 | 9.5 | |||||
| Other industry | 23.5 | 25.3 | 22.6 | 15.3 | 14.5 | 12.6 | 14.3 | 14.6 | 14.7 | 14.6 | |||||
| Services (45-96) | 44.2 | 43.5 | 39.0 | 34.1 | 31.0 | 29.3 | 27.7 | 27.5 | 29.0 | 30.1 | |||||
| Households | 20.8 | 20.9 | 21.1 | 20.5 | 20.1 | 18.9 | 18.9 | 19.5 | 18.8 | 19.4 | |||||
| Total nitrogen oxide emissions | 132.8 | 130.0 | 117.1 | 93.9 | 86.4 | 77.1 | 79.2 | 77.7 | 76.8 | 79.5 | |||||
| Table 7 Ammonia (NH3) Emissions | '000 tonnes NH3 | |||||||||||||
| NACE Rev. 2 | 2006 | 2007 | 2008 | 2009 | 2010 | 2011 | 2012 | 2013 | 2014 | 2015 | ||||
| Agriculture, Forestry and Fishing (01-03) | 107.3 | 104.1 | 105.5 | 106.5 | 105.2 | 101.1 | 102.7 | 103.9 | 104.6 | 106.9 | ||||
| Industry (05-43) | 0.3 | 0.3 | 0.2 | 0.2 | 0.3 | 0.2 | 0.2 | 0.2 | 0.3 | 0.3 | ||||
| Services (45-96) | 0.2 | 0.2 | 0.2 | 0.2 | 0.1 | 0.1 | 0.1 | 0.1 | 0.1 | 0.1 | ||||
| Households | 2.2 | 2.0 | 2.0 | 1.7 | 1.5 | 1.3 | 1.2 | 1.1 | 0.9 | 0.9 | ||||
| Total ammonia emissions | 110.0 | 106.6 | 107.9 | 108.6 | 107.1 | 102.8 | 104.2 | 105.3 | 106.0 | 108.1 | ||||
| Table 8 Non-Methane Volatile Organic Compound (NMVOC) Emissions | '000 tonnes NMVOC | ||||||||||||
| NACE Rev. 2 | 2006 | 2007 | 2008 | 2009 | 2010 | 2011 | 2012 | 2013 | 2014 | 2015 | |||
| Agriculture, Forestry and Fishing (01-03) | 43.5 | 42.9 | 42.8 | 42.6 | 41.5 | 41.2 | 42.5 | 43.2 | 43.0 | 43.4 | |||
| Industry (05-43) | 28.2 | 28.4 | 26.1 | 24.4 | 24.6 | 23.3 | 23.9 | 24.8 | 26.2 | 28.8 | |||
| Services (45-96) | 8.7 | 8.7 | 7.6 | 6.6 | 5.9 | 5.6 | 5.1 | 4.8 | 4.6 | 4.5 | |||
| Households | 33.2 | 32.3 | 31.8 | 31.0 | 29.1 | 27.7 | 26.7 | 27.4 | 25.7 | 24.7 | |||
| Total NMVOC emissions | 113.6 | 112.4 | 108.4 | 104.6 | 101.1 | 97.8 | 98.2 | 100.4 | 99.6 | 101.3 | |||
| Table 9 Carbon Monoxide (CO) Emissions | '000 tonnes CO | ||||||||||||||
| NACE Rev. 2 | 2006 | 2007 | 2008 | 2009 | 2010 | 2011 | 2012 | 2013 | 2014 | 2015 | |||||
| Agriculture, Forestry and Fishing (01-03) | 3.4 | 3.0 | 3.0 | 2.5 | 2.3 | 2.1 | 2.0 | 1.8 | 1.5 | 1.4 | |||||
| Industry (05-43) | 38.4 | 37.8 | 34.8 | 28.6 | 29.7 | 27.8 | 30.4 | 27.4 | 28.1 | 29.9 | |||||
| Electricity, gas, steam and air conditioning supply (35) | 20.3 | 20.0 | 17.8 | 14.8 | 16.3 | 16.0 | 18.9 | 16.1 | 15.6 | 17.9 | |||||
| Other industry | 18.1 | 17.8 | 17.0 | 13.8 | 13.4 | 11.8 | 11.5 | 11.3 | 12.5 | 12.0 | |||||
| Services (45-96) | 21.5 | 20.8 | 18.8 | 15.9 | 14.0 | 13.2 | 12.2 | 11.8 | 11.7 | 11.2 | |||||
| Households | 136.7 | 125.6 | 120.3 | 109.9 | 98.0 | 89.5 | 82.0 | 78.2 | 70.7 | 66.6 | |||||
| Total carbon monoxide emissions | 199.9 | 187.2 | 176.9 | 156.9 | 144.0 | 132.7 | 126.5 | 119.2 | 112.1 | 109.1 | |||||
| Table 10 Particulate Matter (PM2.5) Emissions | '000 tonnes PM2.5 | ||||||||||||||
| NACE Rev. 2 | 2006 | 2007 | 2008 | 2009 | 2010 | 2011 | 2012 | 2013 | 2014 | 2015 | |||||
| Agriculture, Forestry and Fishing (01-03) | 2.7 | 2.6 | 2.6 | 2.5 | 2.4 | 2.3 | 2.4 | 2.4 | 2.3 | 2.3 | |||||
| Industry (05-43) | 3.5 | 3.3 | 3.1 | 2.4 | 2.3 | 1.9 | 1.9 | 1.8 | 2.0 | 2.0 | |||||
| Services (45-96) | 2.2 | 2.1 | 1.9 | 1.6 | 1.4 | 1.4 | 1.3 | 1.2 | 1.2 | 1.2 | |||||
| Households | 10.2 | 9.9 | 10.3 | 10.8 | 10.2 | 9.5 | 9.3 | 9.9 | 8.6 | 8.4 | |||||
| Total PM2.5 emissions | 18.6 | 17.9 | 17.9 | 17.2 | 16.3 | 15.1 | 14.8 | 15.2 | 14.1 | 13.9 | |||||
| Table 11 Particulate Matter (PM10) Emissions | '000 tonnes PM10 | ||||||||||||||
| NACE Rev. 2 | 2006 | 2007 | 2008 | 2009 | 2010 | 2011 | 2012 | 2013 | 2014 | 2015 | |||||
| Agriculture, Forestry and Fishing (01-03) | 11.3 | 11.1 | 11.5 | 11.3 | 11.2 | 11.2 | 11.3 | 11.2 | 11.1 | 11.1 | |||||
| Industry (05-43) | 4.1 | 3.7 | 3.6 | 2.8 | 2.7 | 2.2 | 2.2 | 2.1 | 2.4 | 2.4 | |||||
| Services (45-96) | 2.7 | 2.6 | 2.3 | 2.0 | 1.8 | 1.8 | 1.6 | 1.6 | 1.5 | 1.5 | |||||
| Households | 10.8 | 10.5 | 11.0 | 11.4 | 10.8 | 10.0 | 9.8 | 10.4 | 9.1 | 8.9 | |||||
| Total PM10 emissions | 28.8 | 28.0 | 28.4 | 27.4 | 26.4 | 25.2 | 24.9 | 25.2 | 24.1 | 23.9 | |||||
| Table 12 Greenhouse Gas Emissions | '000 tonnes | ||||||||||||
| Gas | Unit | 2006 | 2007 | 2008 | 2009 | 2010 | 2011 | 2012 | 2013 | 2014 | 2015 | ||
| CO2 emissions | CO2 | 47,485 | 47,576 | 47,252 | 42,069 | 41,630 | 37,965 | 38,144 | 37,123 | 36,633 | 38,393 | ||
| N2O emissions | N2O | 24 | 23 | 23 | 23 | 24 | 22 | 23 | 24 | 24 | 24 | ||
| CH4 emissions | CH4 | 538 | 512 | 504 | 489 | 479 | 477 | 489 | 503 | 515 | 531 | ||
| HFC, PFC, SF6, NF3 emissions | CO2 equivalent | 1,178 | 1,175 | 1,037 | 1,038 | 1,012 | 1,016 | 996 | 1,123 | 1,194 | 1,143 | ||
| Table 13 Air Pollutant Emissions | '000 tonnes | ||||||||||||
| Pollutant | 2006 | 2007 | 2008 | 2009 | 2010 | 2011 | 2012 | 2013 | 2014 | 2015 | |||
| Sulphur dioxide emissions | 63 | 57 | 48 | 34 | 28 | 27 | 25 | 25 | 19 | 18 | |||
| Nitrogen oxide emissions | 133 | 130 | 117 | 94 | 86 | 77 | 79 | 78 | 77 | 80 | |||
| Ammonia emissions | 110 | 107 | 108 | 109 | 107 | 103 | 104 | 105 | 106 | 108 | |||
| NMVOC emissions | 114 | 112 | 108 | 105 | 101 | 98 | 98 | 100 | 100 | 101 | |||
| Carbon monoxide emissions | 200 | 187 | 177 | 157 | 144 | 133 | 127 | 119 | 112 | 109 | |||
| PM2.5 emissions | 19 | 18 | 18 | 17 | 16 | 15 | 15 | 15 | 14 | 14 | |||
| PM10 emissions | 29 | 28 | 28 | 27 | 26 | 25 | 25 | 25 | 24 | 24 | |||
| Table 14 Greenhouse Gas Emissions: Adjustment to Residence Principle | '000 tonnes CO2 equivalent | |||||||
| 2010 | 2011 | 2012 | 2013 | 2014 | 2015 | |||
| Total CO2 equivalent emissions, calculated on territorial basis, as reported to UNFCCC | 61,692 | 57,567 | 58,124 | 57,922 | 57,758 | 59,878 | ||
| Transport emissions by residents abroad less transport emissions by non-residents on the territory | 6,552 | 7,715 | 8,135 | 6,086 | 6,150 | 4,269 | ||
| Total CO2 equivalent emissions, calculated on residence basis, as reported to Eurostat | 68,243 | 65,282 | 66,259 | 64,009 | 63,907 | 64,148 | ||
Introduction
The air emissions accounts classify emissions of greenhouse gases and air pollutants by emitting economic sector.
Data sources
The figures presented in this release are based on the air emissions inventories submitted annually by the Environmental Protection Agency (EPA) to the United Nations under the UNFCCC (United Nations Framework Convention on Climate Change).
Revisions
This release incorporates revisions to the air emissions estimates previously published by the CSO, including the revisions made by the EPA to the annual national air emissions inventory.
Greenhouse gases
The three main greenhouse gases included in this publication are carbon dioxide (CO2), nitrous oxide (N2O) and methane (CH4). As greenhouse gas emissions from human activities increase, they build up in the atmosphere, warming it through the greenhouse effect. Because many of the major greenhouse gases stay in the atmosphere for tens to hundreds of years after being released, their warming effects on the climate persist over a long time and can therefore affect both present and future generations.
Carbon dioxide emissions are the result of burning fossil fuels such as coal, turf and petroleum for heat, power and transport. Industrial processes such as cement production also emit CO2.
Nitrous oxide emissions arise from nitrogen fertilisers used in agriculture and a small number of industrial processes.
Methane emissions are caused by the digestive systems of ruminant animals, waste water treatment plants and landfill sites.
There are other greenhouse gases: hydrofluorocarbons (HFCs), perfluorocarbons (PFCs), sulphur hexafluoride (SF6) and nitrogen trifluoride (NF3). The emissions from these gases account for approximately 2% of the total greenhouse gas emissions for Ireland, and are included in the total of greenhouse gases in Tables 1 and 12. There are several types of HFC and PFC, each of which can have a distinct global warming potential conversion factor.
Global warming potential
Greenhouse gas emissions by different gases are compared using the global warming potentials (GWPs) for a 100-year time horizon from the Intergovernmental Panel on Climate Change (IPCC) Fourth Assessment Report of 2007. The GWP is a measure of the global warming effect of a given mass of a greenhouse gas compared with the global warming effect of the same mass of carbon dioxide. The GWP for methane is 25 and that of nitrous oxide is 298. The GWPs of the fluoridated gases vary but many are in the thousands or tens of thousands.
Greenhouse gases other than carbon dioxide may be converted into tonnes of carbon dioxide equivalent by multiplying their masses by their global warming potentials. Further details are available at the IPCC website (https://www.ipcc.ch/publications_and_data/ar4/wg1/en/ch2s2-10-2.html).
Air pollutants
Sulphur dioxide (SO2) is a gas which is formed when sulphur-containing fuels (mainly coal and oil) are burned in power stations. Exposure to high concentrations of SO2 can lead to breathing difficulties for people with long-term respiratory conditions such as asthma.
Nitrogen oxides (NOx) are produced during combustion at high temperatures; the main sources in Ireland are vehicles and power stations. The industrial sector is also a significant contributor to NOx levels, particularly the cement production industry. Exposure to NOx is linked to adverse respiratory effects, and long-term exposure increases the risk of respiratory infection in children.
Ammonia (NH3) emissions arise primarily from animal manure and nitrogen-based fertilisers. Exposure to high levels of ammonia may irritate the skin, eyes, throat and lungs.
Non-methane volatile organic compounds (NMVOCs) are emitted as gases by a wide array of products including paints, paint strippers, glues, adhesives and cleaning agents. They also arise as a product of incomplete combustion of fuels and are a component of car exhaust emissions. A further significant source is agricultural activity. Exposure to NMVOCs can lead to eye, nose and throat irritation, headaches, loss of coordination, nausea and damage to the liver, kidney and central nervous system.
Carbon monoxide (CO) is a colourless gas, formed from incomplete oxidation during combustion of fuel. Emissions of CO in Ireland are mostly vehicle emissions, although fuel combustion for household heating also contributes. Concentrations of CO tend to be higher in areas with heavy traffic congestion. Carbon monoxide enters the bloodstream through the lungs, where it affects the body’s uptake of oxygen. Exposure in ambient air is most serious for people with cardiovascular diseases.
Particulate matter of median aerodynamic diameter 2.5 microns (PM2.5) or ‘fine’ particulate matter is particle pollution composed of a mixture of solids and liquids. Depending on the source of the matter these can include acids (nitrates and sulphates), volatile organic compounds, soil, metals and dust particles. The main source of fine particulate matter in Ireland is fuel combustion for household heating. The main sources of particulate matter of median aerodynamic diameter 10 microns (PM10) in Ireland are agricultural activities, such as the use of inorganic nitrogen fertilisers, and household heating. The adverse health impact of particulate matter arises from its ability to penetrate deep into the respiratory tract.
Forestry and soil sequestration
No adjustment has been made for reductions in greenhouse gas emissions from forest or soil sequestration.
NACE allocation
Emissions are distributed across NACE sectors according to the correspondences between Common Reporting Format (CRF)/Nomenclature For Reporting (NFR) codes in the Air Emissions Inventory and NACE Rev. 2 sectors.
In some cases there is a one-to-one correspondence between the CRF/NFR codes and a NACE Rev. 2 sector. In this case, the total emissions from this CRF/NFR code are attributed to that NACE Rev. 2 sector. In many cases, a single CRF/NFR corresponds to more than one NACE sector. In these cases, emissions are assigned across NACE sectors by the CSO by using expenditure on fuel by each NACE sector. The data on fuel use are collected in the CSO’s Census of Industrial Production and Annual Services Inquiry.
Data for all years has been presented using the NACE Rev. 2 classification, which came into effect in 2008. The CSO Census of Industrial Production and Annual Services Inquiry data for 2000-2007 were reclassified from NACE Rev. 1.1 at enterprise level.
Electricity and gas supply
Emissions from the production of electricity and gas are allocated to the suppliers of energy rather than the end users, and so are allocated to NACE Rev. 2 division 35 (Electricity, gas, steam and air conditioning supply).
Road transport
Road transport emissions are attributed to individual economic sectors according to the principal activity of the business. If the transport of passengers and freight is the principal activity of a business, then the related emissions are attributed to NACE Rev. 2 division 49 (Land transport). If road transport is a secondary or ancillary activity to the main business, then the related road transport emissions are allocated to the main NACE division of the enterprise.
The Environmental Protection Agency’s detailed modelled road transport emissions data are combined with CSO Road Freight Transport data, private vehicle registration data and road traffic volumes data to allocate road transport usage across NACE sectors.
There is one CRF/NFR code for road transport in the EPA Air Emissions Inventory. This emissions figure is generally distributed across NACE sectors by using expenditure on transport fuel by each NACE sector. The data on transport fuel are collected in the Census of Industrial Production and the Annual Services Inquiry.
Road freight transport data are allocated initially by using the tonne-km data collected by the CSO. This data allocates emissions to the main NACE sectors responsible for road freight as identified in the CSO Road Freight Transport Survey. For the remaining unspecified sectors, emissions are attributed across NACE sectors using expenditure on transport fuel by each NACE sector.
Emissions from private cars are split into household vehicles, small Public Service Vehicles (which are assigned to NACE 49) and company cars, whose emissions are distributed across all NACE sectors proportionally according to expenditure on transport fuel by each NACE sector.
Emissions from buses are allocated to NACE 49. Emissions from motorcycles are allocated to households.
Landfill waste
Landfill waste accounts for approximately 7% of methane (CH4) emissions. The NACE Rev. 2 classification for waste treatment is NACE 37-39 (Sewerage and waste management). Most landfill sites are owned and operated by local authorities who are categorised under NACE 84 (Public Administration and Defence). However, all CH4 emissions from landfill waste have been classified under NACE 37-39, as this is the NACE sector of the local unit.
Adjustment from Territorial Principle to Residence Principle
National emissions inventories present emissions of greenhouse gases and air pollutants that originate from the geographic territory of a given country. Air emissions accounts form part of the implementation by Eurostat of a series of economic-environmental accounts which are designed to be compatible with the concepts and principles of national accounts. Therefore the air emissions accounts record emissions arising from the activities of resident units of a given national economy, regardless of where these emissions actually occur geographically. According to the national accounts definition of residence, an economic unit is a resident unit of a country when it has engaged for at least one year in economic activity in that territory.
For example, the road transport emissions of an Irish haulier driving in France are not included in Ireland's emissions inventory under the territorial principle, but are included under the residence principle. Similarly the emissions arising from the activity of an Irish airline flying from England to Italy are assigned to Ireland under the residence principle but not under the territorial principle.
On the other hand, the road transport emissions of a German tourist driving in Ireland are included in the inventory as territorial emissions but are excluded from air emissions accounts.
The air emissions data presented in this release is compiled using the "inventory-first" approach. This approach takes the national inventory totals as a starting point, makes a residence principle adjustment, and allocates resident emissions to NACE categories and households. The adjustment to resident emissions is challenging and data collection on this aspect of the accounts is still in development. However in Table 14 of this release there is provisional data on transport emissions by Irish residents abroad less transport emissions by non-residents in Ireland.
 Hide Background Notes
Scan the QR code below to view this release online or go to
http://www.cso.ie/en/releasesandpublications/er/eaae/environmentalaccountsairemissions2015/
 Show Table 1 Greenhouse gas emissions by sector
 Hide Table 1 Greenhouse gas emissions by sector