
| Year | Number of meters | Average (Litres per meter per day) | Median (Litres per meter per day) |
| 2014 | 497,238 | 381 | 246 |
| 2015 | 771,348 | 383 | 246 |
| 2016 | 691,453 | 351 | 249 |
| 2017 | 707,854 | 359 | 256 |
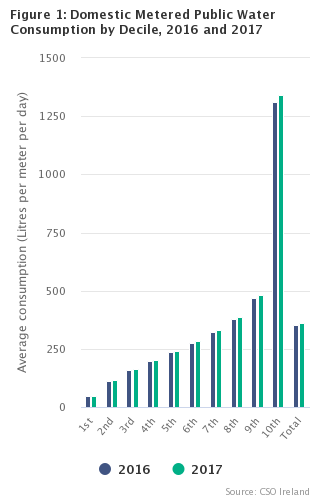
The annual average consumption per meter per day in 2017 was 359 litres. This is a 2.3% increase compared with the 2016 average of 351 litres (see Headline table and Table 6). On a monthly basis, the average consumption varied from 349 litres per meter per day in February to 369 litres in May (see Table 1). In 2017, the highest decile accounted for 37% of total consumption and had an average consumption of 1,340 litres per meter per day (see Figure 1 and Table 3). This is 2.3% higher than the 2016 average consumption of 1,310 litres per meter per day for the highest decile.
In contrast to average consumption, the median consumption per meter per day in 2017 of 256 litres was 2.8% higher than the 2016 figure of 249 litres (see Headline table and Table 6). The monthly medians varied from 250 litres in August to 267 litres in May (see Table 1). Median consumption reflects typical levels of consumption more than average consumption as the median is less affected by meters with very high levels of water use.
Around 75% of the total annual domestic metered water consumption was accounted for by 98.8% of customers, using a consumption threshold of 1,000 litres per meter per day (see Table 2). Conversely, 1.2% of customers were responsible for 25% of metered water consumption in 2017.
Table 4A shows the monthly average consumption per meter per day by county. Cavan had the lowest average consumption in 2017 at 298 litres compared with Offaly which had the highest annual average of 419 litres. The corresponding medians and meter numbers are given in Tables 4B and 4C.
Table 5A shows the average consumption by Dublin postal district. Dublin 20, at 293 litres per meter per day, had the lowest annual average daily consumption in 2017. Dublin 24 had the highest average daily consumption at 564 litres.
| In the interests of completeness, figures for Dublin 17 and Dublin 24 have been given in Tables 5A-5C. However, users should note that data were available for only a small number of meters in both of these districts. No meter data were available for Dublin 10. |
| Average | Median | |
| < 1,000 | 277 | 248 |
| < 5,000 | 314 | 251 |
| < 10,000 | 328 | 251 |
| Total (no threshold) | 359 | 252 |
| Table 1 Domestic Metered Public Water Consumption by Month, 2017 | |||||
| Month | Number of meters | Average days | Total consumption (Cubic metres) | Average (Litres per meter per day) | Median (Litres per meter per day) |
| January | 686,365 | 31 | 7,437,621 | 350 | 252 |
| February | 698,872 | 28 | 6,836,712 | 349 | 253 |
| March | 699,252 | 31 | 7,666,923 | 354 | 256 |
| April | 698,679 | 30 | 7,526,642 | 359 | 260 |
| May | 704,002 | 31 | 8,054,483 | 369 | 267 |
| June | 703,878 | 30 | 7,673,571 | 363 | 259 |
| July | 703,155 | 31 | 7,876,414 | 361 | 255 |
| August | 702,608 | 31 | 7,783,166 | 357 | 250 |
| September | 702,294 | 30 | 7,572,529 | 359 | 254 |
| October | 701,080 | 31 | 7,791,061 | 358 | 255 |
| November | 700,787 | 30 | 7,518,099 | 358 | 254 |
| December | 700,104 | 31 | 7,942,366 | 366 | 261 |
| Total | 707,854 | 361 | 91,679,587 | 359 | 256 |
| Table 2 Domestic Metered Public Water Consumption by Threshold Level, 2017 | ||||
| Threshold Level | Number of meters | Total consumption (Cubic metres) | Average (Litres per meter per day) | Median (Litres per meter per day) |
| Total (all meters) | 707,854 | 91,679,587 | 359 | 252 |
| < 1,000 litres per meter per day | 699,631 | 68,827,684 | 277 | 248 |
| < 5,000 litres per meter per day | 706,468 | 79,941,675 | 314 | 251 |
| < 10,000 litres per meter per day | 707,214 | 83,571,926 | 328 | 251 |
| Table 3 Domestic Metered Public Water Consumption by Decile, 2017 | |||
| Decile | Number of meters | Total consumption (Cubic metres) | Average (Litres per meter per day) |
| 1st | 70,785 | 1,203,820 | 48 |
| 2nd | 70,786 | 2,919,711 | 114 |
| 3rd | 70,785 | 4,132,601 | 162 |
| 4th | 70,785 | 5,195,175 | 203 |
| 5th | 70,786 | 6,201,805 | 242 |
| 6th | 70,786 | 7,248,905 | 283 |
| 7th | 70,786 | 8,434,932 | 329 |
| 8th | 70,784 | 9,938,213 | 388 |
| 9th | 70,786 | 12,326,960 | 481 |
| 10th | 70,785 | 34,077,465 | 1,340 |
| Total | 707,854 | 91,679,587 | 359 |
| Table 4A Domestic Metered Public Water Consumption by County and Month, 2017 (Average) | |||||||||||||
| Average consumption in litres per meter per day | |||||||||||||
| County | January | February | March | April | May | June | July | August | September | October | November | December | Total |
| Carlow | 348 | 349 | 357 | 358 | 365 | 367 | 362 | 351 | 358 | 358 | 361 | 371 | 359 |
| Cavan | 290 | 298 | 300 | 302 | 311 | 301 | 290 | 294 | 294 | 295 | 295 | 304 | 298 |
| Clare | 318 | 318 | 322 | 332 | 343 | 344 | 346 | 349 | 337 | 331 | 327 | 332 | 333 |
| Cork | 365 | 367 | 370 | 378 | 385 | 383 | 384 | 375 | 378 | 378 | 381 | 392 | 378 |
| Donegal | 294 | 296 | 306 | 315 | 321 | 317 | 328 | 326 | 312 | 309 | 303 | 313 | 312 |
| Dublin | 345 | 346 | 350 | 356 | 372 | 360 | 352 | 348 | 354 | 354 | 353 | 361 | 354 |
| Dublin postal districts | 352 | 346 | 351 | 353 | 364 | 353 | 353 | 346 | 352 | 352 | 349 | 353 | 352 |
| Galway | 375 | 376 | 381 | 385 | 397 | 384 | 386 | 387 | 395 | 395 | 386 | 389 | 386 |
| Kerry | 356 | 356 | 362 | 375 | 377 | 379 | 388 | 388 | 376 | 371 | 372 | 383 | 374 |
| Kildare | 346 | 347 | 351 | 354 | 366 | 368 | 348 | 343 | 350 | 351 | 351 | 359 | 353 |
| Kilkenny | 340 | 342 | 346 | 355 | 358 | 361 | 361 | 358 | 354 | 354 | 356 | 359 | 354 |
| Laois | 400 | 407 | 415 | 416 | 417 | 416 | 414 | 408 | 409 | 402 | 402 | 415 | 410 |
| Leitrim | 308 | 318 | 323 | 332 | 332 | 331 | 332 | 320 | 312 | 315 | 314 | 328 | 322 |
| Limerick | 329 | 334 | 339 | 339 | 350 | 338 | 332 | 335 | 360 | 359 | 359 | 371 | 345 |
| Longford | 371 | 357 | 361 | 372 | 376 | 364 | 361 | 365 | 365 | 364 | 374 | 396 | 369 |
| Louth | 354 | 355 | 356 | 370 | 386 | 383 | 374 | 380 | 374 | 372 | 372 | 378 | 371 |
| Mayo | 319 | 315 | 323 | 326 | 335 | 328 | 336 | 336 | 328 | 327 | 327 | 335 | 328 |
| Meath | 358 | 358 | 360 | 366 | 380 | 369 | 352 | 356 | 362 | 363 | 366 | 377 | 364 |
| Monaghan | 282 | 294 | 297 | 301 | 314 | 309 | 301 | 312 | 308 | 303 | 302 | 315 | 303 |
| Offaly | 410 | 414 | 417 | 421 | 430 | 425 | 426 | 418 | 421 | 415 | 413 | 420 | 419 |
| Roscommon | 370 | 371 | 374 | 385 | 391 | 375 | 389 | 378 | 374 | 376 | 378 | 394 | 380 |
| Sligo | 314 | 314 | 317 | 322 | 330 | 324 | 332 | 332 | 325 | 321 | 316 | 325 | 323 |
| Tipperary | 371 | 373 | 378 | 385 | 394 | 395 | 394 | 394 | 396 | 387 | 386 | 391 | 387 |
| Waterford | 336 | 339 | 342 | 351 | 354 | 356 | 365 | 360 | 347 | 345 | 344 | 353 | 350 |
| Westmeath | 385 | 379 | 379 | 380 | 396 | 385 | 383 | 378 | 387 | 386 | 384 | 394 | 385 |
| Wexford | 311 | 311 | 318 | 328 | 332 | 335 | 343 | 334 | 319 | 320 | 320 | 333 | 326 |
| Wicklow | 347 | 348 | 353 | 356 | 366 | 363 | 366 | 354 | 353 | 352 | 352 | 364 | 356 |
| Total | 350 | 349 | 354 | 359 | 369 | 363 | 361 | 357 | 359 | 358 | 358 | 366 | 359 |
| Table 4B Domestic Metered Public Water Consumption by County and Month, 2017 (Median) | |||||||||||||
| Median consumption in litres per meter per day | |||||||||||||
| County | January | February | March | April | May | June | July | August | September | October | November | December | Total |
| Carlow | 256 | 257 | 262 | 263 | 267 | 264 | 263 | 251 | 258 | 258 | 257 | 262 | 260 |
| Cavan | 223 | 232 | 231 | 235 | 242 | 233 | 226 | 227 | 228 | 230 | 229 | 235 | 231 |
| Clare | 224 | 220 | 225 | 231 | 236 | 230 | 232 | 236 | 225 | 223 | 222 | 227 | 228 |
| Cork | 256 | 255 | 259 | 264 | 268 | 263 | 260 | 253 | 256 | 258 | 257 | 261 | 259 |
| Donegal | 209 | 206 | 211 | 215 | 220 | 212 | 220 | 220 | 211 | 209 | 210 | 216 | 213 |
| Dublin | 275 | 274 | 278 | 280 | 292 | 278 | 267 | 263 | 272 | 274 | 274 | 283 | 276 |
| Dublin postal districts | 256 | 257 | 260 | 260 | 270 | 260 | 257 | 250 | 257 | 259 | 258 | 263 | 259 |
| Galway | 252 | 256 | 258 | 258 | 267 | 254 | 254 | 252 | 258 | 260 | 258 | 255 | 257 |
| Kerry | 220 | 218 | 223 | 235 | 237 | 235 | 242 | 242 | 227 | 224 | 221 | 231 | 229 |
| Kildare | 273 | 273 | 277 | 279 | 289 | 277 | 267 | 262 | 272 | 274 | 274 | 281 | 275 |
| Kilkenny | 249 | 249 | 251 | 258 | 260 | 259 | 254 | 253 | 250 | 250 | 250 | 257 | 253 |
| Laois | 272 | 272 | 278 | 281 | 287 | 282 | 275 | 271 | 275 | 280 | 280 | 289 | 278 |
| Leitrim | 191 | 192 | 193 | 203 | 206 | 202 | 203 | 201 | 197 | 195 | 198 | 204 | 199 |
| Limerick | 242 | 246 | 250 | 252 | 258 | 247 | 238 | 237 | 249 | 249 | 248 | 257 | 248 |
| Longford | 237 | 237 | 244 | 246 | 251 | 242 | 239 | 233 | 236 | 238 | 237 | 243 | 240 |
| Louth | 256 | 254 | 256 | 262 | 269 | 260 | 250 | 250 | 253 | 253 | 253 | 260 | 256 |
| Mayo | 209 | 210 | 214 | 220 | 227 | 219 | 223 | 218 | 215 | 216 | 217 | 223 | 217 |
| Meath | 284 | 285 | 289 | 292 | 302 | 291 | 275 | 276 | 284 | 285 | 283 | 294 | 287 |
| Monaghan | 228 | 232 | 231 | 238 | 243 | 235 | 228 | 227 | 229 | 230 | 232 | 242 | 233 |
| Offaly | 271 | 272 | 276 | 278 | 284 | 276 | 272 | 266 | 269 | 270 | 271 | 279 | 274 |
| Roscommon | 229 | 231 | 233 | 240 | 249 | 238 | 239 | 232 | 233 | 235 | 236 | 244 | 236 |
| Sligo | 208 | 209 | 214 | 217 | 222 | 214 | 221 | 219 | 211 | 213 | 212 | 218 | 215 |
| Tipperary | 245 | 244 | 249 | 256 | 262 | 259 | 255 | 251 | 252 | 253 | 252 | 257 | 253 |
| Waterford | 242 | 242 | 246 | 255 | 259 | 255 | 262 | 257 | 244 | 244 | 243 | 251 | 250 |
| Westmeath | 247 | 248 | 251 | 255 | 262 | 253 | 250 | 244 | 248 | 250 | 249 | 256 | 251 |
| Wexford | 217 | 218 | 221 | 230 | 231 | 231 | 238 | 233 | 222 | 221 | 221 | 226 | 226 |
| Wicklow | 264 | 262 | 268 | 271 | 278 | 272 | 268 | 260 | 263 | 265 | 264 | 273 | 267 |
| Total | 252 | 253 | 256 | 260 | 267 | 259 | 255 | 250 | 254 | 255 | 254 | 261 | 256 |
| Table 4C Domestic Metered Public Water Consumption by County and Month, 2017 (Meters) | |||||||||||||
| Number of meters | |||||||||||||
| County | January | February | March | April | May | June | July | August | September | October | November | December | Total |
| Carlow | 9,730 | 9,783 | 9,782 | 9,761 | 9,935 | 9,914 | 9,828 | 9,816 | 9,778 | 9,713 | 9,699 | 9,644 | 10,022 |
| Cavan | 8,822 | 8,831 | 8,832 | 8,834 | 8,955 | 8,961 | 8,962 | 8,966 | 8,962 | 8,958 | 8,959 | 8,948 | 9,026 |
| Clare | 18,574 | 19,466 | 19,462 | 19,456 | 19,516 | 19,503 | 19,462 | 19,440 | 19,417 | 19,362 | 19,336 | 19,288 | 19,606 |
| Cork | 75,102 | 77,386 | 77,426 | 77,400 | 77,836 | 77,807 | 77,710 | 77,565 | 77,509 | 77,398 | 77,207 | 77,132 | 78,299 |
| Donegal | 12,135 | 12,168 | 12,169 | 12,157 | 12,179 | 12,181 | 12,146 | 12,146 | 12,146 | 12,094 | 12,095 | 12,067 | 12,268 |
| Dublin | 56,431 | 58,005 | 58,030 | 58,009 | 58,139 | 58,129 | 58,108 | 58,091 | 58,091 | 58,077 | 58,027 | 58,026 | 58,285 |
| Dublin postal districts | 135,567 | 137,695 | 137,735 | 137,489 | 137,817 | 137,813 | 137,797 | 137,854 | 137,855 | 137,748 | 137,659 | 137,637 | 138,305 |
| Galway | 30,670 | 31,627 | 31,643 | 31,626 | 31,830 | 31,827 | 31,807 | 31,840 | 31,828 | 31,796 | 31,777 | 31,726 | 32,030 |
| Kerry | 20,571 | 21,199 | 21,201 | 21,168 | 21,342 | 21,318 | 21,262 | 21,246 | 21,202 | 21,106 | 21,094 | 21,051 | 21,522 |
| Kildare | 47,321 | 47,603 | 47,625 | 47,630 | 48,192 | 48,209 | 48,215 | 48,162 | 48,166 | 48,025 | 48,008 | 48,004 | 48,389 |
| Kilkenny | 10,593 | 10,814 | 10,819 | 10,800 | 10,903 | 10,891 | 10,867 | 10,859 | 10,849 | 10,820 | 10,839 | 10,826 | 10,966 |
| Laois | 14,261 | 14,547 | 14,554 | 14,556 | 14,652 | 14,656 | 14,654 | 14,622 | 14,625 | 14,621 | 14,622 | 14,622 | 14,716 |
| Leitrim | 5,015 | 5,097 | 5,103 | 5,096 | 5,094 | 5,093 | 5,091 | 5,076 | 5,072 | 5,066 | 5,036 | 5,019 | 5,141 |
| Limerick | 26,558 | 27,036 | 27,053 | 27,041 | 27,114 | 27,105 | 27,054 | 26,953 | 26,948 | 26,885 | 26,883 | 26,871 | 27,276 |
| Longford | 5,793 | 5,803 | 5,808 | 5,805 | 6,218 | 6,218 | 6,214 | 6,218 | 6,216 | 6,205 | 6,207 | 6,191 | 6,262 |
| Louth | 23,243 | 24,137 | 24,149 | 24,125 | 24,363 | 24,358 | 24,324 | 24,336 | 24,311 | 24,258 | 24,245 | 24,197 | 24,470 |
| Mayo | 16,646 | 16,801 | 16,949 | 16,946 | 16,967 | 16,971 | 16,971 | 16,922 | 16,921 | 16,904 | 16,879 | 16,854 | 17,146 |
| Meath | 35,471 | 35,678 | 35,671 | 35,645 | 36,112 | 36,094 | 36,044 | 36,027 | 36,005 | 35,951 | 35,936 | 35,895 | 36,233 |
| Monaghan | 5,666 | 5,754 | 5,760 | 5,762 | 5,761 | 5,760 | 5,756 | 5,758 | 5,751 | 5,747 | 5,813 | 5,811 | 5,854 |
| Offaly | 10,995 | 11,103 | 11,108 | 11,102 | 11,704 | 11,711 | 11,710 | 11,708 | 11,708 | 11,695 | 11,688 | 11,685 | 11,758 |
| Roscommon | 7,885 | 7,963 | 7,977 | 7,973 | 7,971 | 7,973 | 7,947 | 7,936 | 7,926 | 7,903 | 7,890 | 7,847 | 8,077 |
| Sligo | 10,619 | 10,742 | 10,748 | 10,733 | 10,819 | 10,824 | 10,801 | 10,793 | 10,791 | 10,764 | 10,763 | 10,729 | 10,888 |
| Tipperary | 23,045 | 23,237 | 23,239 | 23,211 | 23,226 | 23,226 | 23,181 | 23,082 | 23,075 | 23,025 | 23,200 | 23,194 | 23,611 |
| Waterford | 13,433 | 13,470 | 13,471 | 13,470 | 13,661 | 13,660 | 13,649 | 13,639 | 13,631 | 13,584 | 13,569 | 13,560 | 13,708 |
| Westmeath | 15,198 | 15,589 | 15,600 | 15,591 | 15,902 | 15,902 | 15,885 | 15,888 | 15,875 | 15,840 | 15,839 | 15,815 | 15,997 |
| Wexford | 24,895 | 25,163 | 25,156 | 25,109 | 25,344 | 25,322 | 25,258 | 25,233 | 25,207 | 25,113 | 25,094 | 25,042 | 25,498 |
| Wicklow | 22,126 | 22,175 | 22,182 | 22,184 | 22,450 | 22,452 | 22,452 | 22,432 | 22,429 | 22,422 | 22,423 | 22,423 | 22,501 |
| Total | 686,365 | 698,872 | 699,252 | 698,679 | 704,002 | 703,878 | 703,155 | 702,608 | 702,294 | 701,080 | 700,787 | 700,104 | 707,854 |
| Table 5A Domestic Metered Public Water Consumption by Dublin Postal District and Month, 2017 (Average) | |||||||||||||
| Average consumption in litres per meter per day | |||||||||||||
| Dublin Postal District | January | February | March | April | May | June | July | August | September | October | November | December | Total |
| Dublin 01 | 312 | 316 | 323 | 349 | 357 | 345 | 364 | 337 | 346 | 357 | 343 | 355 | 342 |
| Dublin 02 | 405 | 390 | 399 | 407 | 415 | 405 | 417 | 409 | 424 | 472 | 491 | 533 | 431 |
| Dublin 03 | 387 | 375 | 383 | 389 | 400 | 389 | 389 | 377 | 386 | 388 | 381 | 380 | 386 |
| Dublin 04 | 397 | 406 | 415 | 425 | 429 | 427 | 436 | 426 | 414 | 415 | 406 | 417 | 418 |
| Dublin 05 | 289 | 290 | 296 | 303 | 311 | 304 | 297 | 289 | 291 | 292 | 292 | 294 | 296 |
| Dublin 06 | 417 | 436 | 436 | 445 | 442 | 429 | 430 | 418 | 428 | 433 | 421 | 415 | 429 |
| Dublin 06W | 324 | 324 | 328 | 328 | 341 | 329 | 325 | 320 | 331 | 331 | 328 | 331 | 328 |
| Dublin 07 | 335 | 343 | 349 | 353 | 359 | 353 | 359 | 353 | 355 | 359 | 352 | 359 | 352 |
| Dublin 08 | 417 | 386 | 391 | 396 | 397 | 387 | 382 | 375 | 379 | 397 | 398 | 380 | 390 |
| Dublin 09 | 328 | 332 | 338 | 337 | 347 | 333 | 326 | 321 | 329 | 326 | 324 | 324 | 330 |
| Dublin 11 | 369 | 374 | 373 | 373 | 376 | 366 | 362 | 360 | 368 | 373 | 361 | 367 | 369 |
| Dublin 12 | 286 | 290 | 294 | 300 | 312 | 306 | 303 | 302 | 308 | 307 | 306 | 307 | 302 |
| Dublin 13 | 346 | 346 | 352 | 355 | 367 | 364 | 372 | 371 | 366 | 360 | 362 | 367 | 361 |
| Dublin 14 | 335 | 329 | 332 | 337 | 356 | 340 | 336 | 331 | 340 | 337 | 337 | 342 | 338 |
| Dublin 15 | 393 | 356 | 360 | 355 | 364 | 356 | 361 | 353 | 360 | 360 | 360 | 361 | 362 |
| Dublin 16 | 309 | 305 | 310 | 311 | 328 | 314 | 309 | 301 | 308 | 309 | 309 | 316 | 311 |
| Dublin 17 | 382 | 411 | 421 | 454 | 493 | 463 | 495 | 469 | 482 | 463 | 478 | 521 | 461 |
| Dublin 18 | 357 | 361 | 366 | 373 | 392 | 376 | 370 | 368 | 376 | 369 | 369 | 382 | 372 |
| Dublin 20 | 275 | 290 | 290 | 294 | 304 | 300 | 294 | 290 | 292 | 293 | 291 | 298 | 293 |
| Dublin 22 | 420 | 439 | 441 | 454 | 463 | 458 | 452 | 441 | 444 | 445 | 451 | 465 | 448 |
| Dublin 24 | 628 | 576 | 510 | 513 | 567 | 570 | 551 | 551 | 558 | 574 | 587 | 582 | 564 |
| Total | 352 | 346 | 351 | 353 | 364 | 353 | 353 | 346 | 352 | 352 | 349 | 353 | 352 |
| Table 5B Domestic Metered Public Water Consumption by Dublin Postal District and Month, 2017 (Median) | |||||||||||||
| Median consumption in litres per meter per day | |||||||||||||
| Dublin Postal District | January | February | March | April | May | June | July | August | September | October | November | December | Total |
| Dublin 01 | 244 | 245 | 245 | 234 | 243 | 228 | 253 | 230 | 229 | 236 | 225 | 233 | 237 |
| Dublin 02 | 226 | 217 | 220 | 210 | 216 | 210 | 217 | 204 | 213 | 217 | 210 | 213 | 213 |
| Dublin 03 | 247 | 247 | 249 | 249 | 262 | 250 | 243 | 237 | 248 | 249 | 248 | 254 | 248 |
| Dublin 04 | 245 | 250 | 248 | 248 | 256 | 252 | 258 | 241 | 246 | 250 | 248 | 251 | 249 |
| Dublin 05 | 227 | 229 | 232 | 234 | 242 | 233 | 232 | 224 | 227 | 228 | 229 | 233 | 231 |
| Dublin 06 | 264 | 272 | 272 | 267 | 271 | 269 | 270 | 248 | 262 | 269 | 268 | 264 | 267 |
| Dublin 06W | 250 | 247 | 252 | 252 | 265 | 252 | 244 | 237 | 248 | 249 | 249 | 257 | 250 |
| Dublin 07 | 222 | 225 | 227 | 227 | 232 | 227 | 232 | 227 | 228 | 232 | 226 | 231 | 228 |
| Dublin 08 | 210 | 212 | 212 | 208 | 217 | 213 | 210 | 205 | 203 | 213 | 216 | 208 | 211 |
| Dublin 09 | 230 | 233 | 236 | 236 | 246 | 235 | 230 | 223 | 229 | 232 | 234 | 233 | 233 |
| Dublin 11 | 246 | 249 | 251 | 253 | 261 | 252 | 248 | 246 | 248 | 251 | 250 | 255 | 251 |
| Dublin 12 | 213 | 214 | 217 | 220 | 231 | 221 | 219 | 214 | 216 | 216 | 217 | 221 | 218 |
| Dublin 13 | 260 | 256 | 263 | 264 | 273 | 265 | 261 | 253 | 255 | 255 | 256 | 270 | 261 |
| Dublin 14 | 254 | 256 | 257 | 259 | 272 | 256 | 248 | 242 | 254 | 256 | 257 | 260 | 256 |
| Dublin 15 | 291 | 291 | 294 | 292 | 299 | 292 | 297 | 289 | 295 | 295 | 295 | 296 | 294 |
| Dublin 16 | 265 | 264 | 267 | 267 | 281 | 266 | 259 | 252 | 261 | 261 | 261 | 272 | 265 |
| Dublin 17 | 258 | 257 | 258 | 240 | 280 | 259 | 287 | 261 | 257 | 281 | 283 | 305 | 270 |
| Dublin 18 | 288 | 287 | 290 | 290 | 304 | 285 | 271 | 271 | 281 | 285 | 285 | 296 | 286 |
| Dublin 20 | 227 | 238 | 236 | 239 | 246 | 241 | 233 | 233 | 234 | 230 | 235 | 236 | 236 |
| Dublin 22 | 253 | 252 | 259 | 261 | 278 | 259 | 259 | 252 | 256 | 261 | 261 | 269 | 259 |
| Dublin 24 | 281 | 272 | 277 | 273 | 274 | 274 | 257 | 254 | 275 | 284 | 283 | 280 | 273 |
| Total | 256 | 257 | 260 | 260 | 270 | 260 | 257 | 250 | 257 | 259 | 258 | 263 | 259 |
| Table 5C Domestic Metered Public Water Consumption by Dublin Postal District and Month, 2017 (Meters) | |||||||||||||
| Number of meters | |||||||||||||
| Dublin Postal District | January | February | March | April | May | June | July | August | September | October | November | December | Total |
| Dublin 01 | 118 | 118 | 118 | 118 | 120 | 120 | 120 | 120 | 120 | 120 | 120 | 120 | 120 |
| Dublin 02 | 233 | 233 | 233 | 232 | 232 | 232 | 232 | 232 | 232 | 232 | 232 | 232 | 233 |
| Dublin 03 | 6,954 | 7,003 | 7,004 | 6,999 | 7,047 | 7,046 | 7,044 | 7,044 | 7,043 | 7,037 | 7,037 | 7,034 | 7,058 |
| Dublin 04 | 6,299 | 6,499 | 6,504 | 6,489 | 6,488 | 6,489 | 6,489 | 6,527 | 6,528 | 6,526 | 6,522 | 6,520 | 6,554 |
| Dublin 05 | 8,454 | 8,501 | 8,501 | 8,496 | 8,536 | 8,536 | 8,535 | 8,535 | 8,536 | 8,509 | 8,511 | 8,510 | 8,549 |
| Dublin 06 | 6,586 | 6,616 | 6,626 | 6,625 | 6,659 | 6,659 | 6,660 | 6,696 | 6,702 | 6,697 | 6,689 | 6,689 | 6,724 |
| Dublin 06W | 7,176 | 7,221 | 7,222 | 7,222 | 7,265 | 7,265 | 7,265 | 7,262 | 7,263 | 7,261 | 7,252 | 7,252 | 7,270 |
| Dublin 07 | 10,625 | 10,664 | 10,664 | 10,645 | 10,646 | 10,646 | 10,646 | 10,646 | 10,646 | 10,646 | 10,646 | 10,646 | 10,667 |
| Dublin 08 | 1,200 | 1,219 | 1,219 | 1,218 | 1,229 | 1,229 | 1,227 | 1,228 | 1,227 | 1,226 | 1,224 | 1,224 | 1,236 |
| Dublin 09 | 12,545 | 12,585 | 12,585 | 12,579 | 12,606 | 12,603 | 12,595 | 12,601 | 12,601 | 12,578 | 12,575 | 12,567 | 12,625 |
| Dublin 11 | 4,417 | 4,483 | 4,485 | 4,481 | 4,506 | 4,506 | 4,505 | 4,506 | 4,507 | 4,501 | 4,501 | 4,501 | 4,513 |
| Dublin 12 | 3,000 | 3,018 | 3,018 | 3,019 | 3,037 | 3,037 | 3,035 | 3,032 | 3,031 | 3,030 | 3,025 | 3,025 | 3,039 |
| Dublin 13 | 3,026 | 3,226 | 3,225 | 3,220 | 3,240 | 3,240 | 3,240 | 3,239 | 3,237 | 3,214 | 3,215 | 3,214 | 3,253 |
| Dublin 14 | 11,520 | 11,607 | 11,615 | 11,610 | 11,620 | 11,619 | 11,619 | 11,610 | 11,607 | 11,606 | 11,568 | 11,564 | 11,650 |
| Dublin 15 | 26,954 | 27,990 | 28,004 | 27,822 | 27,827 | 27,827 | 27,827 | 27,826 | 27,825 | 27,824 | 27,824 | 27,824 | 28,021 |
| Dublin 16 | 13,446 | 13,549 | 13,548 | 13,551 | 13,572 | 13,573 | 13,574 | 13,570 | 13,571 | 13,568 | 13,558 | 13,560 | 13,593 |
| Dublin 17 | 86 | 86 | 86 | 86 | 86 | 86 | 86 | 86 | 86 | 86 | 86 | 86 | 86 |
| Dublin 18 | 8,961 | 9,070 | 9,071 | 9,070 | 9,085 | 9,085 | 9,085 | 9,081 | 9,080 | 9,074 | 9,072 | 9,068 | 9,091 |
| Dublin 20 | 2,743 | 2,756 | 2,756 | 2,756 | 2,754 | 2,754 | 2,753 | 2,754 | 2,754 | 2,754 | 2,744 | 2,744 | 2,760 |
| Dublin 22 | 803 | 806 | 806 | 805 | 812 | 812 | 811 | 810 | 810 | 810 | 809 | 808 | 813 |
| Dublin 24 | 421 | 445 | 445 | 446 | 450 | 449 | 449 | 449 | 449 | 449 | 449 | 449 | 450 |
| Total | 135,567 | 137,695 | 137,735 | 137,489 | 137,817 | 137,813 | 137,797 | 137,854 | 137,855 | 137,748 | 137,659 | 137,637 | 138,305 |
| Table 6 Domestic Metered Public Water Consumption, 2014-2017 | |||||
| Year | Number of meters | Average days | Total consumption (Cubic metres) | Average (Litres per meter per day) | Median (Litres per meter per day) |
| 2014 | 497,238 | 138 | 26,074,257 | 381 | 246 |
| 2015 | 771,348 | 314 | 92,926,702 | 383 | 246 |
| 2016 | 691,453 | 355 | 86,099,876 | 351 | 249 |
| 2017 | 707,854 | 361 | 91,679,587 | 359 | 256 |
The data used to compile this release were received by the CSO from Irish Water in response to a request made under the Statistics Act, 1993.
All figures are subject to revision. Water meters can store data for previous readings and they are typically read using drive-by technology. Not all meters may have been read for the full release period e.g. if the last data collection for an area was done during December then data for December will not be available until the meter is read again and the data are made available to the CSO. Therefore a full year's data may not be available for some meters.
This release is based on meter readings. To calculate consumption for any meters that were not read on the 31st December of the year being published, the CSO uses meter readings from the subsequent year as soon as they become available. It is hoped to publish 2018 data in the coming months.
Table 2 in the release examines the impact of using consumption thresholds to exclude data that are unusually high. These thresholds show the substantial impact that high usage has on the average consumption figures. Typically, high consumption is due to a leak.
The difference between the average and the median gives an indication of the extent of high consumption as the median is less influenced by the small number of meters with very high consumption. In Table 2 the median is calculated from annual 2017 data for a meter whereas in Tables 1, 4B, 5B and 6 it is calculated from monthly data.
The data used in this release only cover metered usage. Apartments, many group water schemes, and abstractions from wells are not included. The 2017 data are based on 707,854 meters. Data from meters are included provided a full month’s data could be calculated from the meter readings. Some meters may not have been read during 2017.
Irish Water provided monthly files of meter readings to the CSO. The files contained both meter readings and derived consumption data. The dates of the meter readings are generally from a date that is at the end of the month but readings can also occur on other days of the month and in some cases a meter may not have been read in a particular month.
In a small number of cases, a meter was read more than twice in a month. In these cases the CSO has used the first and last readings in a month to calculate monthly consumption.
Meter readings that were irregular in the series, e.g. readings lower than previous readings, have been excluded. Before excluding any readings, the CSO has examined in detail the series of readings for meters where there was a decrease of 500 cubic metres or more between two readings. The higher reading was excluded if it was the irregular reading in the series.
The CSO has converted the readings into monthly usage figures by allocating the difference in two readings proportionately between the dates that the meters were read. Months with partial data have been excluded e.g. if the last reading for a meter was before 31st December, and there were no meter readings available yet from the following year, then that month was excluded.
The meter readings are in cubic metres. One cubic metre equals one thousand litres. The readings in cubic metres have been converted to average and median consumption in litres per meter per day. In Table 1, the data were converted into average and median consumption per meter per day in each month.
There was a relatively small number of meters installed in Dublin 17 and Dublin 24. No meter data were available for Dublin 10.
 Hide Background Notes
Scan the QR code below to view this release online or go to
http://www.cso.ie/en/releasesandpublications/er/dmwc/domesticmeteredpublicwaterconsumption2017/
 Show Table 1 Domestic Metered Public Water Consumption by Month, 2017
 Hide Table 1 Domestic Metered Public Water Consumption by Month, 2017