
| % of row | |||||||
| Period of construction | Energy rating | ||||||
| A | B | C | D | E | F-G | Total | |
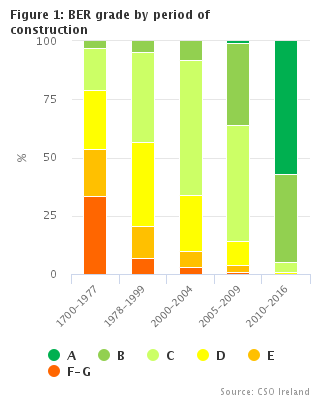
| 1700-1977 | 0 | 3 | 18 | 25 | 20 | 33 | 197,007 |
| 1978-1999 | 0 | 5 | 39 | 37 | 14 | 7 | 197,016 |
| 2000-2004 | 0 | 8 | 58 | 24 | 7 | 3 | 118,804 |
| 2005-2009 | 1 | 35 | 50 | 10 | 3 | 1 | 116,479 |
| 2010-2016 | 57 | 38 | 4 | 1 | 0 | 0 | 15,954 |
In the third quarter of 2016 a total of 21,701 Building Energy Rating (BER) audits were conducted on dwellings, bringing the cumulative total of BER audits conducted since January 2009 to 702,489.
The number of BER audits carried out in Quarter 3 2016 represents a reduction of over 8% in audits carried out compared with the same period in 2015. Overall the number of BER audits carried out in the first 9 months of 2016 has decreased by almost 6% compared with 2015, see Table 1.
62% of dwellings audited since 2009 are rated either "C" or "D", with just 2% of all dwellings assessed given an "A" rating. However, 57% of dwellings built since 2010 are "A" rated, see Table 2.
Detached houses are the most common dwelling type being audited; they are closely followed by Semi-detached houses. Both represent approximately 26% each of the total audits carried out, see Table 3.
The average age of a dwelling nationally is 31 years old, Cork city has the oldest dwellings on average at 43 years, while Kildare has the lowest average age of dwellings at 24 years, see Table 4.
In Dublin city specifically, while the average age is 36 years old, Dublin 6 has the oldest dwellings (averaging 57 years old), while Dublin 15 and Dublin 18 have newer dwellings with an average age of 17 years, see Table 5.
Dublin 18 has the highest percentage of "A" and "B" rated dwellings in Dublin city with 38%, while Dublin 7 has the lowest with 3%. Dublin 7 also has the highest percentage (47%) of the lowest rated dwellings ("E","F","G") , see Table 5.
The majority of dwellings are either using Oil or Mains Gas for their main heating purposes (39% each). Dwellings using Mains Gas for their heating are more likely to be rated "A" or "B" (19%) when compared with dwellings using Oil (9%). 47% of all of the dwellings where the main space heating is Electricity are rated "E","F", or "G". These dwellings make up 15% of the overall total dwellings assessed, see Table 6.
| A | B | C | D | E | F | G | |
| 01 Mains Gas | 2 | 17 | 44 | 22 | 9 | 4 | 2 |
| 02 Heating Oil | 0 | 9 | 43 | 28 | 11 | 5 | 5 |
| 03 Electricity | 3 | 3 | 16 | 31 | 21 | 8 | 18 |
| 04 Solid Fuel | 0 | 2 | 4 | 19 | 27 | 16 | 33 |
| 05 LPG | 1 | 24 | 51 | 16 | 5 | 2 | 2 |
| National | 1 | 11 | 37 | 25 | 12 | 5 | 7 |
The county with the highest percentage of solid fuel usage was Offaly (25%). Solid fuel was the main space heating type in 6% of BER audited dwellings country-wide. Donegal had the highest proportion of dwellings using heating oil (81%). Dublin City (01-24) used heating oil less than any other area, with just 6% of dwellings. They were followed by Cork City with 10% of households using Heating Oil and Dublin County with 12%, see Table 8.
The largest number of dwellings audited were those that were constructed during the years 2000 to 2004, these comprised 19% of the total audits carried out. These dwellings were most likely to be heated by mains Gas (38%). Electricity is also an important space heating source, particularly in dwellings built in the period 1994-2004 when just over 1 in 5 (21%) dwellings built at that time rely on electricity for their main space heating requirements. In dwellings constructed before 1949, 10% of the dwellings use solid fuel as the main space heating source, see Table 9.
Electricity is the main space heating fuel used in most types of apartments that were audited. 58% of mid floor apartments heated their dwellings using electricity. Semi-detached and terraced houses used Mains Gas as their main space heating source, (47% and 59% respectively) , see Table 10.
| A | B | C | D | E | F | G | |
| Carlow | 1 | 10 | 40 | 26 | 11 | 5 | 7 |
| Cavan | 0 | 11 | 43 | 21 | 11 | 5 | 8 |
| Clare | 0 | 8 | 38 | 27 | 14 | 5 | 8 |
| Cork City | 1 | 13 | 36 | 24 | 13 | 5 | 8 |
| Cork County | 1 | 16 | 41 | 21 | 9 | 4 | 8 |
| Donegal | 0 | 9 | 43 | 24 | 11 | 5 | 8 |
| Dublin 01-24 | 2 | 12 | 32 | 26 | 15 | 7 | 7 |
| Dublin County | 5 | 14 | 37 | 25 | 11 | 4 | 4 |
| Galway City | 0 | 6 | 35 | 32 | 15 | 6 | 5 |
| Galway County | 1 | 9 | 40 | 25 | 12 | 5 | 8 |
| Kerry | 1 | 11 | 37 | 26 | 13 | 5 | 8 |
| Kildare | 4 | 11 | 41 | 26 | 10 | 4 | 5 |
| Kilkenny | 1 | 10 | 38 | 26 | 11 | 5 | 9 |
| Laois | 0 | 12 | 39 | 22 | 12 | 6 | 9 |
| Leitrim | 0 | 8 | 38 | 23 | 12 | 7 | 11 |
| Limerick City | 0 | 5 | 40 | 30 | 12 | 6 | 7 |
| Limerick County | 1 | 8 | 40 | 28 | 12 | 5 | 7 |
| Longford | 0 | 9 | 35 | 26 | 13 | 7 | 9 |
| Louth | 1 | 14 | 43 | 23 | 9 | 4 | 6 |
| Mayo | 1 | 7 | 37 | 27 | 12 | 6 | 10 |
| Meath | 2 | 12 | 45 | 22 | 9 | 4 | 5 |
| Monaghan | 1 | 11 | 36 | 27 | 12 | 5 | 8 |
| Offaly | 0 | 6 | 33 | 22 | 18 | 9 | 11 |
| Roscommon | 0 | 7 | 41 | 22 | 12 | 6 | 12 |
| Sligo | 1 | 9 | 34 | 26 | 15 | 6 | 9 |
| Tipperary | 0 | 6 | 35 | 27 | 14 | 7 | 11 |
| Waterford City | 1 | 8 | 38 | 31 | 12 | 4 | 6 |
| Waterford County | 1 | 9 | 39 | 29 | 11 | 5 | 6 |
| Westmeath | 0 | 10 | 37 | 25 | 12 | 6 | 10 |
| Wexford | 1 | 7 | 38 | 28 | 13 | 5 | 8 |
| Wicklow | 3 | 10 | 36 | 24 | 13 | 6 | 8 |
| National | 1 | 11 | 37 | 25 | 12 | 5 | 7 |
In dwellings that have had more than one assessment carried out, 22% of dwellings originally had either an "F" or a "G" rating. In the latest assessment carried out just 5% of dwellings had an "F" or a "G" rating. In the earliest assessment only 6% had a rating of "A" or "B", while in the most recent assessment 17% of dwellings achieved an "A" or "B" rating, see Table 14.
Detached houses are the largest dwelling types (156 sq metres) , the average size of detached houses has increased in every construction period since 1929. Detached houses built since 2010 have the largest average floor area of 209 sq metres. This is almost 3 times the size of an average mid floor apartment built in the same period (72 sq metres), see Table 11.
| Apartment | House | All | |
| 1700-1899 | 56 | 135 | 118 |
| 1900-1929 | 52 | 109 | 100 |
| 1930-1949 | 53 | 101 | 97 |
| 1950-1966 | 59 | 107 | 104 |
| 1967-1977 | 60 | 112 | 109 |
| 1978-1982 | 61 | 112 | 109 |
| 1983-1993 | 58 | 115 | 108 |
| 1994-1999 | 63 | 124 | 110 |
| 2000-2004 | 73 | 130 | 114 |
| 2005-2009 | 75 | 134 | 111 |
| 2010-2016 | 77 | 153 | 140 |
| Table 1 Domestic Building Energy Ratings Certificates 1 | |||||||||
| number | |||||||||
| Period | 2009 | 2010 | 2011 | 2012 | 2013 | 2014 | 2015 | 2016 | Total |
| January | 4,101 | 4,669 | 8,563 | 6,523 | 6,967 | 7,004 | 6,519 | 5,294 | 49,640 |
| February | 6,321 | 5,614 | 9,020 | 6,304 | 8,524 | 7,540 | 7,657 | 6,947 | 57,927 |
| March | 8,766 | 6,153 | 8,939 | 6,508 | 8,206 | 8,385 | 7,261 | 7,608 | 61,826 |
| April | 8,033 | 5,484 | 7,780 | 4,438 | 8,297 | 8,732 | 7,586 | 7,448 | 57,798 |
| May | 7,926 | 5,476 | 8,870 | 5,872 | 8,646 | 8,729 | 7,714 | 7,998 | 61,231 |
| June | 8,729 | 5,737 | 7,459 | 4,865 | 7,261 | 8,218 | 8,000 | 7,496 | 57,765 |
| July | 8,775 | 5,971 | 7,253 | 5,535 | 7,096 | 9,394 | 7,676 | 6,666 | 58,366 |
| August | 7,271 | 6,457 | 7,531 | 5,047 | 6,973 | 8,163 | 7,649 | 7,128 | 56,219 |
| September | 7,519 | 7,425 | 8,871 | 4,976 | 8,281 | 9,920 | 8,358 | 7,907 | 63,257 |
| October | 6,591 | 8,402 | 9,568 | 6,686 | 8,980 | 10,774 | 9,222 | 60,223 | |
| November | 6,975 | 11,617 | 9,623 | 8,820 | 9,609 | 10,900 | 8,420 | 65,964 | |
| December | 6,348 | 8,042 | 9,481 | 6,368 | 6,940 | 7,780 | 7,314 | 52,273 | |
| Total | 87,355 | 81,047 | 102,958 | 71,942 | 95,780 | 105,539 | 93,376 | 64,492 | 702,489 |
| 1 Includes all Certificates for Dwellings | |||||||||
| Table 2 BER Ratings by Period of Construction | ||||||||||||||
| % of row | ||||||||||||||
| Period of Construction | Energy Rating | Total | ||||||||||||
| A | B1 | B2 | B3 | C1 | C2 | C3 | D1 | D2 | E1 | E2 | F | G | ||
| 1700-1899 | 0 | 0 | 1 | 2 | 2 | 3 | 4 | 7 | 10 | 9 | 10 | 14 | 38 | 16,622 |
| 1900-1929 | 0 | 0 | 1 | 2 | 2 | 3 | 4 | 7 | 10 | 9 | 10 | 14 | 37 | 34,466 |
| 1930-1949 | 0 | 0 | 1 | 3 | 4 | 5 | 7 | 9 | 12 | 10 | 10 | 13 | 26 | 31,389 |
| 1950-1966 | 0 | 0 | 1 | 3 | 4 | 6 | 8 | 12 | 14 | 11 | 11 | 13 | 18 | 49,126 |
| 1967-1977 | 0 | 0 | 1 | 3 | 6 | 9 | 12 | 16 | 17 | 11 | 9 | 9 | 8 | 65,404 |
| 1978-1982 | 0 | 0 | 1 | 3 | 8 | 12 | 15 | 18 | 18 | 10 | 6 | 5 | 3 | 44,730 |
| 1983-1993 | 0 | 0 | 1 | 4 | 9 | 13 | 16 | 20 | 18 | 9 | 5 | 4 | 3 | 73,561 |
| 1994-1999 | 0 | 0 | 1 | 4 | 9 | 15 | 18 | 21 | 15 | 7 | 5 | 4 | 2 | 78,725 |
| 2000-2004 | 0 | 0 | 1 | 7 | 15 | 22 | 21 | 15 | 9 | 4 | 3 | 2 | 1 | 118,804 |
| 2005-2009 | 1 | 3 | 11 | 21 | 23 | 17 | 9 | 6 | 4 | 2 | 1 | 1 | 0 | 116,479 |
| 2010-2016 | 57 | 21 | 11 | 6 | 2 | 1 | 1 | 0 | 0 | 0 | 0 | 0 | 0 | 15,954 |
| Total | 2 | 1 | 3 | 7 | 11 | 13 | 13 | 13 | 12 | 7 | 5 | 5 | 7 | 645,260 |
| Table 3 BER Ratings by Type of Dwelling | ||||||||||||||
| % of row | ||||||||||||||
| Dwelling Type | Energy Rating | Total | ||||||||||||
| A | B1 | B2 | B3 | C1 | C2 | C3 | D1 | D2 | E1 | E2 | F | G | ||
| Apartment | 1 | 4 | 11 | 13 | 12 | 7 | 10 | 10 | 10 | 6 | 5 | 5 | 6 | 4,409 |
| Ground-floor apartment | 1 | 1 | 3 | 8 | 10 | 10 | 10 | 12 | 14 | 10 | 8 | 6 | 7 | 36,906 |
| Mid-floor apartment | 1 | 5 | 11 | 12 | 11 | 12 | 12 | 12 | 9 | 5 | 3 | 3 | 3 | 44,917 |
| Top-floor apartment | 1 | 1 | 4 | 8 | 10 | 9 | 9 | 12 | 15 | 10 | 7 | 6 | 10 | 38,117 |
| Basement Dwelling | 2 | 3 | 6 | 2 | 8 | 7 | 8 | 12 | 10 | 9 | 32 | 181 | ||
| Maisonette | 1 | 2 | 7 | 11 | 13 | 11 | 10 | 11 | 13 | 6 | 4 | 5 | 8 | 6,580 |
| House | 1 | 2 | 3 | 9 | 12 | 14 | 14 | 13 | 11 | 5 | 4 | 4 | 8 | 38,200 |
| Detached house | 1 | 1 | 2 | 7 | 11 | 13 | 14 | 13 | 11 | 6 | 5 | 6 | 10 | 169,590 |
| Semi-detached house | 2 | 1 | 1 | 5 | 11 | 15 | 16 | 15 | 12 | 7 | 5 | 5 | 5 | 168,123 |
| End of terrace house | 2 | 1 | 1 | 5 | 10 | 13 | 13 | 13 | 12 | 7 | 6 | 7 | 9 | 46,157 |
| Mid-terrace house | 1 | 1 | 2 | 8 | 13 | 13 | 11 | 12 | 11 | 7 | 6 | 6 | 8 | 92,080 |
| Total | 2 | 1 | 3 | 7 | 11 | 13 | 13 | 13 | 12 | 7 | 5 | 5 | 7 | 645,260 |
| Table 4 BER Ratings by County | |||||||||||||||
| % of row | |||||||||||||||
| County | Energy Rating | Average age | |||||||||||||
| A | B1 | B2 | B3 | C1 | C2 | C3 | D1 | D2 | E1 | E2 | F | G | Total | ||
| Carlow | 1 | 1 | 2 | 7 | 12 | 14 | 14 | 15 | 11 | 6 | 5 | 5 | 7 | 9,149 | 28 |
| Dublin 01-24 | 2 | 2 | 4 | 7 | 10 | 11 | 11 | 13 | 13 | 8 | 6 | 6 | 7 | 142,832 | 36 |
| Dublin County | 6 | 2 | 4 | 8 | 11 | 13 | 13 | 13 | 11 | 6 | 5 | 4 | 4 | 45,431 | 28 |
| Kildare | 4 | 1 | 3 | 8 | 12 | 14 | 15 | 15 | 11 | 6 | 4 | 4 | 5 | 24,893 | 24 |
| Kilkenny | 1 | 1 | 2 | 7 | 12 | 13 | 13 | 14 | 12 | 7 | 5 | 5 | 9 | 10,997 | 34 |
| Laois | 0 | 1 | 2 | 8 | 10 | 15 | 14 | 12 | 9 | 6 | 6 | 6 | 9 | 10,302 | 29 |
| Longford | 0 | 1 | 2 | 7 | 11 | 12 | 12 | 15 | 11 | 7 | 6 | 7 | 9 | 5,712 | 26 |
| Louth | 1 | 2 | 3 | 8 | 14 | 15 | 14 | 13 | 10 | 6 | 4 | 4 | 6 | 17,348 | 31 |
| Meath | 2 | 1 | 3 | 8 | 14 | 17 | 15 | 13 | 9 | 5 | 4 | 4 | 5 | 19,936 | 25 |
| Offaly | 0 | 1 | 1 | 4 | 8 | 12 | 12 | 11 | 11 | 9 | 9 | 9 | 11 | 8,790 | 33 |
| Westmeath | 0 | 1 | 3 | 7 | 10 | 12 | 15 | 14 | 11 | 6 | 5 | 6 | 10 | 12,292 | 29 |
| Wexford | 1 | 1 | 2 | 5 | 9 | 14 | 15 | 15 | 13 | 8 | 5 | 5 | 8 | 21,574 | 27 |
| Wicklow | 3 | 1 | 3 | 7 | 11 | 12 | 12 | 13 | 11 | 7 | 6 | 6 | 8 | 18,133 | 32 |
| Clare | 0 | 0 | 1 | 6 | 9 | 13 | 15 | 15 | 13 | 8 | 6 | 5 | 8 | 18,168 | 31 |
| Cork City | 1 | 1 | 4 | 8 | 12 | 12 | 12 | 12 | 12 | 7 | 5 | 5 | 8 | 14,734 | 43 |
| Cork County | 1 | 2 | 4 | 11 | 15 | 14 | 12 | 11 | 10 | 5 | 4 | 4 | 8 | 58,983 | 32 |
| Kerry | 1 | 1 | 3 | 7 | 11 | 13 | 13 | 14 | 12 | 7 | 5 | 5 | 8 | 21,583 | 28 |
| Limerick City | 1 | 0 | 1 | 4 | 11 | 14 | 15 | 15 | 14 | 7 | 5 | 6 | 7 | 10,459 | 35 |
| Limerick County | 1 | 0 | 2 | 6 | 11 | 14 | 15 | 15 | 14 | 7 | 5 | 5 | 7 | 20,334 | 31 |
| Tipperary | 0 | 1 | 1 | 4 | 9 | 12 | 13 | 14 | 13 | 8 | 6 | 7 | 11 | 22,010 | 38 |
| Waterford City | 1 | 1 | 2 | 5 | 10 | 13 | 15 | 17 | 14 | 7 | 5 | 4 | 6 | 6,750 | 35 |
| Waterford County | 1 | 1 | 2 | 6 | 11 | 13 | 14 | 15 | 13 | 7 | 4 | 5 | 6 | 10,817 | 33 |
| Galway City | 0 | 1 | 2 | 4 | 8 | 12 | 16 | 17 | 15 | 8 | 6 | 6 | 5 | 9,231 | 25 |
| Galway County | 1 | 1 | 2 | 6 | 11 | 14 | 15 | 13 | 12 | 7 | 6 | 5 | 8 | 28,372 | 27 |
| Leitrim | 0 | 0 | 1 | 6 | 12 | 14 | 13 | 12 | 11 | 6 | 6 | 7 | 11 | 4,932 | 30 |
| Mayo | 1 | 1 | 2 | 5 | 8 | 13 | 16 | 14 | 13 | 7 | 5 | 6 | 10 | 17,367 | 30 |
| Roscommon | 0 | 0 | 1 | 5 | 11 | 14 | 15 | 12 | 11 | 7 | 5 | 6 | 12 | 7,626 | 30 |
| Sligo | 1 | 1 | 2 | 7 | 9 | 12 | 13 | 14 | 13 | 9 | 6 | 6 | 9 | 10,998 | 29 |
| Cavan | 0 | 1 | 2 | 8 | 14 | 16 | 13 | 12 | 9 | 6 | 5 | 5 | 8 | 9,879 | 26 |
| Donegal | 0 | 1 | 2 | 6 | 13 | 15 | 14 | 13 | 11 | 6 | 5 | 5 | 8 | 19,100 | 27 |
| Monaghan | 1 | 1 | 3 | 8 | 13 | 11 | 12 | 14 | 13 | 7 | 5 | 5 | 8 | 6,528 | 34 |
| Total | 2 | 1 | 3 | 7 | 11 | 13 | 13 | 13 | 12 | 7 | 5 | 5 | 7 | 645,260 | 31 |
| Table 5 BER Ratings by Dublin Postal District | |||||||||||||||
| % of row | |||||||||||||||
| County | Energy Rating | Average age | |||||||||||||
| A | B1 | B2 | B3 | C1 | C2 | C3 | D1 | D2 | E1 | E2 | F | G | Total | ||
| Dublin 1 | 2 | 2 | 6 | 7 | 9 | 10 | 11 | 13 | 14 | 9 | 6 | 5 | 7 | 6,440 | 29 |
| Dublin 2 | 1 | 4 | 7 | 6 | 8 | 10 | 12 | 13 | 12 | 9 | 6 | 6 | 7 | 3,542 | 35 |
| Dublin 3 | 1 | 0 | 2 | 5 | 7 | 8 | 9 | 11 | 12 | 10 | 9 | 11 | 14 | 6,088 | 54 |
| Dublin 4 | 1 | 1 | 4 | 7 | 9 | 9 | 10 | 13 | 14 | 9 | 7 | 8 | 8 | 7,927 | 43 |
| Dublin 5 | 0 | 1 | 2 | 5 | 7 | 9 | 11 | 16 | 14 | 10 | 9 | 8 | 6 | 5,922 | 42 |
| Dublin 6 | 1 | 1 | 3 | 4 | 6 | 6 | 8 | 11 | 13 | 10 | 9 | 10 | 17 | 6,424 | 57 |
| Dublin 6W | 2 | 1 | 2 | 7 | 8 | 8 | 9 | 12 | 13 | 8 | 9 | 10 | 10 | 3,307 | 49 |
| Dublin 7 | 0 | 0 | 1 | 2 | 6 | 9 | 8 | 12 | 14 | 10 | 10 | 11 | 16 | 8,373 | 55 |
| Dublin 8 | 0 | 3 | 6 | 8 | 7 | 8 | 9 | 12 | 13 | 8 | 7 | 8 | 11 | 10,480 | 43 |
| Dublin 9 | 2 | 0 | 3 | 6 | 8 | 10 | 10 | 11 | 14 | 10 | 9 | 9 | 9 | 7,319 | 45 |
| Dublin 10 | 2 | 5 | 13 | 16 | 13 | 12 | 11 | 8 | 6 | 7 | 7 | 2,687 | 42 | ||
| Dublin 11 | 1 | 2 | 8 | 12 | 12 | 11 | 12 | 11 | 9 | 6 | 5 | 5 | 5 | 7,955 | 30 |
| Dublin 12 | 0 | 1 | 3 | 4 | 6 | 7 | 9 | 13 | 14 | 10 | 10 | 12 | 12 | 6,600 | 51 |
| Dublin 13 | 3 | 1 | 4 | 12 | 11 | 11 | 11 | 13 | 11 | 7 | 6 | 5 | 4 | 4,606 | 29 |
| Dublin 14 | 2 | 3 | 6 | 8 | 8 | 9 | 10 | 12 | 13 | 9 | 7 | 7 | 6 | 6,823 | 37 |
| Dublin 15 | 5 | 2 | 5 | 10 | 13 | 15 | 14 | 15 | 11 | 5 | 2 | 2 | 1 | 14,262 | 17 |
| Dublin 16 | 3 | 1 | 4 | 8 | 11 | 13 | 12 | 15 | 13 | 7 | 5 | 4 | 2 | 6,089 | 27 |
| Dublin 17 | 4 | 1 | 7 | 9 | 14 | 20 | 14 | 14 | 8 | 4 | 2 | 2 | 1 | 3,611 | 24 |
| Dublin 18 | 3 | 7 | 12 | 16 | 16 | 12 | 9 | 9 | 8 | 3 | 2 | 2 | 1 | 7,333 | 17 |
| Dublin 20 | 4 | 8 | 10 | 8 | 8 | 9 | 13 | 13 | 10 | 7 | 5 | 4 | 1,597 | 31 | |
| Dublin 22 | 0 | 0 | 1 | 3 | 8 | 13 | 14 | 18 | 19 | 10 | 6 | 4 | 3 | 4,859 | 26 |
| Dublin 24 | 1 | 1 | 2 | 5 | 12 | 15 | 15 | 16 | 14 | 8 | 6 | 4 | 2 | 10,586 | 22 |
| Total | 2 | 2 | 4 | 7 | 10 | 11 | 11 | 13 | 13 | 8 | 6 | 6 | 7 | 142,832 | 36 |
| Table 6 BER Ratings by Main Space Heating Fuel | ||||||||||||||
| % of row | ||||||||||||||
| Fuel Type | Energy Rating | Total | ||||||||||||
| A | B1 | B2 | B3 | C1 | C2 | C3 | D1 | D2 | E1 | E2 | F | G | ||
| Mains Gas | 2 | 2 | 5 | 10 | 15 | 16 | 14 | 13 | 9 | 5 | 4 | 4 | 2 | 247,943 |
| Bulk LPG | 1 | 2 | 6 | 17 | 21 | 18 | 13 | 9 | 6 | 3 | 2 | 1 | 1 | 9,325 |
| Bottled LPG | 0 | 1 | 3 | 8 | 13 | 15 | 12 | 12 | 13 | 5 | 4 | 5 | 11 | 828 |
| Heating Oil | 0 | 1 | 2 | 6 | 12 | 15 | 16 | 15 | 12 | 6 | 5 | 5 | 5 | 250,263 |
| Electricity | 3 | 1 | 1 | 1 | 3 | 5 | 8 | 13 | 17 | 12 | 9 | 8 | 18 | 92,513 |
| Coal | 0 | 0 | 0 | 1 | 1 | 4 | 13 | 14 | 14 | 18 | 35 | 3,540 | ||
| Smokeless Fuel | 0 | 0 | 0 | 0 | 1 | 3 | 13 | 15 | 15 | 19 | 34 | 4,351 | ||
| Peat | 0 | 0 | 1 | 1 | 3 | 10 | 13 | 13 | 16 | 42 | 1,403 | |||
| Wood Pellets & Chips | 3 | 6 | 13 | 21 | 13 | 14 | 10 | 6 | 4 | 3 | 2 | 2 | 2 | 1,202 |
| Wood Logs | 3 | 2 | 2 | 3 | 2 | 3 | 4 | 8 | 12 | 9 | 10 | 10 | 32 | 578 |
| Solid Multi-Fuel | 0 | 0 | 0 | 0 | 0 | 1 | 2 | 7 | 13 | 14 | 14 | 16 | 33 | 25,421 |
| Total | 1 | 1 | 3 | 7 | 11 | 13 | 13 | 13 | 12 | 7 | 5 | 5 | 7 | 637,367 |
| Table 7 BER Ratings by Main Water Heating Fuel | ||||||||||||||
| % of row | ||||||||||||||
| Fuel Type | Energy Rating | Total | ||||||||||||
| A | B1 | B2 | B3 | C1 | C2 | C3 | D1 | D2 | E1 | E2 | F | G | ||
| Mains Gas | 2 | 2 | 5 | 10 | 15 | 16 | 14 | 13 | 9 | 5 | 4 | 4 | 2 | 246,429 |
| Bulk LPG | 1 | 2 | 6 | 17 | 21 | 18 | 13 | 9 | 6 | 3 | 2 | 1 | 1 | 9,282 |
| Bottled LPG | 0 | 0 | 3 | 8 | 13 | 15 | 14 | 10 | 13 | 5 | 4 | 5 | 9 | 888 |
| Heating Oil | 0 | 1 | 2 | 6 | 12 | 15 | 16 | 16 | 12 | 6 | 5 | 5 | 5 | 248,371 |
| Electricity | 3 | 1 | 1 | 1 | 3 | 5 | 8 | 13 | 17 | 12 | 9 | 8 | 20 | 97,440 |
| Coal | 0 | 0 | 0 | 1 | 1 | 1 | 2 | 5 | 14 | 15 | 15 | 19 | 27 | 3,419 |
| Smokeless Fuel | 0 | 0 | 1 | 1 | 4 | 14 | 17 | 16 | 20 | 26 | 3,976 | |||
| Peat | 0 | 0 | 1 | 1 | 4 | 11 | 13 | 13 | 17 | 40 | 1,436 | |||
| Wood Pellets & Chips | 3 | 6 | 13 | 21 | 14 | 14 | 10 | 6 | 5 | 3 | 2 | 3 | 2 | 1,200 |
| Wood Logs | 2 | 2 | 2 | 3 | 3 | 3 | 5 | 10 | 13 | 9 | 9 | 10 | 28 | 529 |
| Solid Multi-Fuel | 0 | 0 | 0 | 0 | 0 | 1 | 2 | 7 | 14 | 15 | 15 | 17 | 29 | 24,397 |
| Total | 1 | 1 | 3 | 7 | 11 | 13 | 13 | 13 | 12 | 7 | 5 | 5 | 7 | 637,367 |
| Table 8 Main Space Heating Fuel by County | ||||||
| % of row | ||||||
| County | Fuel Type | Total | ||||
| Mains Gas | Heating Oil | Electricity | Solid Fuel | LPG | ||
| Carlow | 36 | 46 | 10 | 6 | 2 | 9,142 |
| Dublin 01-24 | 73 | 6 | 20 | 1 | 0 | 138,029 |
| Dublin County | 77 | 12 | 10 | 1 | 0 | 44,589 |
| Kildare | 47 | 38 | 10 | 3 | 1 | 24,787 |
| Kilkenny | 29 | 52 | 8 | 9 | 2 | 10,949 |
| Laois | 31 | 45 | 7 | 16 | 1 | 10,277 |
| Longford | 2 | 62 | 19 | 14 | 3 | 5,649 |
| Louth | 56 | 36 | 5 | 3 | 1 | 17,161 |
| Meath | 42 | 45 | 9 | 3 | 1 | 19,927 |
| Offaly | 9 | 55 | 9 | 25 | 1 | 8,690 |
| Westmeath | 14 | 54 | 15 | 14 | 3 | 12,251 |
| Wexford | 1 | 70 | 15 | 12 | 3 | 21,473 |
| Wicklow | 43 | 41 | 10 | 5 | 1 | 18,036 |
| Clare | 12 | 60 | 14 | 11 | 3 | 18,129 |
| Cork City | 71 | 10 | 17 | 2 | 0 | 14,591 |
| Cork County | 40 | 41 | 13 | 4 | 2 | 58,613 |
| Kerry | 1 | 65 | 19 | 10 | 5 | 21,491 |
| Limerick City | 55 | 20 | 21 | 4 | 0 | 10,327 |
| Limerick County | 28 | 49 | 14 | 9 | 1 | 20,253 |
| Tipperary | 13 | 65 | 9 | 12 | 1 | 21,933 |
| Waterford City | 62 | 14 | 20 | 3 | 0 | 6,734 |
| Waterford County | 24 | 53 | 14 | 7 | 2 | 10,763 |
| Galway City | 16 | 41 | 35 | 6 | 2 | 9,154 |
| Galway County | 7 | 67 | 16 | 7 | 3 | 28,294 |
| Leitrim | 0 | 66 | 16 | 12 | 6 | 4,930 |
| Mayo | 3 | 72 | 13 | 9 | 3 | 17,332 |
| Roscommon | 3 | 73 | 11 | 9 | 4 | 7,625 |
| Sligo | 1 | 62 | 22 | 9 | 5 | 10,980 |
| Cavan | 9 | 69 | 10 | 8 | 4 | 9,810 |
| Donegal | 0 | 81 | 9 | 6 | 4 | 18,957 |
| Monaghan | 8 | 73 | 8 | 8 | 3 | 6,491 |
| Total | 39 | 39 | 15 | 6 | 2 | 637,367 |
| Table 9 Main Space Heating Fuel by Period of Construction | ||||||
| % of row | ||||||
| Period of Construction | Fuel Type | Total | ||||
| Mains Gas | Heating Oil | Electricity | Solid Fuel | LPG | ||
| 1700-1899 | 29 | 38 | 22 | 10 | 1 | 16,213 |
| 1900-1929 | 31 | 39 | 19 | 10 | 1 | 33,996 |
| 1930-1949 | 42 | 39 | 9 | 10 | 1 | 31,332 |
| 1950-1966 | 45 | 41 | 6 | 7 | 1 | 48,983 |
| 1967-1977 | 37 | 51 | 4 | 7 | 1 | 64,807 |
| 1978-1982 | 35 | 52 | 4 | 8 | 1 | 44,521 |
| 1983-1993 | 34 | 46 | 11 | 8 | 2 | 73,112 |
| 1994-1999 | 33 | 38 | 22 | 6 | 1 | 78,245 |
| 2000-2004 | 38 | 36 | 20 | 4 | 2 | 118,030 |
| 2005-2009 | 47 | 29 | 18 | 2 | 4 | 113,119 |
| 2010-2016 | 59 | 19 | 19 | 1 | 2 | 15,009 |
| Total | 39 | 39 | 15 | 6 | 2 | 637,367 |
| Table 10 Main Space Heating Fuel by Type of Dwelling | ||||||
| % of row | ||||||
| Dwelling Type | Fuel Type | Total | ||||
| Mains Gas | Heating Oil | Electricity | Solid Fuel | LPG | ||
| Apartment | 46 | 4 | 47 | 1 | 2 | 4,153 |
| Ground-floor apartment | 47 | 7 | 43 | 1 | 2 | 35,300 |
| Mid-floor apartment | 40 | 1 | 58 | 1 | 1 | 41,622 |
| Top-floor apartment | 42 | 3 | 53 | 1 | 2 | 36,363 |
| Basement Dwelling | 27 | 9 | 62 | 2 | 1 | 164 |
| Maisonette | 52 | 7 | 37 | 2 | 3 | 6,495 |
| House | 18 | 70 | 5 | 5 | 3 | 38,180 |
| Detached house | 15 | 71 | 5 | 6 | 2 | 169,451 |
| Semi-detached house | 47 | 40 | 4 | 8 | 1 | 167,900 |
| End of terrace house | 59 | 25 | 8 | 7 | 1 | 45,993 |
| Mid-terrace house | 60 | 22 | 9 | 7 | 1 | 91,746 |
| Total | 39 | 39 | 15 | 6 | 2 | 637,367 |
| Table 11 Average Floor Area by Period of Construction and Type of Dwelling | ||||||||||||
| m2 | ||||||||||||
| Period | Apartment | Ground-floor apartment | Mid-floor apartment | Top-floor apartment | Basement Dwelling | Maisonette | House | Detached house | Semi-detached house | End of terrace house | Mid-terrace house | All dwelling types |
| 1700-1899 | 69 | 53 | 46 | 56 | 54 | 107 | 148 | 158 | 145 | 115 | 106 | 118 |
| 1900-1929 | 64 | 51 | 44 | 54 | 43 | 90 | 119 | 124 | 120 | 97 | 90 | 100 |
| 1930-1949 | 51 | 60 | 45 | 51 | 52 | 74 | 110 | 120 | 110 | 84 | 82 | 97 |
| 1950-1966 | 70 | 64 | 54 | 55 | 58 | 63 | 116 | 125 | 113 | 88 | 86 | 104 |
| 1967-1977 | 66 | 64 | 59 | 55 | 110 | 63 | 132 | 139 | 108 | 84 | 84 | 109 |
| 1978-1982 | 63 | 65 | 63 | 55 | 100 | 66 | 137 | 142 | 96 | 84 | 82 | 109 |
| 1983-1993 | 58 | 58 | 55 | 57 | 58 | 70 | 146 | 149 | 95 | 82 | 80 | 108 |
| 1994-1999 | 67 | 63 | 58 | 67 | 60 | 76 | 152 | 161 | 101 | 83 | 83 | 110 |
| 2000-2004 | 74 | 71 | 69 | 77 | 64 | 89 | 166 | 177 | 103 | 95 | 91 | 114 |
| 2005-2009 | 81 | 72 | 72 | 78 | 95 | 96 | 169 | 191 | 106 | 100 | 97 | 111 |
| 2010-2016 | 81 | 78 | 72 | 77 | 86 | 105 | 194 | 209 | 125 | 124 | 115 | 140 |
| All | 76 | 67 | 66 | 70 | 59 | 86 | 147 | 156 | 105 | 91 | 88 | 110 |
| Table 12 Average Primary Energy Use by Period of Construction and Type of Dwelling | ||||||||||||
| kWh/m2/year | ||||||||||||
| Period | Apartment | Ground-floor apartment | Mid-floor apartment | Top-floor apartment | Basement Dwelling | Maisonette | House | Detached house | Semi-detached house | End of terrace house | Mid-terrace house | All dwelling types |
| 1700-1899 | 432 | 426 | 390 | 490 | 399 | 477 | 416 | 412 | 387 | 419 | 367 | 403 |
| 1900-1929 | 475 | 428 | 443 | 506 | 376 | 448 | 415 | 420 | 389 | 424 | 381 | 410 |
| 1930-1949 | 363 | 354 | 284 | 420 | 485 | 453 | 377 | 402 | 349 | 375 | 331 | 366 |
| 1950-1966 | 415 | 333 | 299 | 394 | 515 | 314 | 338 | 355 | 311 | 343 | 305 | 329 |
| 1967-1977 | 386 | 318 | 261 | 367 | 311 | 330 | 291 | 299 | 285 | 284 | 258 | 288 |
| 1978-1982 | 333 | 289 | 246 | 294 | 309 | 303 | 246 | 253 | 258 | 247 | 225 | 251 |
| 1983-1993 | 345 | 304 | 256 | 301 | 314 | 284 | 228 | 234 | 247 | 249 | 226 | 241 |
| 1994-1999 | 282 | 282 | 241 | 284 | 258 | 262 | 207 | 209 | 232 | 254 | 230 | 226 |
| 2000-2004 | 253 | 243 | 208 | 243 | 291 | 214 | 189 | 193 | 215 | 221 | 196 | 206 |
| 2005-2009 | 170 | 189 | 162 | 192 | 186 | 164 | 152 | 163 | 176 | 172 | 157 | 168 |
| 2010-2016 | 123 | 102 | 85 | 104 | 132 | 87 | 99 | 85 | 69 | 71 | 70 | 80 |
| All | 222 | 252 | 200 | 259 | 333 | 233 | 233 | 244 | 243 | 264 | 255 | 244 |
| Table 13 Average Carbon Dioxide Emissions by Period of Construction and Type of Dwelling | ||||||||||||
| kgCO2/m2/year | ||||||||||||
| Period | Apartment | Ground-floor apartment | Mid-floor apartment | Top-floor apartment | Basement Dwelling | Maisonette | House | Detached house | Semi-detached house | End of terrace house | Mid-terrace house | All dwelling types |
| 1700-1899 | 101 | 97 | 86 | 112 | 85 | 112 | 107 | 106 | 94 | 101 | 86 | 100 |
| 1900-1929 | 113 | 98 | 99 | 114 | 82 | 107 | 107 | 110 | 94 | 101 | 89 | 101 |
| 1930-1949 | 85 | 81 | 61 | 93 | 107 | 105 | 96 | 104 | 83 | 87 | 77 | 89 |
| 1950-1966 | 98 | 74 | 64 | 85 | 113 | 67 | 85 | 90 | 71 | 78 | 69 | 78 |
| 1967-1977 | 92 | 71 | 55 | 80 | 77 | 77 | 73 | 74 | 66 | 67 | 60 | 69 |
| 1978-1982 | 80 | 66 | 53 | 64 | 77 | 71 | 61 | 63 | 62 | 57 | 52 | 61 |
| 1983-1993 | 83 | 69 | 57 | 68 | 69 | 65 | 57 | 58 | 58 | 58 | 52 | 58 |
| 1994-1999 | 66 | 63 | 54 | 64 | 58 | 58 | 51 | 51 | 54 | 58 | 52 | 53 |
| 2000-2004 | 58 | 53 | 46 | 53 | 64 | 46 | 46 | 47 | 50 | 49 | 43 | 48 |
| 2005-2009 | 36 | 40 | 34 | 41 | 36 | 34 | 36 | 39 | 41 | 38 | 34 | 38 |
| 2010-2016 | 25 | 21 | 16 | 20 | 30 | 17 | 23 | 19 | 14 | 14 | 14 | 17 |
| All | 50 | 55 | 43 | 57 | 72 | 51 | 58 | 61 | 57 | 61 | 58 | 58 |
| Table 14 Dwellings with Multiple BER Ratings | |||||||||||||||
| % of total | |||||||||||||||
| Earliest Year | Latest Year | Total | |||||||||||||
| A2 | A3 | B1 | B2 | B3 | C1 | C2 | C3 | D1 | D2 | E1 | E2 | F | G | ||
| A1 | 0 | 0 | |||||||||||||
| A2 | 0 | 0 | 0 | ||||||||||||
| A3 | 0 | 0 | 0 | 0 | 0 | 0 | |||||||||
| B1 | 0 | 0 | 0 | 0 | 0 | 0 | 0 | 0 | 0 | ||||||
| B2 | 0 | 0 | 0 | 0 | 0 | 0 | 0 | 0 | 0 | 0 | 0 | 1 | |||
| B3 | 0 | 0 | 0 | 2 | 1 | 0 | 0 | 0 | 0 | 0 | 0 | 0 | 4 | ||
| C1 | 0 | 0 | 0 | 2 | 3 | 1 | 0 | 0 | 0 | 0 | 0 | 0 | 0 | 7 | |
| C2 | 0 | 0 | 0 | 1 | 3 | 2 | 1 | 0 | 0 | 0 | 0 | 0 | 0 | 9 | |
| C3 | 0 | 0 | 0 | 1 | 3 | 3 | 2 | 1 | 0 | 0 | 0 | 0 | 0 | 11 | |
| D1 | 0 | 0 | 0 | 0 | 1 | 2 | 3 | 3 | 2 | 1 | 0 | 0 | 0 | 0 | 13 |
| D2 | 0 | 0 | 0 | 0 | 1 | 2 | 2 | 2 | 3 | 2 | 1 | 0 | 0 | 0 | 14 |
| E1 | 0 | 0 | 0 | 0 | 1 | 1 | 1 | 1 | 2 | 2 | 1 | 0 | 0 | 0 | 10 |
| E2 | 0 | 0 | 0 | 0 | 1 | 1 | 1 | 1 | 1 | 2 | 1 | 1 | 0 | 0 | 8 |
| F | 0 | 0 | 0 | 0 | 1 | 1 | 1 | 1 | 1 | 1 | 1 | 1 | 1 | 0 | 9 |
| G | 0 | 0 | 0 | 0 | 1 | 1 | 1 | 1 | 1 | 1 | 1 | 1 | 1 | 2 | 12 |
| Total | 0 | 0 | 1 | 4 | 12 | 17 | 16 | 14 | 12 | 10 | 5 | 3 | 3 | 2 | 100 |
| Table 15 BER Ratings Weighted to National Level | ||||||||||||||
| % of row | ||||||||||||||
| Dwelling Type | Energy Rating | Total | ||||||||||||
| A | B1 | B2 | B3 | C1 | C2 | C3 | D1 | D2 | E1 | E2 | F | G | ||
| Apartment | 1 | 2 | 6 | 9 | 11 | 11 | 10 | 11 | 12 | 7 | 6 | 5 | 9 | 164,626 |
| Detached house | 1 | 1 | 2 | 7 | 10 | 12 | 13 | 13 | 12 | 6 | 5 | 6 | 11 | 675,747 |
| Semi-detached house | 1 | 1 | 1 | 5 | 10 | 14 | 15 | 16 | 13 | 7 | 6 | 6 | 6 | 434,295 |
| Terraced house | 1 | 1 | 1 | 5 | 10 | 12 | 12 | 13 | 12 | 8 | 7 | 8 | 10 | 262,724 |
| Total | 1 | 1 | 2 | 6 | 10 | 12 | 13 | 13 | 12 | 7 | 6 | 6 | 9 | 1,537,393 |
| Table 16 BER Ratings by Eircode Routing Key (only includes dwellings pre-assigned an Eircode) | ||||||
| Eircode Routing Key | Energy Rating (%) | Number of BER Dwellings with an Eircode | Median Age (years) | Number of 2011 Census Dwellings with an Eircode | ||
| A-B | C-D | E-G | ||||
| A41 | 56 | 37 | 7 | 41 | 3 | 394 |
| A42 | 41 | 53 | 6 | 95 | 10 | 857 |
| A45 | 57 | 38 | 5 | 74 | 3 | 496 |
| A63 | 18 | 60 | 22 | 2786 | 18 | 10,871 |
| A67 | 10 | 58 | 32 | 1790 | 18 | 10,468 |
| A75 | 11 | 70 | 19 | 667 | 12 | 6,596 |
| A81 | 17 | 67 | 16 | 595 | 15 | 5,848 |
| A82 | 14 | 71 | 16 | 2057 | 10 | 20,778 |
| A83 | 24 | 68 | 8 | 522 | 10 | 5,377 |
| A84 | 25 | 64 | 11 | 1136 | 10 | 4,944 |
| A85 | 12 | 82 | 6 | 955 | 11 | 6,185 |
| A86 | 12 | 78 | 10 | 559 | 14 | 3,252 |
| A91 | 14 | 69 | 17 | 5102 | 24 | 27,223 |
| A92 | 14 | 71 | 15 | 6437 | 13 | 35,428 |
| A94 | 13 | 55 | 32 | 5321 | 34 | 20,227 |
| A96 | 14 | 53 | 33 | 6290 | 36 | 21,303 |
| A98 | 9 | 60 | 31 | 3127 | 28 | 16,074 |
| C15 | 13 | 73 | 14 | 4587 | 12 | 28,199 |
| D01 | 12 | 58 | 30 | 3446 | 16 | 14,466 |
| D02 | 11 | 57 | 31 | 2019 | 19 | 8,141 |
| D03 | 6 | 44 | 50 | 3973 | 64 | 17,070 |
| D04 | 10 | 57 | 33 | 5718 | 29 | 20,216 |
| D05 | 6 | 58 | 36 | 4194 | 43 | 19,507 |
| D06 | 11 | 43 | 46 | 4134 | 35 | 19,993 |
| D6W | 10 | 54 | 36 | 2753 | 40 | 10,947 |
| D07 | 4 | 48 | 48 | 6273 | 54 | 25,715 |
| D08 | 13 | 46 | 41 | 6279 | 21 | 27,504 |
| D09 | 10 | 52 | 39 | 4970 | 45 | 22,427 |
| D10 | 6 | 65 | 29 | 2131 | 37 | 7,780 |
| D11 | 18 | 58 | 24 | 5688 | 34 | 23,778 |
| D12 | 8 | 46 | 46 | 5137 | 58 | 22,588 |
| D13 | 22 | 58 | 20 | 4920 | 26 | 20,848 |
| D14 | 13 | 55 | 33 | 4634 | 41 | 16,829 |
| D15 | 17 | 73 | 10 | 1085 | 13 | 38,389 |
| D16 | 18 | 63 | 19 | 4816 | 27 | 19,727 |
| D17 | 6 | 82 | 12 | 2232 | 34 | 7,008 |
| D18 | 28 | 62 | 10 | 6324 | 11 | 20,900 |
| D20 | 4 | 60 | 36 | 871 | 31 | 4,619 |
| D22 | 13 | 67 | 21 | 3962 | 25 | 17,219 |
| D24 | 14 | 68 | 18 | 8641 | 15 | 36,055 |
| E21 | 8 | 67 | 25 | 502 | 21 | 4,688 |
| E25 | 8 | 69 | 24 | 588 | 12 | 5,023 |
| E32 | 4 | 71 | 25 | 794 | 23 | 6,027 |
| E34 | 2 | 61 | 37 | 1002 | 30 | 8,661 |
| E41 | 4 | 60 | 36 | 2030 | 20 | 16,385 |
| E45 | 10 | 65 | 25 | 1799 | 13 | 11,226 |
| E53 | 8 | 58 | 34 | 840 | 17 | 5,274 |
| E91 | 7 | 68 | 25 | 2328 | 25 | 14,982 |
| F12 | 10 | 74 | 16 | 1081 | 10 | 15,396 |
| F23 | 5 | 82 | 13 | 1644 | 14 | 11,044 |
| F26 | 7 | 68 | 25 | 2367 | 15 | 22,339 |
| F28 | 12 | 62 | 26 | 1074 | 15 | 13,030 |
| F31 | 11 | 59 | 30 | 279 | 10 | 3,312 |
| F35 | 1 | 77 | 22 | 300 | 9 | 3,946 |
| F42 | 8 | 71 | 22 | 755 | 10 | 9,384 |
| F45 | 3 | 76 | 20 | 723 | 10 | 12,237 |
| F52 | 16 | 66 | 17 | 594 | 10 | 6,207 |
| F56 | 15 | 71 | 14 | 429 | 8 | 4,568 |
| F91 | 10 | 62 | 27 | 5251 | 15 | 28,841 |
| F92 | 8 | 77 | 15 | 3407 | 13 | 30,129 |
| F93 | 11 | 74 | 15 | 2658 | 10 | 30,647 |
| F94 | 12 | 68 | 20 | 1434 | 12 | 23,662 |
| H12 | 12 | 69 | 20 | 1702 | 10 | 13,192 |
| H14 | 8 | 75 | 17 | 426 | 10 | 4,755 |
| H16 | 18 | 66 | 16 | 173 | 13 | 2,905 |
| H18 | 10 | 66 | 24 | 1130 | 16 | 11,404 |
| H23 | 2 | 60 | 38 | 239 | 45 | 1,716 |
| H53 | 6 | 65 | 29 | 1275 | 13 | 14,545 |
| H54 | 6 | 73 | 20 | 1279 | 10 | 12,034 |
| H62 | 6 | 82 | 13 | 821 | 11 | 6,592 |
| H65 | 13 | 78 | 9 | 761 | 10 | 5,358 |
| H71 | 2 | 59 | 39 | 282 | 12 | 2,755 |
| H91 | 7 | 74 | 20 | 1293 | 14 | 70,566 |
| K32 | 18 | 73 | 9 | 2677 | 9 | 10,948 |
| K34 | 11 | 69 | 19 | 998 | 18 | 4,416 |
| K36 | 22 | 65 | 13 | 2640 | 13 | 10,451 |
| K45 | 6 | 88 | 6 | 511 | 9 | 3,061 |
| K56 | 15 | 76 | 9 | 667 | 13 | 3,549 |
| K67 | 10 | 78 | 12 | 3575 | 13 | 16,905 |
| K78 | 21 | 70 | 9 | 4360 | 13 | 16,551 |
| N37 | 9 | 65 | 26 | 3276 | 15 | 18,150 |
| N39 | 12 | 66 | 22 | 2850 | 9 | 20,212 |
| N41 | 8 | 74 | 18 | 1421 | 10 | 14,207 |
| N91 | 12 | 66 | 23 | 3856 | 13 | 24,277 |
| P12 | 23 | 64 | 13 | 493 | 12 | 7,473 |
| P14 | 24 | 53 | 24 | 38 | 26 | 1,101 |
| P17 | 15 | 58 | 27 | 802 | 14 | 5,479 |
| P24 | 16 | 61 | 22 | 1147 | 12 | 5,962 |
| P25 | 20 | 69 | 11 | 2555 | 10 | 12,628 |
| P31 | 22 | 68 | 10 | 2229 | 13 | 8,427 |
| P32 | 11 | 72 | 17 | 18 | 28 | 1,423 |
| P36 | 12 | 59 | 28 | 1103 | 11 | 7,634 |
| P43 | 17 | 72 | 11 | 2308 | 14 | 9,047 |
| P47 | 23 | 48 | 29 | 307 | 13 | 5,214 |
| P51 | 23 | 62 | 16 | 3154 | 11 | 30,289 |
| P56 | 14 | 71 | 15 | 499 | 12 | 5,309 |
| P61 | 16 | 70 | 14 | 957 | 11 | 6,726 |
| P67 | 12 | 71 | 16 | 457 | 16 | 3,742 |
| P72 | 19 | 66 | 15 | 853 | 13 | 7,369 |
| P75 | 9 | 61 | 30 | 671 | 15 | 8,877 |
| P81 | 11 | 58 | 30 | 716 | 13 | 9,606 |
| P85 | 10 | 63 | 27 | 562 | 14 | 6,171 |
| R14 | 9 | 75 | 17 | 1728 | 12 | 9,356 |
| R21 | 8 | 69 | 23 | 278 | 16 | 3,408 |
| R32 | 17 | 62 | 21 | 4794 | 12 | 29,744 |
| R35 | 6 | 61 | 33 | 2357 | 15 | 15,418 |
| R42 | 4 | 53 | 43 | 1013 | 14 | 9,331 |
| R45 | 5 | 59 | 36 | 665 | 16 | 3,844 |
| R51 | 4 | 74 | 22 | 933 | 14 | 6,329 |
| R56 | 9 | 73 | 18 | 591 | 13 | 4,169 |
| R93 | 11 | 71 | 18 | 4284 | 13 | 21,978 |
| R95 | 11 | 68 | 20 | 4926 | 17 | 29,921 |
| T12 | 15 | 62 | 22 | 1336 | 24 | 52,685 |
| T23 | 12 | 65 | 24 | 8009 | 33 | 31,254 |
| T34 | 51 | 48 | 1 | 135 | 8 | 1,185 |
| T45 | 26 | 69 | 5 | 2148 | 11 | 7,795 |
| T56 | 32 | 65 | 3 | 290 | 8 | 2,242 |
| V14 | 7 | 73 | 20 | 1382 | 36 | 4,233 |
| V15 | 4 | 58 | 38 | 738 | 13 | 8,128 |
| V23 | 18 | 62 | 21 | 255 | 10 | 5,436 |
| V31 | 8 | 63 | 29 | 868 | 12 | 9,458 |
| V35 | 12 | 52 | 37 | 833 | 12 | 10,791 |
| V42 | 7 | 75 | 18 | 870 | 11 | 6,194 |
| V92 | 8 | 66 | 25 | 4390 | 17 | 32,027 |
| V93 | 11 | 70 | 19 | 2913 | 13 | 26,572 |
| V94 | 7 | 74 | 19 | 1610 | 20 | 76,638 |
| V95 | 7 | 72 | 21 | 5607 | 15 | 32,935 |
| W12 | 11 | 73 | 16 | 1949 | 14 | 9,351 |
| W23 | 16 | 69 | 15 | 4404 | 16 | 22,700 |
| W34 | 24 | 63 | 14 | 400 | 9 | 2,624 |
| W91 | 13 | 72 | 15 | 4930 | 13 | 32,682 |
| X35 | 9 | 70 | 20 | 1181 | 15 | 7,449 |
| X42 | 4 | 66 | 30 | 194 | 12 | 2,943 |
| X91 | 8 | 72 | 20 | 8384 | 18 | 39,701 |
| Y14 | 6 | 72 | 23 | 2054 | 14 | 10,890 |
| Y21 | 5 | 67 | 27 | 2611 | 12 | 20,775 |
| Y25 | 7 | 72 | 21 | 2161 | 11 | 15,096 |
| Y34 | 2 | 72 | 25 | 1630 | 12 | 10,000 |
| Y35 | 6 | 67 | 26 | 3967 | 14 | 24,352 |
Introduction
A Building Energy Rating (BER) is an indication of the energy performance of a dwelling (represented in units of kWh/m2/year). Actual energy performance will depend on how the occupants operate the dwelling. A BER is based on the characteristics of major components of the dwelling including: wall, roof and floor dimensions; window and door sizes and orientations, as well as the construction type and insulation, ventilation and air tightness features; the system for heat supply (including renewable energy), distribution, and control; and the type of lighting. The BER certificate indicates the annual primary energy usage and carbon dioxide emissions associated with the provision of space heating, water heating, ventilation, lighting, and associated pumps and fans. The energy use is calculated on the basis of a notional family with a standard pattern of occupancy - hence data in this release giving average primary energy use or carbon dioxide emissions are not based on actual data. A BER only covers electricity used for heating, lighting and ventilation with associated pumps and fans. Electricity used for cooking, refrigeration, laundry and other appliance use are not included.
Since 1st January 2009, a BER certificate and advisory report is compulsory for all homes being sold or offered for rent. A BER is also required for new dwellings that apply for planning permission on or after 1st January 2007. A BER certificate is required to avail of the grants for energy-efficiency improvements to the home that are provided under the Better Energy Homes scheme.
Access to Microdata
Further information on the BER scheme (including links to a microdata research tool) is available on the Sustainable Energy Authority of Ireland website at http://www.seai.ie/BER/
Revisions
The figures will be updated on a quarterly basis. While the changes to previous quarters will mainly relate to the most recent quarter, previous periods are also subject to revision mainly arising from some dwellings having another BER audit undertaken.
Coverage
There are three types of BER Certificates. A New Dwelling – Provisional BER is required for a dwelling that is not yet built but is offered for sale off the plans. A New Dwelling – Final BER is required for a newly-built dwelling before it is occupied. This certificate is based on data collected in a site survey carried out by a registered BER Assessor as well as drawings and specifications for the completed dwelling. An Existing Dwelling BER is required for any existing dwelling that is offered for sale or to let. An existing dwelling is one that has previously been sold or occupied. This is based on data collected in a site survey carried out by a registered BER Assessor. Both the New Dwelling – Final BER and the Existing Dwelling BER certificates are valid for 10 years from the date of issue. They become invalid if material changes are made to the dwelling during that period. This release is an analysis of Final and Existing BER certificates. To ensure that all tables are consistent with each other, records that contain missing data in any of the main classification variables used in this release have been excluded e.g. missing response for county. Records with only the main space heating fuel or main water heating fuel information missing have been included except in tables using those variables.
National representativeness
There were 645,260 unique domestic BERs (one per dwelling) completed in the period 2009 to the end of September 2016. This compares with around 1.66 million occupied private households enumerated in the 2011 Census of Population. The 2011 Census of Population included questions on county of location of the dwelling, the period when the dwelling was built, and the type of dwelling. These questions can be used to weight the BER data to national level. Table 15 presents an initial weighting of BERs up to national level of non vacant households using the 2011 Census of Population. The weights were calculated by dividing the number of non vacant households in the Census by the number of unique BER households. In cases where a household had more than one BER carried out in the period 2009-2015 only the most recent BER was used. Around 7% of Census households were excluded because there were no BER households in the particular stratum e.g. detached houses in Dublin 1 that were constructed in the period 1919-1945. A stratum was classified as a unique combination of County (52 categories - Dublin postal districts were distinguished), period of construction (nine categories) and dwelling type (four categories). The BER contains more disaggregated dwelling types, e.g. mid-terrace house, but these had to be aggregated to correspond to the Census classification.
In mid-2015 the Census and BER files were allocated Eircodes. This makes it possible to match both files at household level as postcodes are unique at letter-box level. This will create an opportunity to calculate weights in a more precise manner.
Non-domestic Buildings
Since 1st July 2008, a BER Certificate is required for all new non-residential buildings and from 1st January 2009 for all public service buildings and for existing non-residential buildings. The CSO is in the process of obtaining access to the non-residential file.
Definitions
The BER rating scale is divided into categories from G (largest primary energy usage) to an A1 rating (lowest primary energy usage). The kilowatt-hour is the unit of energy used in Dwelling Energy Assessment Procedure (DEAP). The BER is measured in kWh per square metre of floor area of the dwelling per year (kWh/m2/year). The full range of categories is described in Table A. For the purposes of this release A1, A2, and A3 have been combined together because of the small number of Certificates in these categories.
Table A: Building Energy Rating Categories
|
Category |
kWh/m2/year |
|
A1 |
≤ 25 |
|
A2 |
> 25 |
|
A3 |
> 50 |
|
B1 |
> 75 |
|
B2 |
> 100 |
|
B3 |
> 125 |
|
C1 |
> 150 |
|
C2 |
> 175 |
|
C3 |
> 200 |
|
D1 |
> 225 |
|
D2 |
> 260 |
|
E1 |
> 300 |
|
E2 |
> 340 |
|
F |
> 380 |
|
G |
> 450 |
County is where the dwelling is located.
Type of dwelling is selected from one of the following: Detached house; Semi-detached house; End of Terrace house; Mid-terrace house; Ground-floor apartment; Mid-floor apartment; Top-floor apartment; Basement apartment; and Maisonette.
Year of construction is when the dwelling was originally built.
The fuel used by the Main Space Heating system. The main space heating system heats the largest proportion of the dwelling. This proportion is calculated using a count of the habitable rooms. It often provides hot water as well as space heating.
The fuel used by the Main Water Heating system. This category has similar fuel response options to the Main Space Heating system.
The Total Internal Floor Area of the dwelling is the total area of exposed and semi-exposed floors. It excludes any unheated areas that are thermally separated from the dwelling. The total energy usage is divided by the dwelling floor area to determine the Building Energy Rating.
Table Notes
Table 1 presents the number of Final and Existing BERs published by month since January 2009. A household that has had BERs conducted in different years is included in each year. This table gives an overview of the number of BER assessments being performed and will inform the user of changes since the previous quarterly analysis.
Tables 2-13 only include the latest BER published for each dwelling from January 2009 to September 2016; hence the total number of BER certificates is lower than the total in Table 1.
Table 2 shows the general impact of the age of the dwelling on the BER profile. It can be linked with changes to the Building Regulations that require new homes to be more energy efficient.
Table 3 shows how the BER profile varies by type of dwelling.
Tables 4-5 profile BERs by county and Dublin postal district. Table 4 is in county within province order.
Tables 6-7 profile BERs by main space and water heating fuels respectively. Records with a missing response for main space heating fuel have been excluded from Table 6 and 8. Similarly records with a missing response for main water heating fuel have been excluded from Table 7.
Table 8 cross-classifies county by main space heating fuel. Mains gas is not generally available in some counties. Some counties use local heating fuels such as peat e.g. County Offaly.
Tables 9-10 cross-classify main space heating fuel by period of construction and dwelling type.
Tables 11-13 cross-classify the BER by period of construction and the dwelling type. The latter is more precisely defined in recent years but in the earlier years more general descriptions such as House were in use. It is not possible to reclassify these to detached, semi-detached, end-of-terrace, or mid-terraced house. The average primary energy use and average carbon dioxide figures are notional figures based on assumed energy use factors and occupancy.
Table 14 is an analysis of properties that had BER audits carried out in more than one year. The earliest and latest BER ratings are cross-classified to show trends in energy savings arising from insulation, retrofitting etc.
Table 15 is an analysis of BER properties after they have been weighted to Census 2011 level. It can be compared with the Total row profile in Table 2. See the entry under National representativeness for more details.
Table 16 profiles the 139 Eircode routing keys by BER rating. The table gives the percentage of A-B, C-D, and E-G energy ratings for each routing key. The number of BER dwellings with a pre-assigned Eircode and the average age of those dwellings are also given. The table only includes dwellings that have both a BER rating and a pre-assigned Eircode. The proportion of dwellings that have had a BER audit can vary across routing keys and this should be taken into account in interpreting the table. As part of the preparations for the launch of Eircode, around 95% of dwellings in the 2011 Census of Population file were pre-assigned an Eircode. The number of such dwellings in each routing key area is given in Table 16. This allows users to roughly determine the proportion of dwellings in a routing key that have a BER rating and a pre-assigned Eircode. In areas where this proportion is low, additional care should be taken in interpreting the BER ratings profile as it may not be fully representative of the routing key.
Table B contains a provisional listing of routing keys by county. The list is indicative only as it is not based on an analysis of the full Eircode database. Dwellings were assigned to an Eircode routing key based on their An Post principal postal town span of delivery rather than on the actual geographical location of the dwelling.
|
County |
Main Eircode Routing Keys |
|
Carlow |
R21, R93, R95 |
|
Cavan |
A81, A82, F91, H12, H14, H16 |
|
Clare |
V14, V15, V94, V95 |
|
Cork City |
T12, T23 |
|
Cork County |
P12, P14, P17, P24, P25, P31, P32, P36, P43, P47, P51, P56, P61, P67, P72, P75, P81, P85, T12, T23, T34, T45, T56 |
|
Donegal |
F91, F92, F93, F94 |
|
Dublin City |
D01-D24 including D6W |
|
Dublin County |
A41, A42, A45, A94, A96, K32, K34, K36, K45, K56, K67, K78 |
|
Galway City |
H91 |
|
Galway County |
F42, F45, H53, H54, H62, H65, H71, H91 |
|
Kerry |
P51, V23, V31, V92, V93 |
|
Kildare |
A83, R14, R51, R56, W12, W23, W34, W91 |
|
Kilkenny |
E32, E41, R95, X91 |
|
Laois |
R14, R32, R93 |
|
Leitrim |
F91, H12, N41 |
|
Limerick City |
V94 |
|
Limerick County |
P56, V35, V42, V94 |
|
Longford |
N39 |
|
Louth |
A91, A92 |
|
Mayo |
F12, F23, F26, F28, F31, F35 |
|
Meath |
A82, A83, A84, A85, A86, A92, C15, K32 |
|
Monaghan |
A75, A81, H18, H23 |
|
Offaly |
R32, R35, R42, R45 |
|
Roscommon |
F42, F45, F52, N37, N39, N41 |
|
Sligo |
F26, F52, F56, F91 |
|
Tipperary |
E21, E25, E32, E34, E41, E45, E53, E91, V94 |
|
Waterford City |
X91 |
|
Waterford County |
P36, P51, X35, X42, X91 |
|
Westmeath |
N37, N91 |
|
Wexford |
Y21, Y25, Y34, Y35 |
|
Wicklow |
A63, A67, A98, W91, Y14 |
 Hide Background Notes
Scan the QR code below to view this release online or go to
http://www.cso.ie/en/releasesandpublications/er/dber/domesticbuildingenergyratingsquarter32016/
 Show Table 1 Domestic Building Energy Ratings Certificates
 Hide Table 1 Domestic Building Energy Ratings Certificates