
| Gross capital stock of fixed assets | € billion | |||||
| End of year | 2010 | 2011 | 2012 | 2013 | 2014 | 2015 |
| Current Prices | 614.4 | 628.2 | 662.6 | 694.4 | 756.4 | 1,087.9 |
| Constant 2014 Prices | 664.2 | 681.9 | 702.0 | 720.1 | 756.4 | 1,052.1 |
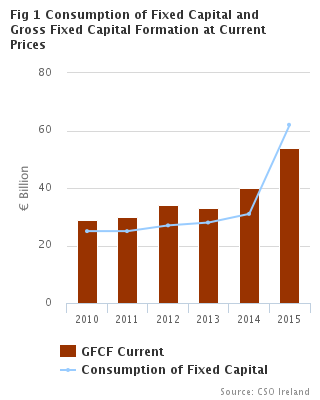
Following corporate restructuring, both through imports of individual assets and also reclassifications of entire balance sheets, combined with an increase in the number of new aircraft imports into Ireland, the gross value of the stock of produced assets was €1,088bn at the end of 2015 - see Table 5.
Allowing for depreciation, the net stock of these assets increased by 89% between 2010 and 2015, following a decline of 20% between the year 2007 and the year 2010 - see Table 1.
The graph in figure 1 displays how the level of capital investment exceeded the depreciation in the stock of assets until 2014. With the aforementioned change in the stock of assets depreciation in 2015 exceeds the level of capital investment.
|
Note on 2015 level shift: This release complements the National Income and Expenditure Annual results (NIE 2015) published on 12 July 2016. The relocated balance sheets were dominated by intellectual property categorised as research and development within intangible assets. These assets led to the increased consumption of fixed capital shown here and in the NIE 2015. The press statement of 12 July provides further information. In accordance with the Statistics Act 1993 certain data have had to be suppressed to protect the confidentiality of the contributing companies. Suppression is applied at the lowest level of detail in order to prevent disclosure and in such cases the values are included in the higher aggregates. |
| X-axis label | Other Assets | Other Machinery and Equipment | Research and Development | Transport equipment | Other buildings and structures | Dwellings |
|---|---|---|---|---|---|---|
| 2010 | 5 | 27 | 26 | 43 | 103 | 198 |
| 2011 | 5 | 26 | 27 | 43 | 104 | 200 |
| 2012 | 6 | 26 | 31 | 47 | 108 | 204 |
| 2013 | 7 | 27 | 32 | 49 | 113 | 210 |
| 2014 | 6 | 31 | 34 | 65 | 121 | 222 |
| 2015* | 358 | 33 | 0 | 0 | 132 | 238 |
* For 2015 the categories Research and Development and Transport Equipment are included with Other Assets for confidentiality reasons
The net stock of assets increased almost 60% in 2015 with additional intellectual property products and aircraft arising from new imports and corporate restructuring. Due to confidentiality constraints and the risk of disclosing individual data the asset categories intangible fixed assets, research and development and transport equipment have been suppressed. Together transport equipment and intangible fixed assets amounted to €356bn at the end of 2015, an increase of €254bn on the 2014 level. These categories now make up 47% of the net stock of assets, compared with 21% in 2014.
Dwellings increased to €238bn at the end of 2015, a €16bn increase. This still leaves the stock of dwellings €47bn below the peak value in 2007 - see Table 3.
All industrial and service sectors with the exception of Mining and Quarrying recorded an increase in the current value of their fixed assets. Some sectors showing notable increases include: Real estate activities (which includes dwellings) +€17bn; Information and communication +€6bn - see Table 1.
| X-axis label | Other Assets | Other Machinery and Equipment | Research and Development | Transport equipment | Other buildings and structures | Dwellings |
|---|---|---|---|---|---|---|
| 2010 | 2 | 3 | 6 | 7 | 4 | 3 |
| 2011 | 2 | 3 | 6 | 7 | 4 | 3 |
| 2012 | 1 | 3 | 7 | 7 | 5 | 4 |
| 2013 | 1 | 4 | 7 | 7 | 5 | 4 |
| 2014 | 2 | 4 | 7 | 9 | 5 | 4 |
| 2015* | 48 | 4 | 0 | 0 | 6 | 4 |
* For 2015 the categories Research and Development and Transport Equipment are included with Other Assets for confidentiality reasons
Consumption of fixed capital, often termed depreciation, has almost doubled as a result of the additional assets, from €31bn in 2014 to €62bn in 2015. As in the preceding tables the asset breakdown of consumption of fixed capital has required suppression. In 2014 transport equipment and intangible fixed assets had a combined consumption of fixed capital of €18bn. In 2015 the value for those same categories was €48bn - see Table 11.
| Table 1 Net Capital Stock held at end of year by type of industry at current market prices | € million | |||||||||||
| Nace Rev 2 Section | 2005 | 2006 | 2007 | 2008 | 2009 | 2010 | 2011 | 2012 | 2013 | 2014 | 2015 | |
| Agriculture, Forestry and Fishing | A | 7,746 | 8,180 | 8,581 | 10,003 | 9,127 | 8,584 | 8,793 | 9,178 | 8,980 | 9,404 | 9,704 |
| Mining and Quarrying | B | 1,963 | 2,021 | 2,154 | 2,261 | 2,219 | 2,026 | 1,895 | 1,935 | 1,793 | 1,762 | 1,663 |
| Manufacturing | C | 32,809 | 35,367 | 36,644 | 36,629 | 35,280 | 34,354 | 33,674 | 34,877 | 36,070 | 37,728 | * |
| Electricity, Gas, Steam and Air Conditioning Supply | D | 10,027 | 11,404 | 12,053 | 12,125 | 11,819 | 11,565 | 11,508 | 11,878 | 12,440 | 13,124 | 13,481 |
| Water supply; sewerage, waste management and remediation activities | E | 6,909 | 7,292 | 7,702 | 7,334 | 7,056 | 6,711 | 6,847 | 7,147 | 7,497 | 8,170 | 8,877 |
| Construction | F | 3,195 | 3,708 | 4,078 | 3,897 | 3,473 | 2,959 | 2,535 | 2,303 | 2,131 | 2,159 | 2,188 |
| Wholesale and Retail Trade; Repair of Motor Vehicles and Motorcycles | G | 8,044 | 8,976 | 9,735 | 9,734 | 8,703 | 8,220 | 8,648 | 9,200 | 9,928 | 10,926 | 12,165 |
| Transportation and Storage | H | 13,281 | 14,137 | 15,971 | 16,733 | 17,353 | 17,202 | 17,395 | 17,739 | 17,420 | 17,247 | 17,581 |
| Accommodation and Food Service Activities | I | 4,698 | 4,959 | 4,987 | 4,902 | 4,238 | 3,961 | 3,871 | 3,785 | 3,833 | 3,943 | 3,997 |
| Information and Communication | J | 9,658 | 10,628 | 11,626 | 12,396 | 12,841 | 13,487 | 15,058 | 18,334 | 19,617 | 22,108 | 28,344 |
| Financial and Insurance Activities | K | 5,565 | 6,310 | 6,954 | 6,855 | 6,538 | 6,193 | 6,241 | 6,473 | 6,742 | 7,343 | 8,343 |
| Real Estate Activities | L | 252,993 | 290,792 | 292,790 | 255,388 | 213,202 | 202,683 | 203,597 | 207,272 | 213,146 | 226,456 | 243,631 |
| of which: | ||||||||||||
| Dwellings | 248,782 | 284,651 | 284,843 | 247,798 | 207,252 | 198,019 | 200,140 | 203,943 | 209,804 | 222,127 | 237,802 | |
| Professional, Scientific and Technical Activities | M | 3,181 | 3,564 | 3,967 | 4,001 | 3,608 | 3,805 | 4,348 | 5,190 | 6,213 | 6,957 | 8,013 |
| Administrative and Support Service Activities | N | 24,133 | 24,657 | 24,309 | 22,236 | 24,597 | 27,478 | 28,333 | 32,477 | 35,530 | 52,604 | * |
| Public Administration and Defence; Compulsory Social Security | O | 32,459 | 35,807 | 39,471 | 38,831 | 37,462 | 35,367 | 35,554 | 36,836 | 37,882 | 39,784 | 42,174 |
| of which: | ||||||||||||
| Roads | 21,871 | 24,067 | 26,632 | 26,438 | 26,553 | 25,116 | 25,312 | 26,194 | 26,736 | 27,982 | 29,356 | |
| Education | P | 9,001 | 9,819 | 10,476 | 10,287 | 9,374 | 8,958 | 8,937 | 9,266 | 9,454 | 9,772 | 10,262 |
| Human Health and Social Work Activities | Q | 5,642 | 5,882 | 6,227 | 6,007 | 5,509 | 5,327 | 5,603 | 5,801 | 6,358 | 6,981 | 7,602 |
| Arts, Entertainment and Recreation | R | 1,569 | 1,812 | 2,049 | 2,223 | 2,176 | 2,103 | 2,092 | 2,092 | 2,116 | 2,278 | 2,406 |
| Other Service Activities | S | 563 | 604 | 634 | 624 | 585 | 551 | 528 | 523 | 544 | 615 | 639 |
| Total | 433,436 | 485,918 | 500,409 | 462,466 | 415,161 | 401,536 | 405,456 | 422,304 | 437,693 | 479,362 | 760,793 | |
| * Suppressed for confidentiality reasons | ||||||||||||
| Table 2 Net Capital Stock held at end of year by type of industry at constant market prices (base 2014) | € million | |||||||||||
| Nace Rev 2 Section | 2005 | 2006 | 2007 | 2008 | 2009 | 2010 | 2011 | 2012 | 2013 | 2014 | 2015 | |
| Agriculture, Forestry and Fishing | A | 8,340 | 8,475 | 8,929 | 9,974 | 9,740 | 9,425 | 9,322 | 9,351 | 9,374 | 9,404 | 9,534 |
| Mining and Quarrying | B | 1,842 | 1,978 | 2,119 | 2,239 | 2,289 | 2,171 | 2,058 | 2,075 | 1,891 | 1,762 | 1,648 |
| Manufacturing | C | 31,748 | 33,540 | 34,584 | 35,052 | 35,674 | 35,570 | 35,746 | 36,038 | 36,937 | 37,728 | * |
| Electricity, Gas, Steam and Air Conditioning Supply | D | 10,092 | 10,835 | 11,221 | 11,692 | 12,182 | 12,629 | 12,649 | 12,779 | 13,093 | 13,124 | 13,085 |
| Water supply; sewerage, waste management and remediation activities | E | 5,786 | 6,045 | 6,387 | 6,747 | 7,194 | 7,420 | 7,582 | 7,696 | 7,851 | 8,170 | 8,426 |
| Construction | F | 3,208 | 3,612 | 4,004 | 3,898 | 3,520 | 3,075 | 2,698 | 2,434 | 2,238 | 2,159 | 2,202 |
| Wholesale and Retail Trade; Repair of Motor Vehicles and Motorcycles | G | 7,194 | 7,843 | 8,532 | 8,970 | 8,845 | 8,773 | 9,326 | 9,691 | 10,263 | 10,926 | 11,796 |
| Transportation and Storage | H | 12,210 | 12,815 | 14,493 | 15,701 | 17,414 | 18,117 | 18,532 | 18,505 | 17,850 | 17,247 | 17,038 |
| Accommodation and Food Service Activities | I | 3,982 | 4,088 | 4,162 | 4,401 | 4,329 | 4,268 | 4,201 | 4,035 | 4,013 | 3,943 | 3,911 |
| Information and Communication | J | 10,194 | 10,851 | 11,529 | 12,165 | 12,849 | 14,008 | 15,965 | 18,584 | 19,635 | 22,108 | 27,676 |
| Financial and Insurance Activities | K | 4,793 | 5,281 | 5,837 | 6,166 | 6,690 | 6,675 | 6,761 | 6,816 | 6,968 | 7,343 | 8,000 |
| Real Estate Activities | L | 186,263 | 200,033 | 212,657 | 222,162 | 226,265 | 226,773 | 226,034 | 225,460 | 225,192 | 226,456 | 228,295 |
| of which: | ||||||||||||
| Dwellings | 182,911 | 195,340 | 206,594 | 215,766 | 220,204 | 221,618 | 222,210 | 221,881 | 221,699 | 222,127 | 222,759 | |
| Professional, Scientific and Technical Activities | M | 2,983 | 3,326 | 3,716 | 3,812 | 3,638 | 3,938 | 4,578 | 5,237 | 6,192 | 6,957 | 7,825 |
| Administrative and Support Service Activities | N | 24,641 | 24,912 | 24,517 | 22,113 | 24,327 | 27,789 | 29,161 | 32,937 | 35,591 | 52,604 | * |
| Public Administration and Defence; Compulsory Social Security | O | 29,556 | 31,378 | 33,757 | 36,369 | 38,146 | 39,031 | 39,312 | 39,593 | 39,609 | 39,784 | 40,031 |
| of which: | ||||||||||||
| Roads | 20,959 | 22,177 | 23,710 | 25,584 | 27,048 | 27,809 | 28,053 | 28,218 | 27,992 | 27,982 | 27,824 | |
| Education | P | 7,629 | 8,080 | 8,549 | 9,096 | 9,443 | 9,602 | 9,702 | 9,718 | 9,705 | 9,772 | 9,832 |
| Human Health and Social Work Activities | Q | 4,695 | 4,749 | 5,077 | 5,372 | 5,606 | 5,784 | 6,101 | 6,181 | 6,632 | 6,981 | 7,385 |
| Arts, Entertainment and Recreation | R | 1,360 | 1,533 | 1,744 | 2,013 | 2,237 | 2,300 | 2,306 | 2,260 | 2,223 | 2,278 | 2,311 |
| Other Service Activities | S | 544 | 571 | 605 | 612 | 599 | 575 | 559 | 548 | 566 | 615 | 639 |
| Total | 357,061 | 379,947 | 402,419 | 418,555 | 430,986 | 437,923 | 442,593 | 449,939 | 455,823 | 479,362 | 734,406 | |
| * Suppressed for confidentiality reasons | ||||||||||||
| Table 3 Net Capital Stock held at end of year by asset type at current market prices | € million | ||||||||||
| Asset Category | 2005 | 2006 | 2007 | 2008 | 2009 | 2010 | 2011 | 2012 | 2013 | 2014 | 2015 |
| Dwellings, excluding land | 248,782 | 284,651 | 284,843 | 247,798 | 207,252 | 198,019 | 200,140 | 203,943 | 209,804 | 222,127 | 237,802 |
| Other buildings and structures | 104,236 | 114,487 | 123,975 | 121,225 | 110,084 | 102,786 | 103,513 | 108,050 | 113,416 | 121,456 | 131,684 |
| of which: | |||||||||||
| Roads | 21,871 | 24,067 | 26,632 | 26,438 | 26,553 | 25,116 | 25,312 | 26,194 | 26,736 | 27,982 | 29,356 |
| Transport equipment | 36,818 | 38,760 | 40,293 | 38,686 | 41,397 | 43,439 | 43,283 | 46,943 | 49,060 | 64,931 | * |
| Other machinery and equipment | 24,305 | 26,169 | 26,689 | 27,407 | 27,452 | 26,970 | 26,448 | 26,002 | 27,265 | 30,993 | 32,958 |
| of which: | |||||||||||
| Office machinery and hardware | 2,632 | 2,998 | 3,192 | 3,252 | 3,671 | 3,751 | 4,318 | 4,599 | 4,697 | 4,873 | 5,809 |
| Cultivated assets | 1,759 | 1,914 | 1,865 | 2,158 | 1,884 | 1,880 | 2,281 | 2,608 | 2,250 | 2,274 | 2,378 |
| Intangible fixed assets | 17,536 | 19,937 | 22,744 | 25,192 | 27,091 | 28,443 | 29,792 | 34,758 | 35,898 | 37,581 | * |
| of which: | |||||||||||
| Computer software | 1,360 | 1,444 | 1,635 | 1,737 | 1,725 | 1,910 | 2,048 | 2,324 | 2,515 | 2,715 | 3,162 |
| Research and development | 15,460 | 17,656 | 20,199 | 22,465 | 24,354 | 25,599 | 26,832 | 31,453 | 32,487 | 33,982 | * |
| Total | 433,436 | 485,918 | 500,409 | 462,466 | 415,161 | 401,536 | 405,456 | 422,304 | 437,693 | 479,362 | 760,793 |
| * Suppressed for confidentiality reasons | |||||||||||
| Table 4 Net Capital Stock held at end of year by asset type at constant market prices (base 2014) | € million | ||||||||||
| Asset Category | 2005 | 2006 | 2007 | 2008 | 2009 | 2010 | 2011 | 2012 | 2013 | 2014 | 2015 |
| Dwellings, excluding land | 182,911 | 195,340 | 206,594 | 215,766 | 220,204 | 221,618 | 222,210 | 221,881 | 221,699 | 222,127 | 222,759 |
| Other buildings and structures | 89,072 | 94,223 | 100,732 | 107,827 | 112,135 | 113,806 | 114,723 | 116,401 | 118,747 | 121,456 | 124,812 |
| of which: | |||||||||||
| Roads | 20,959 | 22,177 | 23,710 | 25,584 | 27,048 | 27,809 | 28,053 | 28,218 | 27,992 | 27,982 | 27,824 |
| Transport equipment | 37,585 | 39,269 | 40,725 | 38,675 | 40,964 | 43,876 | 44,474 | 47,575 | 49,148 | 64,931 | * |
| Other machinery and equipment | 25,343 | 26,610 | 28,223 | 29,230 | 28,709 | 27,985 | 28,061 | 27,476 | 28,813 | 30,993 | 34,520 |
| of which: | |||||||||||
| Office machinery and hardware | 2,300 | 2,591 | 3,174 | 3,545 | 3,802 | 4,032 | 4,640 | 4,643 | 4,717 | 4,873 | 5,809 |
| Cultivated assets | 2,322 | 2,356 | 2,325 | 2,324 | 2,270 | 2,207 | 2,229 | 2,300 | 2,277 | 2,274 | 2,274 |
| Intangible fixed assets | 19,828 | 22,148 | 23,821 | 24,732 | 26,704 | 28,432 | 30,897 | 34,304 | 35,138 | 37,581 | * |
| of which: | |||||||||||
| Computer software | 1,578 | 1,658 | 1,805 | 1,876 | 1,942 | 2,055 | 2,175 | 2,371 | 2,544 | 2,715 | 2,959 |
| Research and development | 17,543 | 19,683 | 21,156 | 21,899 | 23,717 | 25,339 | 27,699 | 30,855 | 31,646 | 33,982 | * |
| Total | 357,061 | 379,947 | 402,419 | 418,555 | 430,986 | 437,923 | 442,593 | 449,939 | 455,823 | 479,362 | 734,406 |
| * Suppressed for confidentiality reasons | |||||||||||
| Table 5 Gross Capital Stock held at end of year by type of industry at current market prices | € million | |||||||||||
| Nace Rev 2 Section | 2005 | 2006 | 2007 | 2008 | 2009 | 2010 | 2011 | 2012 | 2013 | 2014 | 2015 | |
| Agriculture, Forestry and Fishing | A | 15,403 | 16,057 | 16,378 | 17,850 | 16,678 | 15,947 | 16,122 | 16,648 | 16,622 | 17,521 | 17,940 |
| Mining and Quarrying | B | 4,529 | 4,470 | 4,642 | 4,790 | 4,736 | 4,551 | 4,484 | 4,634 | 4,561 | 4,626 | 4,487 |
| Manufacturing | C | 62,409 | 67,834 | 71,493 | 73,365 | 72,302 | 72,453 | 72,407 | 76,046 | 78,733 | 81,831 | * |
| Electricity, Gas, Steam and Air Conditioning Supply | D | 15,888 | 18,138 | 19,538 | 20,009 | 19,824 | 19,706 | 20,171 | 21,320 | 22,694 | 24,516 | 25,802 |
| Water supply; sewerage, waste management and remediation activities | E | 9,797 | 10,414 | 11,032 | 10,548 | 10,158 | 9,770 | 10,092 | 10,683 | 11,341 | 12,419 | 13,587 |
| Construction | F | 6,082 | 6,835 | 7,390 | 7,407 | 7,186 | 6,683 | 6,163 | 5,893 | 5,604 | 5,629 | 5,412 |
| Wholesale and Retail Trade; Repair of Motor Vehicles and Motorcycles | G | 14,803 | 16,667 | 17,705 | 17,633 | 16,360 | 15,872 | 16,439 | 17,361 | 18,320 | 19,728 | 21,482 |
| Transportation and Storage | H | 23,055 | 24,930 | 27,712 | 29,075 | 30,060 | 30,490 | 31,480 | 33,014 | 33,677 | 34,350 | 35,465 |
| Accommodation and Food Service Activities | I | 8,789 | 9,507 | 9,706 | 9,510 | 8,448 | 8,144 | 8,180 | 8,310 | 8,545 | 8,970 | 9,212 |
| Information and Communication | J | 18,803 | 21,163 | 23,321 | 25,216 | 26,397 | 27,608 | 29,917 | 35,223 | 38,374 | 42,698 | 52,026 |
| Financial and Insurance Activities | K | 10,613 | 11,779 | 12,618 | 12,400 | 11,811 | 11,600 | 11,950 | 12,646 | 13,275 | 14,299 | 15,782 |
| Real Estate Activities | L | 312,009 | 357,426 | 358,765 | 312,660 | 262,084 | 251,141 | 254,565 | 261,471 | 271,194 | 290,169 | 314,050 |
| of which: | ||||||||||||
| Dwellings | 306,421 | 349,606 | 348,819 | 303,061 | 254,246 | 244,542 | 249,030 | 255,883 | 265,414 | 283,127 | 305,137 | |
| Professional, Scientific and Technical Activities | M | 5,927 | 6,632 | 7,365 | 7,618 | 7,373 | 7,787 | 8,619 | 10,076 | 11,739 | 13,173 | 15,120 |
| Administrative and Support Service Activities | N | 32,206 | 36,142 | 39,058 | 40,185 | 45,523 | 50,991 | 54,536 | 62,278 | 68,975 | 90,345 | * |
| Public Administration and Defence; Compulsory Social Security | O | 45,561 | 50,021 | 54,789 | 53,779 | 52,294 | 49,810 | 50,612 | 52,985 | 55,090 | 58,374 | 62,407 |
| of which: | ||||||||||||
| Roads | 31,667 | 34,666 | 38,090 | 37,497 | 37,591 | 35,772 | 36,530 | 38,337 | 39,852 | 42,367 | 45,222 | |
| Education | P | 16,778 | 18,246 | 19,425 | 19,061 | 17,603 | 17,139 | 17,322 | 18,264 | 18,871 | 19,560 | 20,597 |
| Human Health and Social Work Activities | Q | 9,877 | 10,484 | 11,010 | 10,639 | 9,893 | 9,661 | 10,080 | 10,519 | 11,318 | 12,331 | 13,317 |
| Arts, Entertainment and Recreation | R | 3,017 | 3,395 | 3,750 | 3,963 | 3,892 | 3,850 | 3,926 | 4,043 | 4,204 | 4,551 | 4,845 |
| Other Service Activities | S | 1,071 | 1,161 | 1,221 | 1,231 | 1,210 | 1,193 | 1,178 | 1,190 | 1,224 | 1,339 | 1,378 |
| Total | 616,619 | 691,299 | 716,919 | 676,939 | 623,834 | 614,397 | 628,244 | 662,605 | 694,361 | 756,429 | 1,087,854 | |
| * Suppressed for confidentiality reasons | ||||||||||||
| Table 6 Gross Capital Stock held at end of year by type of industry at constant market prices (base 2014) | € million | |||||||||||
| Nace Rev 2 Section | 2005 | 2006 | 2007 | 2008 | 2009 | 2010 | 2011 | 2012 | 2013 | 2014 | 2015 | |
| Agriculture, Forestry and Fishing | A | 15,966 | 16,084 | 16,538 | 17,647 | 17,525 | 17,302 | 17,267 | 17,351 | 17,431 | 17,521 | 17,714 |
| Mining and Quarrying | B | 4,202 | 4,349 | 4,514 | 4,699 | 4,874 | 4,897 | 4,883 | 4,969 | 4,803 | 4,626 | 4,423 |
| Manufacturing | C | 60,322 | 64,284 | 67,575 | 70,272 | 73,027 | 74,867 | 76,730 | 78,378 | 80,362 | 81,831 | * |
| Electricity, Gas, Steam and Air Conditioning Supply | D | 16,038 | 17,309 | 18,268 | 19,336 | 20,440 | 21,518 | 22,171 | 22,930 | 23,876 | 24,516 | 25,034 |
| Water supply; sewerage, waste management and remediation activities | E | 8,220 | 8,646 | 9,165 | 9,713 | 10,360 | 10,796 | 11,173 | 11,504 | 11,878 | 12,419 | 12,908 |
| Construction | F | 6,150 | 6,747 | 7,364 | 7,479 | 7,261 | 6,900 | 6,527 | 6,197 | 5,875 | 5,629 | 5,495 |
| Wholesale and Retail Trade; Repair of Motor Vehicles and Motorcycles | G | 13,410 | 14,655 | 15,697 | 16,431 | 16,571 | 16,743 | 17,550 | 18,136 | 18,853 | 19,728 | 20,917 |
| Transportation and Storage | H | 21,118 | 22,533 | 25,123 | 27,329 | 30,129 | 31,949 | 33,403 | 34,314 | 34,411 | 34,350 | 34,525 |
| Accommodation and Food Service Activities | I | 7,407 | 7,765 | 8,038 | 8,490 | 8,613 | 8,757 | 8,868 | 8,850 | 8,945 | 8,970 | 9,009 |
| Information and Communication | J | 19,934 | 21,527 | 23,168 | 24,784 | 26,424 | 28,583 | 31,653 | 35,690 | 38,381 | 42,698 | 50,812 |
| Financial and Insurance Activities | K | 9,290 | 9,983 | 10,750 | 11,296 | 12,111 | 12,445 | 12,879 | 13,252 | 13,674 | 14,299 | 15,189 |
| Real Estate Activities | L | 229,470 | 245,539 | 260,196 | 271,585 | 277,935 | 280,839 | 282,562 | 284,397 | 286,513 | 290,169 | 294,299 |
| of which: | ||||||||||||
| Dwellings | 225,006 | 239,557 | 252,608 | 263,487 | 269,954 | 273,559 | 276,448 | 278,395 | 280,473 | 283,127 | 285,826 | |
| Professional, Scientific and Technical Activities | M | 5,544 | 6,156 | 6,889 | 7,308 | 7,445 | 8,052 | 9,073 | 10,203 | 11,739 | 13,173 | 14,805 |
| Administrative and Support Service Activities | N | 32,948 | 36,557 | 39,416 | 39,978 | 45,030 | 51,563 | 56,126 | 63,149 | 69,087 | 90,345 | * |
| Public Administration and Defence; Compulsory Social Security | O | 41,987 | 44,385 | 47,401 | 50,722 | 53,235 | 54,829 | 55,852 | 56,840 | 57,535 | 58,374 | 59,293 |
| of which: | ||||||||||||
| Roads | 30,346 | 31,942 | 33,911 | 36,286 | 38,292 | 39,607 | 40,486 | 41,299 | 41,725 | 42,367 | 42,862 | |
| Education | P | 14,308 | 15,124 | 15,979 | 16,935 | 17,709 | 18,275 | 18,734 | 19,056 | 19,294 | 19,560 | 19,774 |
| Human Health and Social Work Activities | Q | 8,334 | 8,594 | 9,126 | 9,630 | 10,067 | 10,428 | 10,922 | 11,168 | 11,786 | 12,331 | 12,966 |
| Arts, Entertainment and Recreation | R | 2,654 | 2,919 | 3,252 | 3,649 | 4,015 | 4,206 | 4,328 | 4,380 | 4,424 | 4,551 | 4,654 |
| Other Service Activities | S | 1,039 | 1,103 | 1,174 | 1,216 | 1,236 | 1,239 | 1,242 | 1,246 | 1,274 | 1,339 | 1,381 |
| Total | 518,341 | 554,258 | 589,632 | 618,500 | 644,005 | 664,187 | 681,942 | 702,012 | 720,140 | 756,429 | 1,052,084 | |
| * Suppressed for confidentiality reasons | ||||||||||||
| Table 7 Gross Capital Stock held at end of year by asset type at current market prices | € million | ||||||||||
| Asset Category | 2005 | 2006 | 2007 | 2008 | 2009 | 2010 | 2011 | 2012 | 2013 | 2014 | 2015 |
| Dwellings, excluding land | 306,421 | 349,606 | 348,819 | 303,061 | 254,246 | 244,542 | 249,030 | 255,883 | 265,414 | 283,127 | 305,137 |
| Other buildings and structures | 169,056 | 184,839 | 197,531 | 191,069 | 173,110 | 163,273 | 166,545 | 175,628 | 185,863 | 200,440 | 218,272 |
| of which: | |||||||||||
| Roads | 31,667 | 34,666 | 38,090 | 37,497 | 37,591 | 35,772 | 36,530 | 38,337 | 39,852 | 42,367 | 45,222 |
| Transport equipment | 57,924 | 64,330 | 70,397 | 73,362 | 80,528 | 85,803 | 88,636 | 96,429 | 102,304 | 122,117 | * |
| Other machinery and equipment | 47,457 | 51,268 | 52,010 | 53,856 | 55,798 | 56,718 | 56,655 | 57,290 | 59,375 | 65,738 | 67,190 |
| of which: | |||||||||||
| Office machinery and hardware | 5,833 | 6,711 | 6,676 | 6,733 | 7,699 | 8,018 | 9,041 | 10,124 | 10,673 | 11,237 | 12,595 |
| Cultivated assets | 1,759 | 1,914 | 1,865 | 2,158 | 1,884 | 1,880 | 2,281 | 2,608 | 2,250 | 2,274 | 2,378 |
| Intangible fixed assets | 34,001 | 39,342 | 46,298 | 53,434 | 58,267 | 62,181 | 65,097 | 74,767 | 79,154 | 82,733 | * |
| of which: | |||||||||||
| Computer software | 3,687 | 3,857 | 4,238 | 4,528 | 4,537 | 5,009 | 5,348 | 5,960 | 6,431 | 6,965 | 8,053 |
| Research and development | 28,256 | 33,256 | 39,697 | 46,425 | 51,205 | 54,718 | 57,249 | 66,158 | 70,093 | 73,114 | * |
| Total | 616,619 | 691,299 | 716,919 | 676,939 | 623,834 | 614,397 | 628,244 | 662,605 | 694,361 | 756,429 | 1,087,854 |
| * Suppressed for confidentiality reasons | |||||||||||
| Table 8 Gross Capital Stock held at end of year by asset type at constant market prices (base 2014) | € million | ||||||||||
| Asset Category | 2005 | 2006 | 2007 | 2008 | 2009 | 2010 | 2011 | 2012 | 2013 | 2014 | 2015 |
| Dwellings, excluding land | 225,006 | 239,557 | 252,608 | 263,487 | 269,954 | 273,559 | 276,448 | 278,395 | 280,473 | 283,127 | 285,826 |
| Other buildings and structures | 143,903 | 151,428 | 160,063 | 169,318 | 176,179 | 180,660 | 184,540 | 189,208 | 194,611 | 200,440 | 206,869 |
| of which: | |||||||||||
| Roads | 30,346 | 31,942 | 33,911 | 36,286 | 38,292 | 39,607 | 40,486 | 41,299 | 41,725 | 42,367 | 42,862 |
| Transport equipment | 59,205 | 65,267 | 71,203 | 73,415 | 79,709 | 86,634 | 91,063 | 97,711 | 102,517 | 122,117 | * |
| Other machinery and equipment | 49,531 | 51,999 | 54,949 | 57,412 | 58,308 | 58,847 | 60,080 | 60,502 | 62,696 | 65,738 | 70,322 |
| of which: | |||||||||||
| Office machinery and hardware | 5,351 | 5,813 | 6,638 | 7,337 | 7,973 | 8,618 | 9,713 | 10,218 | 10,718 | 11,237 | 12,595 |
| Cultivated assets | 2,322 | 2,356 | 2,325 | 2,324 | 2,270 | 2,207 | 2,229 | 2,300 | 2,277 | 2,274 | 2,274 |
| Intangible fixed assets | 38,375 | 43,649 | 48,485 | 52,543 | 57,585 | 62,280 | 67,581 | 73,895 | 77,566 | 82,733 | * |
| of which: | |||||||||||
| Computer software | 4,279 | 4,429 | 4,679 | 4,890 | 5,111 | 5,389 | 5,681 | 6,080 | 6,506 | 6,965 | 7,536 |
| Research and development | 32,062 | 37,075 | 41,577 | 45,257 | 49,865 | 54,161 | 59,097 | 64,900 | 68,277 | 73,114 | * |
| Total | 518,341 | 554,258 | 589,632 | 618,500 | 644,005 | 664,187 | 681,942 | 702,012 | 720,140 | 756,429 | 1,052,084 |
| * Suppressed for confidentiality reasons | |||||||||||
| Table 9 Consumption of Fixed Capital by type of industry at current market prices | € million | |||||||||||
| Nace Rev 2 Section | 2005 | 2006 | 2007 | 2008 | 2009 | 2010 | 2011 | 2012 | 2013 | 2014 | 2015 | |
| Agriculture, Forestry and Fishing | A | 767 | 819 | 826 | 869 | 852 | 796 | 759 | 756 | 772 | 828 | 840 |
| Mining and Quarrying | B | 342 | 352 | 392 | 418 | 438 | 424 | 402 | 416 | 412 | 381 | 355 |
| Manufacturing | C | 3,844 | 4,319 | 4,571 | 4,781 | 4,765 | 4,753 | 4,656 | 4,866 | 4,962 | 4,917 | * |
| Electricity, Gas, Steam and Air Conditioning Supply | D | 718 | 829 | 902 | 911 | 887 | 871 | 893 | 931 | 982 | 1,037 | 1,067 |
| Water supply; sewerage, waste management and remediation activities | E | 201 | 212 | 223 | 216 | 208 | 203 | 207 | 217 | 227 | 244 | 269 |
| Construction | F | 446 | 505 | 554 | 561 | 520 | 448 | 377 | 333 | 298 | 284 | 272 |
| Wholesale and Retail Trade; Repair of Motor Vehicles and Motorcycles | G | 1,367 | 1,779 | 1,649 | 1,385 | 1,161 | 1,066 | 1,049 | 1,083 | 1,106 | 1,243 | 1,436 |
| Transportation and Storage | H | 1,238 | 1,372 | 1,523 | 1,635 | 1,733 | 1,781 | 1,754 | 1,783 | 1,744 | 1,524 | 1,509 |
| Accommodation and Food Service Activities | I | 618 | 696 | 629 | 574 | 450 | 419 | 398 | 391 | 389 | 410 | 419 |
| Information and Communication | J | 1,447 | 1,629 | 1,787 | 1,968 | 2,090 | 2,270 | 2,489 | 3,076 | 3,484 | 3,802 | 4,774 |
| Financial and Insurance Activities | K | 733 | 863 | 882 | 819 | 785 | 830 | 848 | 882 | 882 | 930 | 1,015 |
| Real Estate Activities | L | 5,898 | 7,253 | 6,899 | 5,329 | 3,988 | 3,708 | 3,660 | 3,707 | 3,879 | 4,251 | 4,606 |
| of which: | ||||||||||||
| Dwellings | 5,627 | 6,863 | 6,390 | 4,932 | 3,701 | 3,476 | 3,469 | 3,536 | 3,710 | 4,034 | 4,316 | |
| Professional, Scientific and Technical Activities | M | 470 | 540 | 646 | 640 | 602 | 614 | 711 | 895 | 1,084 | 1,240 | 1,425 |
| Administrative and Support Service Activities | N | 2,743 | 3,692 | 3,677 | 3,518 | 3,516 | 3,828 | 4,100 | 4,533 | 5,038 | 6,470 | * |
| Public Administration and Defence; Compulsory Social Security | O | 1,311 | 1,316 | 1,407 | 1,385 | 1,362 | 1,295 | 1,282 | 1,305 | 1,323 | 1,361 | 1,422 |
| of which: | ||||||||||||
| Roads | 719 | 793 | 874 | 863 | 877 | 842 | 854 | 885 | 910 | 949 | 998 | |
| Education | P | 628 | 835 | 925 | 974 | 964 | 949 | 921 | 962 | 976 | 980 | 1,012 |
| Human Health and Social Work Activities | Q | 435 | 464 | 473 | 466 | 442 | 424 | 436 | 454 | 484 | 549 | 603 |
| Arts, Entertainment and Recreation | R | 279 | 310 | 345 | 343 | 339 | 328 | 330 | 328 | 330 | 348 | 369 |
| Other Service Activities | S | 80 | 88 | 90 | 88 | 86 | 82 | 77 | 76 | 79 | 93 | 102 |
| Total | 23,566 | 27,873 | 28,400 | 26,880 | 25,189 | 25,087 | 25,349 | 26,994 | 28,452 | 30,891 | 61,558 | |
| * Suppressed for confidentiality reasons | ||||||||||||
 Show Table 10 Consumption of Fixed Capital by type of industry at constant market prices (base 2014)
| Table 10 Consumption of Fixed Capital by type of industry at constant market prices (base 2014) | € million | |||||||||||
| Nace Rev 2 Section | 2005 | 2006 | 2007 | 2008 | 2009 | 2010 | 2011 | 2012 | 2013 | 2014 | 2015 | |
| Agriculture, Forestry and Fishing | A | 758 | 774 | 797 | 850 | 875 | 842 | 818 | 808 | 815 | 828 | 841 |
| Mining and Quarrying | B | 339 | 342 | 372 | 405 | 448 | 462 | 441 | 446 | 432 | 381 | 343 |
| Manufacturing | C | 3,881 | 4,277 | 4,497 | 4,608 | 4,712 | 4,795 | 4,857 | 4,906 | 4,975 | 4,917 | * |
| Electricity, Gas, Steam and Air Conditioning Supply | D | 728 | 799 | 852 | 884 | 916 | 950 | 979 | 995 | 1,028 | 1,037 | 1,033 |
| Water supply; sewerage, waste management and remediation activities | E | 170 | 177 | 186 | 199 | 212 | 223 | 229 | 233 | 237 | 244 | 256 |
| Construction | F | 454 | 504 | 557 | 568 | 523 | 460 | 397 | 347 | 309 | 284 | 274 |
| Wholesale and Retail Trade; Repair of Motor Vehicles and Motorcycles | G | 1,191 | 1,394 | 1,357 | 1,241 | 1,142 | 1,075 | 1,089 | 1,115 | 1,128 | 1,243 | 1,407 |
| Transportation and Storage | H | 1,103 | 1,210 | 1,353 | 1,481 | 1,595 | 1,678 | 1,679 | 1,669 | 1,607 | 1,524 | 1,485 |
| Accommodation and Food Service Activities | I | 498 | 523 | 495 | 481 | 447 | 436 | 426 | 413 | 406 | 410 | 414 |
| Information and Communication | J | 1,561 | 1,689 | 1,820 | 1,951 | 2,083 | 2,290 | 2,599 | 3,072 | 3,446 | 3,802 | 4,680 |
| Financial and Insurance Activities | K | 659 | 733 | 773 | 765 | 803 | 864 | 896 | 905 | 898 | 930 | 977 |
| Real Estate Activities | L | 4,168 | 4,624 | 4,596 | 4,211 | 4,036 | 3,977 | 4,013 | 4,034 | 4,107 | 4,251 | 4,318 |
| of which: | ||||||||||||
| Dwellings | 3,962 | 4,352 | 4,247 | 3,896 | 3,749 | 3,722 | 3,803 | 3,852 | 3,931 | 4,034 | 4,041 | |
| Professional, Scientific and Technical Activities | M | 451 | 518 | 610 | 622 | 602 | 623 | 741 | 892 | 1,071 | 1,240 | 1,397 |
| Administrative and Support Service Activities | N | 2,803 | 3,729 | 3,705 | 3,500 | 3,479 | 3,871 | 4,218 | 4,594 | 5,045 | 6,470 | * |
| Public Administration and Defence; Compulsory Social Security | O | 1,150 | 1,224 | 1,298 | 1,373 | 1,423 | 1,426 | 1,429 | 1,412 | 1,398 | 1,361 | 1,388 |
| of which: | ||||||||||||
| Roads | 689 | 731 | 778 | 835 | 892 | 918 | 947 | 954 | 953 | 949 | 946 | |
| Education | P | 711 | 778 | 829 | 876 | 919 | 939 | 943 | 948 | 951 | 980 | 955 |
| Human Health and Social Work Activities | Q | 401 | 413 | 427 | 444 | 449 | 448 | 463 | 475 | 501 | 549 | 598 |
| Arts, Entertainment and Recreation | R | 253 | 278 | 313 | 331 | 352 | 360 | 367 | 362 | 350 | 348 | 352 |
| Other Service Activities | S | 78 | 83 | 87 | 88 | 87 | 84 | 81 | 79 | 82 | 93 | 102 |
| Total | 21,355 | 24,067 | 24,924 | 24,878 | 25,105 | 25,804 | 26,666 | 27,708 | 28,785 | 30,891 | 60,295 | |
| * Suppressed for confidentiality reasons | ||||||||||||
| Table 11 Consumption of Fixed Capital by asset type at current market prices | € million | ||||||||||
| Asset Category | 2005 | 2006 | 2007 | 2008 | 2009 | 2010 | 2011 | 2012 | 2013 | 2014 | 2015 |
| Dwellings, excluding land | 5,627 | 6,863 | 6,390 | 4,932 | 3,701 | 3,476 | 3,469 | 3,536 | 3,710 | 4,034 | 4,316 |
| Other buildings and structures | 5,784 | 6,821 | 6,704 | 5,772 | 4,817 | 4,468 | 4,457 | 4,609 | 4,886 | 5,159 | 5,571 |
| of which: | |||||||||||
| Roads | 719 | 793 | 874 | 863 | 877 | 842 | 854 | 885 | 910 | 949 | 998 |
| Transport equipment | 5,024 | 6,226 | 6,528 | 6,584 | 6,628 | 6,777 | 6,826 | 7,123 | 7,495 | 8,742 | * |
| Other machinery and equipment | 2,916 | 3,149 | 3,211 | 3,352 | 3,496 | 3,451 | 3,419 | 3,486 | 3,521 | 3,873 | 4,110 |
| of which: | |||||||||||
| Office machinery and hardware | 665 | 727 | 750 | 798 | 920 | 946 | 1,053 | 1,204 | 1,216 | 1,251 | 1,406 |
| Cultivated assets | 0 | 0 | 0 | 0 | 0 | 0 | 0 | 0 | 0 | 0 | 0 |
| Intangible fixed assets | 4,215 | 4,815 | 5,567 | 6,239 | 6,548 | 6,915 | 7,178 | 8,239 | 8,840 | 9,083 | * |
| of which: | |||||||||||
| Computer software | 674 | 707 | 787 | 855 | 851 | 933 | 1,001 | 1,119 | 1,219 | 1,320 | 1,521 |
| Research and development | 3,171 | 3,714 | 4,337 | 4,912 | 5,210 | 5,513 | 5,716 | 6,641 | 7,140 | 7,303 | * |
| Total | 23,566 | 27,873 | 28,400 | 26,880 | 25,189 | 25,087 | 25,349 | 26,994 | 28,452 | 30,891 | 61,558 |
| * Suppressed for confidentiality reasons | |||||||||||
| Table 12 Consumption of Fixed Capital by asset type at constant market prices (base 2014) | € million | ||||||||||
| Asset Category | 2005 | 2006 | 2007 | 2008 | 2009 | 2010 | 2011 | 2012 | 2013 | 2014 | 2015 |
| Dwellings, excluding land | 3,962 | 4,352 | 4,247 | 3,896 | 3,749 | 3,722 | 3,803 | 3,852 | 3,931 | 4,034 | 4,041 |
| Other buildings and structures | 4,545 | 4,931 | 4,880 | 4,641 | 4,615 | 4,656 | 4,737 | 4,812 | 4,968 | 5,159 | 5,269 |
| of which: | |||||||||||
| Roads | 689 | 731 | 778 | 835 | 892 | 918 | 947 | 954 | 953 | 949 | 946 |
| Transport equipment | 5,138 | 6,317 | 6,605 | 6,594 | 6,562 | 6,841 | 7,011 | 7,217 | 7,511 | 8,742 | * |
| Other machinery and equipment | 2,964 | 3,135 | 3,362 | 3,579 | 3,644 | 3,602 | 3,633 | 3,644 | 3,678 | 3,873 | 4,262 |
| of which: | |||||||||||
| Office machinery and hardware | 577 | 627 | 746 | 871 | 954 | 1,019 | 1,134 | 1,214 | 1,221 | 1,251 | 1,406 |
| Cultivated assets | 0 | 0 | 0 | 0 | 0 | 0 | 0 | 0 | 0 | 0 | 0 |
| Intangible fixed assets | 4,746 | 5,332 | 5,830 | 6,168 | 6,535 | 6,983 | 7,481 | 8,184 | 8,697 | 9,083 | * |
| of which: | |||||||||||
| Computer software | 783 | 812 | 868 | 923 | 959 | 1,004 | 1,063 | 1,141 | 1,233 | 1,320 | 1,423 |
| Research and development | 3,598 | 4,141 | 4,542 | 4,789 | 5,074 | 5,457 | 5,900 | 6,515 | 6,955 | 7,303 | * |
| Total | 21,355 | 24,067 | 24,924 | 24,878 | 25,105 | 25,804 | 26,666 | 27,708 | 28,785 | 30,891 | 60,295 |
| * Suppressed for confidentiality reasons | |||||||||||
| Table 13 Net Capital Stock held at end of year by type of industry & asset at current market prices, 2015 | € million | ||||||||||
| Nace Rev 2 Section | Dwellings, excluding land | Other buildings & structures | Transport equipment | Other machinery & equipment | of which: Office machinery & hardware | Cultivated assets | Intangible fixed assets | of which: | Total Fixed Assets | ||
| Computer software | Research and Development | ||||||||||
| Agriculture, Forestry and Fishing | A | 0 | 4,404 | 555 | 2,358 | 8 | 2,378 | 9 | 4 | 6 | 9,704 |
| Mining and Quarrying | B | 0 | 480 | 20 | 640 | 2 | 0 | 523 | 4 | 7 | 1,663 |
| Manufacturing | C | 0 | 12,779 | * | 13,777 | 441 | 0 | * | 504 | * | * |
| Electricity, Gas, Steam and Air Conditioning Supply | D | 0 | 10,593 | 115 | 2,579 | 174 | 0 | 195 | 174 | 21 | 13,481 |
| Water supply; sewerage, waste management and remediation activities | E | 0 | 8,723 | 20 | 106 | 14 | 0 | 28 | 11 | 17 | 8,877 |
| Construction | F | 0 | 790 | 451 | 920 | 28 | 0 | 28 | 20 | 8 | 2,188 |
| Wholesale and Retail Trade; Repair of Motor Vehicles and Motorcycles | G | 0 | 7,121 | 1,742 | 1,817 | 671 | 0 | 1,485 | 263 | 1,222 | 12,165 |
| Transportation and Storage | H | 0 | 8,925 | 7,910 | 653 | 246 | 0 | 93 | 89 | 4 | 17,581 |
| Accommodation and Food Service Activities | I | 0 | 2,592 | 120 | 1,266 | 53 | 0 | 19 | 12 | 7 | 3,997 |
| Information and Communication | J | 0 | 6,379 | 224 | 3,206 | 2,594 | 0 | 18,536 | 497 | 18,039 | 28,344 |
| Financial and Insurance Activities | K | 0 | 5,854 | 871 | 673 | 382 | 0 | 944 | 743 | 201 | 8,343 |
| Real Estate Activities | L | 237,802 | 5,516 | 41 | 118 | 68 | 0 | 154 | 50 | 103 | 243,631 |
| of which: | |||||||||||
| Dwellings | 237,802 | 237,802 | |||||||||
| Professional, Scientific and Technical Activities | M | 0 | 1,792 | 331 | 461 | 181 | 0 | 5,429 | 83 | 5,346 | 8,013 |
| Administrative and Support Service Activities | N | 0 | 485 | * | 1,201 | 558 | 0 | * | 325 | * | * |
| Public Administration and Defence; Compulsory Social Security | O | 0 | 40,889 | 360 | 391 | 120 | 0 | 535 | 135 | 400 | 42,174 |
| of which: | |||||||||||
| Roads | 29,356 | 29,356 | |||||||||
| Education | P | 0 | 7,328 | 30 | 271 | 69 | 0 | 2,633 | 129 | 2,504 | 10,262 |
| Human Health and Social Work Activities | Q | 0 | 5,271 | 311 | 1,807 | 131 | 0 | 213 | 78 | 135 | 7,602 |
| Arts, Entertainment and Recreation | R | 0 | 1,591 | 45 | 394 | 49 | 0 | 375 | 19 | 11 | 2,406 |
| Other Service Activities | S | 0 | 174 | 116 | 319 | 21 | 0 | 30 | 23 | 6 | 639 |
| Total | 237,802 | 131,684 | * | 32,958 | 5,809 | 2,378 | * | 3,162 | * | 760,793 | |
| * Suppressed for confidentiality reasons | |||||||||||
| Table 14 Gross Capital Stock held at end of year by type of industry & asset at current market prices, 2015 | € million | ||||||||||
| Nace Rev 2 Section | Dwellings, excluding land | Other buildings & structures | Transport equipment | Other machinery & equipment | of which: Office machinery & hardware | Cultivated assets | Intangible fixed assets | of which: | Total Fixed Assets | ||
| Computer software | Research and Development | ||||||||||
| Agriculture, Forestry and Fishing | A | 0 | 9,039 | 1,409 | 5,090 | 18 | 2,378 | 25 | 10 | 14 | 17,940 |
| Mining and Quarrying | B | 0 | 1,238 | 65 | 1,509 | 9 | 0 | 1,675 | 10 | 19 | 4,487 |
| Manufacturing | C | 0 | 24,391 | * | 25,562 | 864 | 0 | * | 1,343 | * | * |
| Electricity, Gas, Steam and Air Conditioning Supply | D | 0 | 20,114 | 263 | 4,925 | 430 | 0 | 501 | 460 | 41 | 25,802 |
| Water supply; sewerage, waste management and remediation activities | E | 0 | 13,251 | 42 | 240 | 23 | 0 | 54 | 15 | 39 | 13,587 |
| Construction | F | 0 | 1,253 | 1,474 | 2,619 | 62 | 0 | 66 | 53 | 13 | 5,412 |
| Wholesale and Retail Trade; Repair of Motor Vehicles and Motorcycles | G | 0 | 10,734 | 4,224 | 3,879 | 1,567 | 0 | 2,645 | 696 | 1,949 | 21,482 |
| Transportation and Storage | H | 0 | 14,858 | 18,481 | 1,872 | 713 | 0 | 253 | 246 | 6 | 35,465 |
| Accommodation and Food Service Activities | I | 0 | 6,005 | 289 | 2,876 | 137 | 0 | 43 | 33 | 11 | 9,212 |
| Information and Communication | J | 0 | 11,422 | 525 | 6,716 | 5,460 | 0 | 33,364 | 1,323 | 32,040 | 52,026 |
| Financial and Insurance Activities | K | 0 | 9,486 | 1,988 | 1,804 | 1,060 | 0 | 2,505 | 1,878 | 627 | 15,782 |
| Real Estate Activities | L | 305,137 | 8,306 | 95 | 255 | 137 | 0 | 257 | 114 | 144 | 314,050 |
| of which: | |||||||||||
| Dwellings | 305,137 | 305,137 | |||||||||
| Professional, Scientific and Technical Activities | M | 0 | 2,952 | 736 | 1,386 | 382 | 0 | 10,047 | 301 | 9,746 | 15,120 |
| Administrative and Support Service Activities | N | 0 | 690 | * | 1,915 | 827 | 0 | * | 541 | * | * |
| Public Administration and Defence; Compulsory Social Security | O | 0 | 59,157 | 883 | 992 | 307 | 0 | 1,375 | 374 | 1,001 | 62,407 |
| of which: | |||||||||||
| Roads | 45,222 | 45,222 | |||||||||
| Education | P | 0 | 13,486 | 75 | 626 | 189 | 0 | 6,411 | 347 | 6,063 | 20,597 |
| Human Health and Social Work Activities | Q | 0 | 8,724 | 746 | 3,335 | 248 | 0 | 512 | 196 | 317 | 13,317 |
| Arts, Entertainment and Recreation | R | 0 | 2,833 | 94 | 866 | 120 | 0 | 1,052 | 52 | 18 | 4,845 |
| Other Service Activities | S | 0 | 334 | 242 | 725 | 42 | 0 | 76 | 59 | 17 | 1,378 |
| Total | 305,137 | 218,272 | * | 67,190 | 12,595 | 2,378 | * | 8,053 | * | 1,087,854 | |
| * Suppressed for confidentiality reasons | |||||||||||
| Table 15 Consumption of Fixed Capital by type of industry & asset at current market prices, 2015 | € million | ||||||||||
| Nace Rev 2 Section | Dwellings, excluding land | Other buildings & structures | Transport equipment | Other machinery & equipment | of which: Office machinery & hardware | Cultivated assets | Intangible fixed assets | of which: | Total Fixed Assets | ||
| Computer software | Research and Development | ||||||||||
| Agriculture, Forestry and Fishing | A | 0 | 389 | 118 | 330 | 2 | 0 | 3 | 2 | 1 | 840 |
| Mining and Quarrying | B | 0 | 17 | 5 | 56 | 1 | 0 | 278 | 2 | 2 | 355 |
| Manufacturing | C | 0 | 590 | * | 1,138 | 97 | 0 | * | 252 | * | * |
| Electricity, Gas, Steam and Air Conditioning Supply | D | 0 | 747 | 28 | 204 | 47 | 0 | 88 | 83 | 5 | 1,067 |
| Water supply; sewerage, waste management and remediation activities | E | 0 | 250 | 4 | 9 | 3 | 0 | 7 | 3 | 4 | 269 |
| Construction | F | 0 | 51 | 107 | 103 | 6 | 0 | 11 | 10 | 2 | 272 |
| Wholesale and Retail Trade; Repair of Motor Vehicles and Motorcycles | G | 0 | 366 | 371 | 341 | 191 | 0 | 358 | 132 | 226 | 1,436 |
| Transportation and Storage | H | 0 | 186 | 1,140 | 133 | 69 | 0 | 50 | 49 | 1 | 1,509 |
| Accommodation and Food Service Activities | I | 0 | 201 | 25 | 185 | 15 | 0 | 8 | 7 | 1 | 419 |
| Information and Communication | J | 0 | 356 | 48 | 672 | 589 | 0 | 3,698 | 240 | 3,458 | 4,774 |
| Financial and Insurance Activities | K | 0 | 269 | 186 | 148 | 106 | 0 | 412 | 365 | 47 | 1,015 |
| Real Estate Activities | L | 4,316 | 201 | 9 | 29 | 21 | 0 | 51 | 31 | 21 | 4,606 |
| of which: | |||||||||||
| Dwellings | 4,316 | 4,316 | |||||||||
| Professional, Scientific and Technical Activities | M | 0 | 108 | 69 | 91 | 46 | 0 | 1,158 | 52 | 1,107 | 1,425 |
| Administrative and Support Service Activities | N | 0 | 48 | * | 194 | 115 | 0 | * | 104 | * | * |
| Public Administration and Defence; Compulsory Social Security | O | 0 | 1,118 | 78 | 70 | 31 | 0 | 157 | 66 | 91 | 1,422 |
| of which: | |||||||||||
| Roads | 998 | 998 | |||||||||
| Education | P | 0 | 333 | 6 | 48 | 20 | 0 | 624 | 64 | 560 | 1,012 |
| Human Health and Social Work Activities | Q | 0 | 217 | 68 | 251 | 28 | 0 | 68 | 38 | 30 | 603 |
| Arts, Entertainment and Recreation | R | 0 | 110 | 9 | 63 | 14 | 0 | 187 | 8 | 2 | 369 |
| Other Service Activities | S | 0 | 14 | 23 | 49 | 7 | 0 | 16 | 14 | 2 | 102 |
| Total | 4,316 | 5,571 | * | 4,110 | 1,406 | 0 | * | 1,521 | * | 61,558 | |
| * Suppressed for confidentiality reasons | |||||||||||
This release belongs to the annual series providing estimates of the values of the stocks of fixed assets according to the European System of Accounts 2010 (ESA 2010) methodology. The capital stocks are estimated using a Perpetual Inventory Method. In this system the level of stocks are derived from the investment amounts which were made over the preceding years. The annual investments are depreciated by a depreciation function to obtain “net” values (i.e. net of depreciation). The investments are also revalued in the process to update them from their prices in the historical year in which they were purchased to the year for which estimates are being made.
The assets covered in these tables relate to Produced Fixed Assets as defined in ESA2010. Produced fixed assets are assets which result from human effort. They exclude natural assets such as land, mineral deposits etc. Produced fixed assets comprise:
Revisions arise as amendments are made to the investment amounts i.e. to Gross Fixed Capital Formation (GFCF) in the national accounts. Revisions also arise from improved sources or estimation methods. Data relating to the most recent year are also added to the series.
The two most common valuation methods for fixed capital assets are Gross and Net. The gross capital stock represents the value of the stock still in use (i.e. not retired or scrapped) and valued at the price of new capital goods. The term Gross means gross of consumption of fixed capital (the national accounts term for depreciation). Thus the gross stock of assets ignores decay of assets and considers past investments as new – only retirement is taken into account. In practice fixed assets normally decline in value over time due to factors such as wear and tear and obsolescence. Taking this declining value into account together with retirements give rise to the Net value of the stock of assets. Estimates are provided in this release using both valuation concepts.
The stock of assets is generally valued in current and constant prices. Valuation in current prices implies that all the assets accumulated over the years are valued at the prices obtaining in the year for which the estimates are given. In the case of the gross stock this is the price of new assets. In the case of the net stock it is the written down price of assets. Valuation at constant prices represents the stock of capital assets in the price of the stated reference year (2014 in these tables).
Catastrophic losses arise, generally infrequently, due to exceptional events such as acts of war or unusually severe weather conditions. Some of the severest weather conditions ever experienced in Ireland in living memory occurred towards the end of 2009 and early in 2010. Considerable flooding took place in 2009 and estimates have been made by which the stock of assets were reduced in 2009 and 2010 to take account of these disasters.
Consumption of Fixed capital (also known as depreciation) automatically becomes available as a by-product of the calculation of the stock of fixed assets in net and gross terms. Estimates of the consumption of fixed capital are provided in the release in current and constant terms.
All tables are available from the year 1985 in the CSO databank.
 Hide Background Notes
Scan the QR code below to view this release online or go to
http://www.cso.ie/en/releasesandpublications/er/csfa/estimatesofthecapitalstockoffixedassets2015/
 Hide Table 1 Net Capital Stock held at end of year by type of industry at current market prices