
| Total Cereals | Cattle | Sheep | |
| '000 hectares(ha) | |||
| '000 | '000 | ||
| June 2017 | 272.4 | 7,363.5 | 5,197.1 |
| June 2018 | 261.6 | 7,348.5 | 5,109.3 |
| % change | -4.0 | -0.2 | -1.7 |
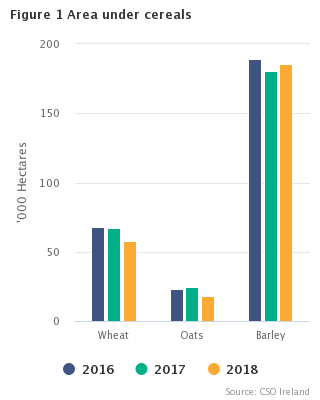
The final results for June 2018 show that the area under cereals decreased by 10,800 hectares (ha) (-4.0%) to 261,600 ha when compared to June 2017. This was mainly due to a decrease of 9,100 ha (-13.5%) in the area under wheat, a decrease of 7,200 ha (-11.0%) in the area under winter barley and a decrease of 6,700 ha (-27.3%) in the area under oats. The area under spring barley increased by 12,200 ha (+10.6%). See Table 1.
The results also show that the total number of sheep was 5,109,300, a drop of 87,800 (-1.7%) on June 2017. The number of non-breeding sheep was down 2.3% and breeding sheep down 1.1%. See Table 2.
A comparison with the June 2017 results show that:
A regional analysis of the livestock numbers shows that the largest number of cattle (1,467,200) was in the South-West region, the largest number of sheep (1,412,300) was in the West region and the largest number of pigs (446,200) was in the Border region. See Tables 4 and 5.
From the 1st January 2018 an Amendment of the EU NUTS legislation came into effect. This reflects the new regional assembly structure and other changes to the Local Government Act for Tipperary North, Tipperary South and Limerick and Waterford City and Councils. For the composition of the new Regions breakdown and further information see background notes.
| Pasture and rough grazing values for 2017 have been revised due to consistency checks with the Department of Agriculture, Food and the Marine's Basic Payment Scheme. |
| X-axis label | Cattle | Sheep |
|---|---|---|
| Border | 797.5 | 1015.9 |
| West | 938.6 | 1412.3 |
| Mid-West | 1451.5 | 236.1 |
| South-East | 1075.9 | 551.7 |
| South-West | 1467.2 | 680.2 |
| Mid-East & Dublin | 735.8 | 911.2 |
| Midland | 881.8 | 301.9 |
| X-axis label | % Change |
|---|---|
| Winter wheat | -9.7 |
| Spring wheat | -47.5 |
| Winter oats | -29.3 |
| Spring oats | -24.3 |
| Winter barley | -11 |
| Spring barley | 10.6 |
| Potatoes | -10.4 |
| Table 1 Area under Crops and Pasture | |||||
| Description | June 2016 | June 2017 | June 2018 | Change 2017 - 2018 | |
| ' 000 hectares | ' 000 hectares | % | |||
| Wheat - total | 67.9 | 67.0 | 58.0 | -9.1 | -13.5 |
| Winter wheat | 60.4 | 60.3 | 54.4 | -5.9 | -9.7 |
| Spring wheat | 7.5 | 6.8 | 3.6 | -3.2 | -47.5 |
| Oats - total | 23.2 | 24.4 | 17.8 | -6.7 | -27.3 |
| Winter oats | 13.2 | 14.4 | 10.2 | -4.2 | -29.3 |
| Spring oats | 10.0 | 10.0 | 7.6 | -2.4 | -24.3 |
| Barley - total | 189.2 | 180.2 | 185.2 | 5.0 | 2.8 |
| Winter barley | 74.6 | 65.0 | 57.9 | -7.2 | -11.0 |
| Spring barley | 114.6 | 115.2 | 127.4 | 12.2 | 10.6 |
| Other cereals | 0.8 | 0.8 | 0.6 | -0.1 | -17.8 |
| Total cereals | 281.1 | 272.4 | 261.6 | -10.8 | -4.0 |
| Beans and peas | 12.5 | 13.7 | 8.5 | -5.2 | -38.0 |
| Oilseed rape | 9.9 | 10.1 | 10.6 | 0.5 | 5.0 |
| Arable silage | 3.5 | 2.9 | 3.3 | 0.5 | 15.8 |
| Maize silage | 10.9 | 11.9 | 17.8 | 5.9 | 49.5 |
| Fodder rape and kale | 1.6 | 1.6 | 1.5 | -0.1 | -8.6 |
| Potatoes | 9.0 | 9.2 | 8.2 | -1.0 | -10.4 |
| Turnips | 1.1 | 0.8 | 0.9 | 0.1 | 8.6 |
| Beet 1 | 9.5 | 10.0 | 11.3 | 1.4 | 13.8 |
| Vegetables for sale | 3.6 | 3.6 | 3.6 | -0.1 | -1.5 |
| Fruit | 0.8 | 0.8 | 0.8 | 0.0 | -4.9 |
| Nurseries, horticulture etc. | 0.5 | 0.5 | 0.5 | 0.0 | 4.4 |
| Other crops 2 | 21.8 | 28.1 | 28.4 | 0.4 | 1.3 |
| Total crops, fruit and horticulture | 365.8 | 365.6 | 357.0 | -8.6 | -2.3 |
| Silage | 1,066.8 | 1,088.9 3 | 1,064.5 | -24.4 | -2.2 |
| Hay | 188.4 | 192.1 3 | 191.9 | -0.2 | -0.1 |
| Pasture | 2,307.8 | 2,322.7 3 | 2,378.7 | 56.1 | 2.4 |
| Crops and Pasture | 3,928.8 | 3,969.3 3 | 3,992.2 | 22.9 | 0.6 |
| Rough grazing in use | 532.4 | 520.2 3 | 524.1 | 3.9 | 0.8 |
| Area farmed | 4,461.2 | 4,489.5 | 4,516.3 | 26.8 | 0.6 |
| 1 Includes sugar beet and fodder beet. | |||||
| 2 Includes other crops not specified elsewhere in the table, miscanthus, fallow land & wild bird cover account for over 80% of this area. See Background Notes. | |||||
| 3 Revised. Pasture & Rough grazing values revised due to consistency checks with DAFM's Basic Payment Scheme. | |||||
| Table 2 Number of Livestock | |||||
| Description | June 2016 | June 2017 | June 2018 | Change 2017 - 2018 | |
| ' 000 | ' 000 | % | |||
| Total cattle | 7,221.2 | 7,363.5 | 7,348.5 | -15.0 | -0.2 |
| Dairy cows 1 | 1,397.9 | 1,432.7 | 1,480.9 | 48.2 | 3.4 |
| Other cows | 1,103.7 | 1,081.0 | 1,047.9 | -33.1 | -3.1 |
| Bulls 2 | 25.0 | 16.9 | 10.9 | -6.0 | -35.5 |
| Cattle male: 2 years and over | 391.1 | 431.7 | 442.5 | 10.8 | 2.5 |
| Cattle female: 2 years and over | 324.4 | 356.4 | 369.3 | 12.9 | 3.6 |
| Cattle male: 1-2 years | 872.7 | 902.3 | 895.0 | -7.3 | -0.8 |
| Cattle female: 1-2 years | 980.5 | 1,011.6 | 1,023.7 | 12.0 | 1.2 |
| Cattle male: under 1 year | 1,045.6 | 1,033.5 | 998.1 | -35.5 | -3.4 |
| Cattle female: under 1 year | 1,080.3 | 1,097.4 | 1,080.3 | -17.1 | -1.6 |
| Total cattle male | 2,334.5 | 2,384.5 | 2,346.5 | -38.0 | -1.6 |
| Total cattle female | 4,886.7 | 4,979.0 | 5,002.0 | 23.0 | 0.5 |
| Total sheep | 5,179.2 | 5,197.1 | 5,109.3 | -87.8 | -1.7 |
| Breeding sheep | 2,582.8 | 2,593.5 | 2,565.5 | -28.0 | -1.1 |
| Ewes: 2 years and over | 2,025.1 | 2,033.0 | 2,021.7 | -11.2 | -0.6 |
| Ewes: under 2 years | 479.9 | 482.2 | 467.8 | -14.4 | -3.0 |
| Rams | 77.8 | 78.4 | 76.0 | -2.4 | -3.0 |
| Other sheep | 2,596.4 | 2,603.6 | 2,543.9 | -59.8 | -2.3 |
| Total pigs | 1,594.3 | 1,556.9 | 1,621.9 | 65.1 | 4.2 |
| Breeding pigs | 149.9 | 144.7 | 148.7 | 4.0 | 2.7 |
| Female breeding pigs | 148.5 | 143.4 | 147.4 | 4.0 | 2.8 |
| Boars | 1.4 | 1.3 | 1.3 | -0.1 | -5.1 |
| Other pigs | 1,444.4 | 1,412.2 | 1,473.3 | 61.1 | 4.3 |
| 20kg and over | 999.1 | 1,002.1 | 1,021.4 | 19.3 | 1.9 |
| Less than 20kg | 445.3 | 410.1 | 451.9 | 41.8 | 10.2 |
| Horses and ponies 3 | 92.2 | 84.9 | 84.3 | -0.5 | -0.6 |
| Mules, jennets and asses | 9.2 | 10.8 | 9.2 | -1.6 | -14.7 |
| Goats 4 | 9.9 | 8.3 | 9.3 | 1.1 | 12.8 |
| 1 Dairy cows are those kept principally to produce milk for human consumption. | |||||
| 2 Bulls used for breeding purposes only. | |||||
| 3 Horses and Ponies are those kept on agricultural holdings only. | |||||
| 4 Source DAFM. See Background Notes. | |||||
| Table 3 Area under Crops and Pasture in each Region, June 2018 | ' 000 ha | ||||||||||||
| Region | Northern and Western | Southern | Eastern and Midland | State | |||||||||
| Border | West | Total | Mid-West | South-East | South-West | Total | Mid-East & Dublin | Midland | Total | ||||
| Wheat - total | 0.6 | 0.1 | 0.7 | 3.9 | 10.1 | 4.7 | 18.7 | 34.5 | 4.0 | 38.5 | 58.0 | ||
| Winter wheat | 0.4 | 0.1 | 0.5 | 3.5 | 9.5 | 3.9 | 16.9 | 33.3 | 3.8 | 37.1 | 54.4 | ||
| Spring wheat | 0.2 | 0.1 | 0.2 | 0.4 | 0.6 | 0.8 | 1.9 | 1.2 | 0.3 | 1.4 | 3.6 | ||
| Oats - total | 0.5 | 0.7 | 1.2 | 1.6 | 5.5 | 1.9 | 9.0 | 5.8 | 1.7 | 7.5 | 17.8 | ||
| Winter oats | 0.1 | 0.1 | 0.2 | 1.0 | 3.3 | 0.6 | 4.9 | 4.2 | 0.8 | 5.1 | 10.2 | ||
| Spring oats | 0.4 | 0.6 | 1.0 | 0.6 | 2.2 | 1.3 | 4.1 | 1.6 | 0.8 | 2.5 | 7.6 | ||
| Barley - total | 3.4 | 2.8 | 6.3 | 15.3 | 59.9 | 29.3 | 104.5 | 52.3 | 22.2 | 74.4 | 185.2 | ||
| Winter barley | 1.3 | 0.4 | 1.7 | 6.9 | 11.2 | 9.8 | 27.9 | 22.0 | 6.2 | 28.2 | 57.9 | ||
| Spring barley | 2.2 | 2.4 | 4.6 | 8.4 | 48.7 | 19.5 | 76.6 | 30.2 | 16.0 | 46.2 | 127.4 | ||
| Other cereals | 0.0 | 0.0 | 0.0 | 0.0 | 0.1 | 0.0 | 0.2 | 0.2 | 0.2 | 0.4 | 0.6 | ||
| Total cereals | 4.6 | 3.6 | 8.3 | 20.9 | 75.7 | 36.0 | 132.5 | 92.8 | 28.1 | 120.8 | 261.6 | ||
| Beans and peas | 0.0 | 0.0 | 0.0 | 0.4 | 2.9 | 0.9 | 4.2 | 3.7 | 0.6 | 4.3 | 8.5 | ||
| Oilseed rape | 0.0 | 0.0 | 0.1 | 0.7 | 2.5 | 0.4 | 3.6 | 5.8 | 1.1 | 6.9 | 10.6 | ||
| Arable silage | 0.5 | 0.2 | 0.7 | 0.2 | 0.7 | 0.8 | 1.7 | 0.4 | 0.5 | 0.9 | 3.3 | ||
| Maize silage | 0.2 | 0.1 | 0.3 | 1.4 | 5.1 | 4.7 | 11.1 | 5.3 | 1.0 | 6.3 | 17.8 | ||
| Fodder rape and kale | 0.0 | 0.2 | 0.2 | 0.1 | 0.3 | 0.2 | 0.6 | 0.3 | 0.4 | 0.6 | 1.5 | ||
| Potatoes | 0.8 | 0.0 | 0.9 | 0.2 | 1.9 | 0.7 | 2.9 | 4.3 | 0.1 | 4.5 | 8.2 | ||
| Turnips | 0.0 | 0.1 | 0.1 | 0.0 | 0.3 | 0.1 | 0.4 | 0.3 | 0.1 | 0.4 | 0.9 | ||
| Beet 1 | 0.0 | 0.3 | 0.3 | 0.7 | 3.8 | 3.0 | 7.6 | 1.7 | 1.7 | 3.4 | 11.3 | ||
| Vegetables for sale | 0.0 | 0.1 | 0.1 | 0.1 | 0.7 | 0.2 | 1.0 | 2.2 | 0.2 | 2.4 | 3.6 | ||
| Fruit | 0.0 | 0.0 | 0.0 | 0.1 | 0.3 | 0.0 | 0.4 | 0.3 | 0.0 | 0.4 | 0.8 | ||
| Nurseries, horticulture etc. | 0.0 | 0.0 | 0.0 | 0.1 | 0.2 | 0.1 | 0.4 | 0.1 | 0.0 | 0.1 | 0.5 | ||
| Other crops 2 | 3.1 | 5.1 | 8.3 | 2.6 | 5.5 | 2.9 | 11.0 | 5.2 | 4.0 | 9.2 | 28.4 | ||
| Crops, fruit and horticulture | 9.5 | 9.8 | 19.3 | 27.5 | 99.9 | 50.1 | 177.5 | 122.4 | 37.8 | 160.2 | 357.0 | ||
| Silage | 141.4 | 176.9 | 318.3 | 198.9 | 122.9 | 215.6 | 537.4 | 83.4 | 125.4 | 208.8 | 1,064.5 | ||
| Hay | 24.9 | 31.6 | 56.4 | 54.9 | 15.5 | 15.8 | 86.3 | 24.4 | 24.8 | 49.2 | 191.9 | ||
| Pasture | 372.6 | 504.4 | 877.1 | 412.5 | 229.7 | 380.8 | 1,023.0 | 242.6 | 236.0 | 478.6 | 2,378.7 | ||
| Crops and pasture | 548.3 | 722.7 | 1,271.0 | 693.9 | 468.0 | 662.4 | 1,824.2 | 472.8 | 424.0 | 896.9 | 3,992.2 | ||
| Rough grazing in use | 121.6 | 121.1 | 242.7 | 47.5 | 22.2 | 130.0 | 199.8 | 38.7 | 43.0 | 81.7 | 524.1 | ||
| Area farmed | 670.0 | 843.8 | 1,513.8 | 741.4 | 490.2 | 792.4 | 2,024.0 | 511.5 | 467.0 | 978.5 | 4,516.3 | ||
| 1 Includes sugar beet and fodder beet. | |||||||||||||
| 2 Includes other crops not specified elsewhere in the table, miscanthus, fallow land & wild bird cover account for over 80% of this area. See Background Notes. | |||||||||||||
| Table 4 Number of Cattle in each Region and County, June 2018 | ' 000 | |||||||||||
| Region and County | Total | Dairy | Other | Bulls 2 | Cattle | Cattle | Cattle | Cattle | Cattle | Cattle | Total Cattle | Total Cattle |
| Cattle | Cows 1 | Cows | Male 2+ | Female 2+ | Male 1-2 | Female 1-2 | Male <1 | Female < 1 | Male | Female | ||
| State | 7,348.5 | 1,480.9 | 1,047.9 | 10.9 | 442.5 | 369.3 | 895.0 | 1,023.7 | 998.1 | 1,080.3 | 2,346.5 | 5,002.0 |
| Northern and Western | 1,736.2 | 166.7 | 411.9 | 3.6 | 91.1 | 107.7 | 199.8 | 237.6 | 254.8 | 262.9 | 549.3 | 1,186.8 |
| Border | 797.5 | 104.4 | 173.5 | 1.5 | 32.6 | 45.9 | 91.6 | 108.3 | 117.4 | 122.3 | 243.2 | 554.4 |
| Cavan | 228.4 | 37.5 | 45.0 | 0.4 | 9.2 | 12.5 | 23.2 | 33.0 | 32.0 | 35.6 | 64.8 | 163.6 |
| Donegal | 183.0 | 20.6 | 40.2 | 0.3 | 6.1 | 9.1 | 27.0 | 22.7 | 30.3 | 26.8 | 63.7 | 119.4 |
| Leitrim | 62.3 | 2.0 | 24.0 | 0.2 | 1.7 | 3.5 | 3.3 | 7.0 | 10.0 | 10.7 | 15.2 | 47.1 |
| Monaghan | 212.3 | 36.3 | 33.2 | 0.3 | 11.0 | 13.3 | 27.3 | 31.1 | 28.6 | 31.3 | 67.2 | 145.2 |
| Sligo | 111.4 | 8.0 | 31.1 | 0.3 | 4.7 | 7.6 | 10.7 | 14.7 | 16.6 | 17.8 | 32.3 | 79.2 |
| West | 938.6 | 62.3 | 238.4 | 2.1 | 58.5 | 61.8 | 108.2 | 129.3 | 137.4 | 140.7 | 306.2 | 632.5 |
| Galway | 446.8 | 36.2 | 104.7 | 1.0 | 30.0 | 28.3 | 53.2 | 61.9 | 64.5 | 67.0 | 148.7 | 298.2 |
| Mayo | 279.3 | 18.0 | 77.7 | 0.5 | 14.4 | 17.6 | 29.1 | 36.7 | 42.1 | 43.2 | 86.1 | 193.2 |
| Roscommon | 212.5 | 8.1 | 55.9 | 0.5 | 14.2 | 15.9 | 25.9 | 30.7 | 30.7 | 30.4 | 71.4 | 141.1 |
| Southern | 3,994.7 | 1,073.7 | 401.2 | 5.0 | 225.0 | 153.2 | 470.2 | 539.2 | 529.5 | 597.7 | 1,229.6 | 2,765.0 |
| Mid-West | 1,451.5 | 325.2 | 170.7 | 2.1 | 99.8 | 62.1 | 183.2 | 192.6 | 204.6 | 211.3 | 489.7 | 961.9 |
| Clare | 289.4 | 33.1 | 72.7 | 0.7 | 16.8 | 13.5 | 31.9 | 32.4 | 43.6 | 44.7 | 93.0 | 196.4 |
| Limerick | 443.9 | 118.9 | 37.8 | 0.6 | 30.2 | 19.5 | 52.3 | 60.1 | 59.6 | 64.8 | 142.7 | 301.2 |
| Tipperary | 718.2 | 173.2 | 60.2 | 0.8 | 52.8 | 29.0 | 99.0 | 100.0 | 101.4 | 101.8 | 254.0 | 464.3 |
| South-East | 1,075.9 | 269.6 | 105.7 | 1.2 | 59.9 | 40.4 | 143.6 | 152.1 | 145.3 | 158.1 | 350.0 | 725.9 |
| Carlow | 109.7 | 16.0 | 16.4 | 0.2 | 6.3 | 6.0 | 16.2 | 16.1 | 16.7 | 15.9 | 39.4 | 70.4 |
| Kilkenny | 378.3 | 90.1 | 34.5 | 0.4 | 25.0 | 12.1 | 55.3 | 51.2 | 54.6 | 55.0 | 135.4 | 242.9 |
| Waterford | 276.0 | 85.6 | 21.3 | 0.3 | 15.0 | 9.3 | 30.5 | 38.6 | 33.7 | 41.5 | 79.6 | 196.4 |
| Wexford | 311.9 | 77.9 | 33.5 | 0.4 | 13.5 | 13.1 | 41.4 | 46.2 | 40.3 | 45.7 | 95.6 | 216.3 |
| South-West | 1,467.2 | 478.8 | 124.7 | 1.7 | 65.4 | 50.8 | 143.4 | 194.5 | 179.6 | 228.4 | 390.0 | 1,077.2 |
| Cork | 1,125.0 | 378.2 | 77.7 | 1.2 | 52.0 | 36.8 | 117.9 | 151.1 | 138.1 | 172.0 | 309.3 | 815.8 |
| Kerry | 342.2 | 100.6 | 47.1 | 0.5 | 13.3 | 14.0 | 25.4 | 43.4 | 41.4 | 56.4 | 80.7 | 261.4 |
| Eastern and Midland | 1,617.7 | 240.5 | 234.9 | 2.3 | 126.4 | 108.3 | 225.0 | 246.9 | 213.8 | 219.6 | 567.6 | 1,050.1 |
| Mid-East and Dublin | 735.8 | 125.9 | 99.0 | 1.0 | 60.6 | 52.9 | 97.1 | 111.9 | 89.3 | 98.2 | 248.0 | 487.9 |
| Dublin | 24.6 | 2.9 | 4.3 | 0.0 | 1.6 | 3.5 | 2.5 | 4.2 | 2.6 | 3.1 | 6.7 | 17.9 |
| Kildare | 148.8 | 17.8 | 20.5 | 0.2 | 16.8 | 10.4 | 24.2 | 22.2 | 18.4 | 18.3 | 59.6 | 89.2 |
| Louth | 94.6 | 17.4 | 12.3 | 0.1 | 7.6 | 8.2 | 11.0 | 14.6 | 10.7 | 12.7 | 29.4 | 65.2 |
| Meath | 334.2 | 63.5 | 39.5 | 0.4 | 28.8 | 24.2 | 44.7 | 51.9 | 38.3 | 42.8 | 112.2 | 221.9 |
| Wicklow | 133.7 | 24.2 | 22.5 | 0.3 | 5.8 | 6.6 | 14.8 | 19.0 | 19.2 | 21.4 | 40.0 | 93.7 |
| Midland | 881.8 | 114.6 | 135.8 | 1.3 | 65.8 | 55.4 | 127.9 | 135.0 | 124.6 | 121.4 | 319.6 | 562.3 |
| Laois | 271.7 | 45.0 | 34.7 | 0.3 | 20.1 | 12.4 | 44.2 | 37.8 | 40.2 | 37.0 | 104.8 | 166.9 |
| Longford | 114.8 | 10.0 | 26.4 | 0.3 | 8.5 | 7.7 | 14.3 | 16.1 | 15.5 | 16.1 | 38.5 | 76.3 |
| Offaly | 262.4 | 31.5 | 33.2 | 0.3 | 19.4 | 17.4 | 41.3 | 44.0 | 39.6 | 35.9 | 100.6 | 161.9 |
| Westmeath | 232.8 | 28.2 | 41.6 | 0.4 | 17.8 | 18.0 | 28.1 | 37.1 | 29.3 | 32.4 | 75.6 | 157.2 |
| 1 Dairy cows are those kept principally to produce milk for human consumption. | ||||||||||||
| 2 Bulls used for breeding purposes only. | ||||||||||||
| Table 5 Number of Sheep, Pigs and Other Livestock in each Region, June 2018 | ' 000 | ||||||||||||
| Region | Northern and Western | Southern | Eastern and Midland | State | |||||||||
| Border | West | Total | Mid-West | South-East | South-West | Total | Mid-East & Dublin | Midland | Total | ||||
| Total sheep | 1,015.9 | 1,412.3 | 2,428.2 | 236.1 | 551.7 | 680.2 | 1,467.9 | 911.2 | 301.9 | 1,213.2 | 5,109.3 | ||
| Breeding sheep | 531.0 | 693.8 | 1,224.8 | 119.1 | 274.0 | 361.0 | 754.1 | 437.5 | 149.0 | 586.6 | 2,565.5 | ||
| Ewes: 2 years and over | 414.3 | 546.9 | 961.2 | 94.8 | 216.4 | 289.8 | 601.0 | 337.7 | 121.9 | 459.5 | 2,021.7 | ||
| Ewes: under 2 years | 100.8 | 125.5 | 226.3 | 20.1 | 50.5 | 60.8 | 131.4 | 87.4 | 22.7 | 110.1 | 467.8 | ||
| Rams | 15.9 | 21.5 | 37.3 | 4.2 | 7.0 | 10.4 | 21.7 | 12.5 | 4.5 | 17.0 | 76.0 | ||
| Other sheep | 484.9 | 718.5 | 1,203.4 | 117.0 | 277.7 | 319.1 | 713.8 | 473.7 | 152.9 | 626.6 | 2,543.9 | ||
| Total pigs | 446.2 | 40.4 | 486.6 | 200.3 | 228.6 | 299.7 | 728.7 | 116.6 | 290.1 | 406.7 | 1,621.9 | ||
| Breeding pigs | 41.2 | 3.1 | 44.3 | 20.0 | 20.9 | 25.8 | 66.6 | 11.3 | 26.4 | 37.7 | 148.7 | ||
| Female breeding pigs | 41.1 | 3.1 | 44.2 | 19.9 | 20.3 | 25.4 | 65.7 | 11.2 | 26.3 | 37.6 | 147.4 | ||
| Boars | 0.1 | 0.0 | 0.1 | 0.1 | 0.5 | 0.3 | 1.0 | 0.0 | 0.1 | 0.1 | 1.3 | ||
| Other pigs | 404.9 | 37.3 | 442.3 | 180.3 | 207.7 | 274.0 | 662.0 | 105.3 | 263.7 | 369.0 | 1,473.3 | ||
| 20kg and over | 280.4 | 26.4 | 306.8 | 128.8 | 141.0 | 185.1 | 454.9 | 68.9 | 190.8 | 259.7 | 1,021.4 | ||
| Less than 20kg | 124.5 | 11.0 | 135.5 | 51.5 | 66.7 | 88.9 | 207.1 | 36.4 | 72.9 | 109.3 | 451.9 | ||
| Horses and ponies 1 | 6.1 | 17.4 | 23.5 | 12.8 | 12.3 | 10.2 | 35.2 | 17.8 | 7.8 | 25.6 | 84.3 | ||
| Mules, jennets and asses | 1.6 | 2.9 | 4.6 | 2.5 | 0.4 | 1.0 | 3.9 | 0.4 | 0.4 | 0.7 | 9.2 | ||
| Goats 2 | 1.2 | 1.4 | 2.6 | 1.8 | 0.8 | 1.1 | 3.6 | 1.7 | 1.4 | 3.1 | 9.3 | ||
| 1 Horses and Ponies are those kept on agricultural holdings only. | |||||||||||||
| 2 Source DAFM. See Background notes. | |||||||||||||
This release presents final estimates of land utilisation and livestock numbers in June 2018 at State and regional level. The estimates for sheep and pigs are based on returns from the 2018 June sample survey of agricultural holdings and the June 2018 Pig Survey conducted by the Central Statistics Office (CSO). The estimates for cattle and for crops are obtained from administrative data from the Department of Agriculture, Food and the Marine (DAFM).
Coverage Farms where the agricultural area used was at least one hectare (2.47 acres) are included in the June Agricultural Sample Survey. Farms with less than one hectare may also be included if they were engaged in intensive production.
Crops The results for crops are based on data obtained from the DAFM Basic Payment Scheme. Please note that wild bird cover is included under the Other crops category for the first time in the 2018 release. Other crops has been revised for 2016 and 2017 to show comparable figures. The inclusion of this crop in 2016 and 2017 has an impact on the following estimates for both of these years - Crops, fruit and horticulture, Crops and Pasture and Area Farmed.
Cattle The results for cattle are obtained from DAFM’s Animal Identification and Movement (AIM) system, formerly known as the Cattle Movement Monitoring System (CMMS). This system was introduced at the beginning of 2000 and involves electronically recording data on animal movements.
Goats The 2018 goat results are obtained from DAFM’s 2017 December Sheep and Goat Census.
Sheep The June 2018 results for sheep are based on the trends obtained by comparing the returns from the 2018 sample with the 2017 returns for the same 7,400 farms and applying these trends to the June 2017 figures.
Pigs A specialist pig survey was conducted by the CSO due to the intensive nature of this activity.
As the figures in the text and tables have been rounded to the nearest 100 units, there may be slight discrepancies between the sum (or difference) of the constituent items and the total shown. Percentage changes have been calculated on actual figures.
From the 1st January 2018 an Amendment of the EU NUTS legislation came into effect. This reflects the new regional assembly structure and the other changes under the 2014 Local Government Act. These changes included:
The composition of the new Regions breakdown is outlined below.
| Northern & Western NUTS2 Region | Southern NUTS2 Region | Eastern & Midland NUTS2 Region | |||
| Border | Cavan | Mid-West | Clare | Dublin | Dublin City |
| Donegal | Limerick City & County | Dun Laoghaire-Rathdown | |||
| Leitrim | Tipperary | Fingal | |||
| Monaghan | South Dublin | ||||
| Sligo | |||||
| West | Galway City | South-East | Carlow | Mid-East | Kildare |
| Galway County | Kilkenny | Meath | |||
| Mayo | Waterford City & County | Wicklow | |||
| Roscommon | Wexford | Louth | |||
| South-West | Cork City | Midland | Laois | ||
| Cork County | Longford | ||||
| Kerry | Offaly | ||||
| Westmeath | |||||
Results for June Crops and Livestock by region can be found on the CSO Statbank. The figures for 2016 to 2018 are available for the new NUTS regions structure. Data prior to 2016 are available using the older NUTS regions shown below.
|
Border, Midland and Western NUTS 2 Region |
Southern and Eastern NUTS 2 Region |
||
| Border | Cavan | Dublin | Dublin City |
| Donegal | Dun Laoghaire-Rathdown | ||
| Leitrim | Fingal | ||
| Louth | South Dublin | ||
| Monaghan | |||
| Sligo | Mid-East | Kildare | |
| Meath | |||
| Midland | Laois | Wicklow | |
| Longford | |||
| Offaly | Mid-West | Clare | |
| Westmeath | Limerick City | ||
| Limerick | |||
| West | Galway City | North Tipperary | |
| Galway | |||
| Mayo | South-East | Carlow | |
| Roscommon | Kilkenny | ||
| South Tipperary | |||
| Waterford City | |||
| Waterford | |||
| Wexford | |||
| South-West | Cork City | ||
| Cork | |||
| Kerry | |||
 Hide Background Notes
Scan the QR code below to view this release online or go to
http://www.cso.ie/en/releasesandpublications/er/clsjf/cropsandlivestocksurveyjunefinal2018/
 Show Table 1 Area under Crops and Pasture
 Hide Table 1 Area under Crops and Pasture