
| Disposable Income Per Person, 2010 and 2011 | ||||||
| € | € | |||||
| Region | 2010 | 2011 | ||||
| Border, Midlands and Western | 18,240 | 17,390 | ||||
| Border | 17,882 | 16,984 | ||||
| Midland | 17,801 | 17,428 | ||||
| West | 18,937 | 17,836 | ||||
| Southern and Eastern | 19,903 | 19,673 | ||||
| Dublin | 20,697 | 21,329 | ||||
| Mid East | 19,741 | 19,094 | ||||
| Mid West | 19,993 | 18,485 | ||||
| South East | 18,705 | 17,954 | ||||
| South West | 19,370 | 18,929 | ||||
| State | 19,453 | 19,055 | ||||
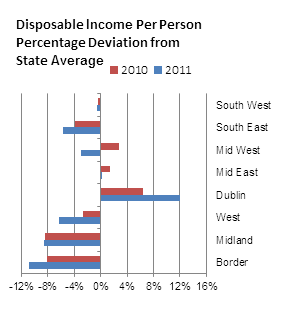
Of the eight regional authority areas, the Dublin region had the highest average disposable income per person in 2011. At €21,329 it was 11.9% higher than the State figure of €19,055. Of the remaining seven regions, only the Mid East (0.2%), had an average disposable income per person higher than the State total. The Border region with €16,984 (-10.9%) and Midland region with €17,428 (-8.5%) fared worst among the eight regions when compared with the State total.
The gap between the maximum and minimum value of disposable income per person per region increased from €2,896 in 2010 to €4,345 in 2011 with Dublin incomes increasing by €632 while those of the lowest region (Midland in 2010 becoming Border in 2011) decreasing by €817.
The premium of 11.9% which Dublin had compared with the State total in 2011, is greater than the 6.4% premium in 2010 (see graph). Conversely the lowest region (i.e. the Border region) had a decrease of 2.8 percentage points in terms of the State average (-8.1% in 2010 and -10.9% in 2011). Dublin was the only region with higher per capita disposable income than the State average during the entire 2002-2011 period, while the Midland and Border regions have occupied the lowest ends of the disposable income distribution range for the last four years.
Viewed in a slightly longer term perspective (i.e. from 2002 onwards) the divergence between the regional authority areas has narrowed over the years (see Table 4).
Greater uncertainty at county level
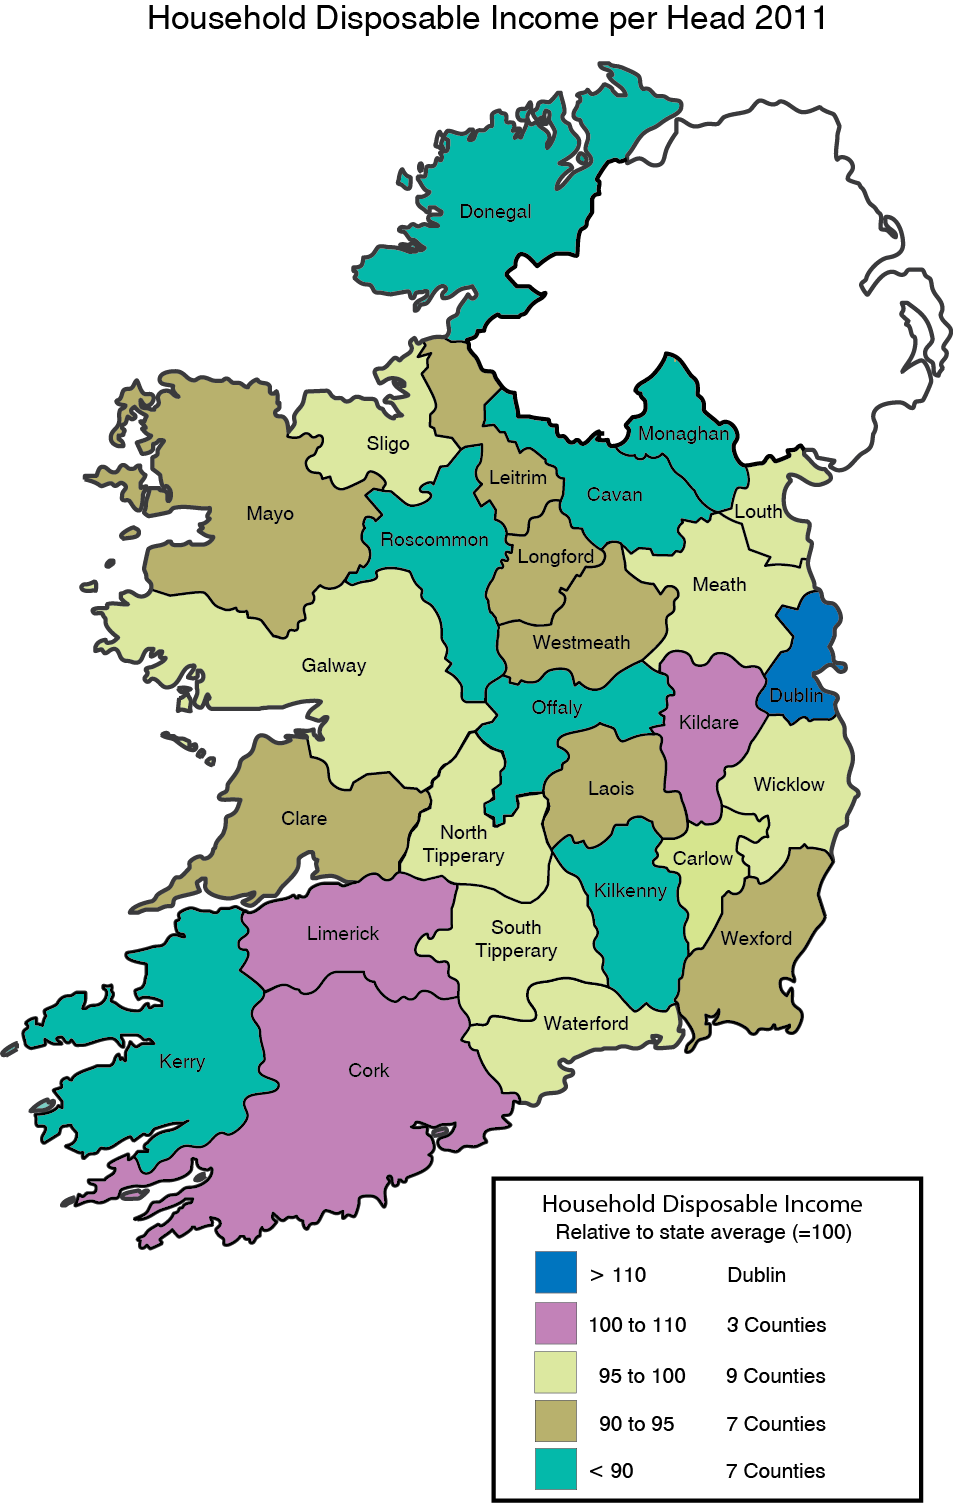
While the county figures involve uncertainty they do provide useful indication of the degree of variability at county level. Dublin, Kildare, Limerick and Cork are the only counties where per capita disposable income exceeds the state average in 2011 similar to 2010. In the original 2010 release North Tipperary was not included in this group, but after revision in this release it is now higher than the 2010 State average).
At the other end of the spectrum, the counties of Donegal and Kerry have had per capita disposable incomes below 85 and 90 per cent respectively of the State level during the entire period of 2002 to 2011. However, in line with the results at regional authority level the degree of variability between the county income figures has been steadily declining since 2002.
Primary income plays a major role
Adding social transfers to primary income and subtracting off income taxes and social insurance contributions, results in disposable income. In the counties of Dublin, Kildare, Meath and Wicklow, primary income exceeded disposable income in 2010 and 2011 (see Tables 1 & 2). These are the counties with the highest employment rates as indicated in the results of the 2011 Census.
Tables 1 to 8 show all the county income information and tables 9 to 18 show regional GVA information.
| Table 1 Estimates of Primary, Total & Disposable Household Income by Region & County in 2011 | ||||||||||
| Compensation of Employees | Income of Self Employed | Rent 1 of Dwellings | Net Interest and Dividends | Primary Income | Social Transfers | Total 2 Household Income | Taxes | Disposable Household Income | Disposable Income per Person | |
| €m | €m | €m | €m | €m | €m | €m | €m | €m | € | |
| Border, Midland & Western | 15,253 | 2,338 | 1,323 | 287 | 19,201 | 7,167 | 26,112 | 4,503 | 21,610 | 17,390 |
| Border | 5,997 | 867 | 508 | 112 | 7,484 | 3,080 | 10,465 | 1,720 | 8,745 | 16,984 |
| Cavan | 884 | 142 | 66 | 17 | 1,109 | 380 | 1,474 | 249 | 1,225 | 16,741 |
| Donegal | 1,542 | 273 | 143 | 30 | 1,988 | 1,032 | 2,993 | 431 | 2,562 | 15,897 |
| Leitrim | 371 | 73 | 28 | 7 | 479 | 197 | 670 | 110 | 560 | 17,604 |
| Louth | 1,647 | 163 | 144 | 30 | 1,983 | 755 | 2,712 | 488 | 2,224 | 18,095 |
| Monaghan | 700 | 88 | 57 | 13 | 858 | 334 | 1,181 | 197 | 984 | 16,261 |
| Sligo | 852 | 128 | 70 | 16 | 1,067 | 383 | 1,436 | 245 | 1,191 | 18,211 |
| Midland | 3,603 | 487 | 281 | 66 | 4,437 | 1,587 | 5,965 | 1,043 | 4,922 | 17,428 |
| Laois | 1,148 | 111 | 80 | 20 | 1,359 | 402 | 1,744 | 317 | 1,426 | 17,705 |
| Longford | 419 | 75 | 32 | 8 | 534 | 254 | 781 | 112 | 669 | 17,158 |
| Offaly | 903 | 137 | 76 | 17 | 1,132 | 437 | 1,554 | 266 | 1,288 | 16,792 |
| Westmeath | 1,133 | 164 | 92 | 21 | 1,411 | 494 | 1,886 | 348 | 1,539 | 17,856 |
| West | 5,654 | 984 | 534 | 109 | 7,280 | 2,499 | 9,683 | 1,739 | 7,943 | 17,836 |
| Galway | 3,407 | 557 | 330 | 65 | 4,359 | 1,367 | 5,668 | 1,075 | 4,593 | 18,324 |
| Mayo | 1,524 | 287 | 140 | 30 | 1,980 | 791 | 2,745 | 444 | 2,300 | 17,608 |
| Roscommon | 723 | 140 | 64 | 14 | 941 | 341 | 1,270 | 220 | 1,050 | 16,392 |
| Southern & Eastern | 53,528 | 7,224 | 4,943 | 996 | 66,691 | 18,111 | 83,913 | 18,096 | 65,818 | 19,673 |
| Dublin | 24,206 | 2,421 | 2,375 | 439 | 29,442 | 6,761 | 35,810 | 8,658 | 27,153 | 21,329 |
| Mid East | 8,835 | 1,012 | 730 | 160 | 10,737 | 2,471 | 13,065 | 2,925 | 10,141 | 19,094 |
| Kildare | 3,760 | 357 | 294 | 67 | 4,479 | 985 | 5,404 | 1,244 | 4,160 | 19,779 |
| Meath | 2,978 | 360 | 232 | 54 | 3,624 | 786 | 4,361 | 943 | 3,418 | 18,563 |
| Wicklow | 2,097 | 296 | 203 | 39 | 2,635 | 701 | 3,301 | 738 | 2,563 | 18,754 |
| Mid West | 5,060 | 866 | 435 | 96 | 6,458 | 2,261 | 8,633 | 1,622 | 7,012 | 18,485 |
| Clare | 1,538 | 260 | 128 | 29 | 1,955 | 622 | 2,551 | 505 | 2,045 | 17,453 |
| Limerick | 2,690 | 408 | 233 | 51 | 3,382 | 1,218 | 4,555 | 863 | 3,692 | 19,247 |
| North Tipperary | 832 | 198 | 74 | 17 | 1,121 | 422 | 1,528 | 253 | 1,275 | 18,124 |
| South East | 6,007 | 1,171 | 551 | 117 | 7,847 | 3,028 | 10,770 | 1,836 | 8,934 | 17,954 |
| Carlow | 663 | 104 | 62 | 13 | 842 | 362 | 1,193 | 187 | 1,006 | 18,421 |
| Kilkenny | 1,132 | 236 | 108 | 22 | 1,499 | 492 | 1,970 | 348 | 1,622 | 17,002 |
| South Tipperary | 1,140 | 232 | 95 | 22 | 1,490 | 538 | 2,008 | 344 | 1,664 | 18,817 |
| Waterford | 1,477 | 250 | 126 | 28 | 1,882 | 709 | 2,566 | 471 | 2,095 | 18,407 |
| Wexford | 1,594 | 349 | 159 | 32 | 2,135 | 926 | 3,033 | 486 | 2,547 | 17,525 |
| South West | 9,419 | 1,753 | 852 | 182 | 12,206 | 3,590 | 15,634 | 3,055 | 12,579 | 18,929 |
| Cork | 7,859 | 1,321 | 698 | 150 | 10,028 | 2,774 | 12,668 | 2,565 | 10,103 | 19,465 |
| Kerry | 1,560 | 431 | 154 | 33 | 2,178 | 817 | 2,966 | 490 | 2,476 | 17,016 |
| State | 68,780 | 9,562 | 6,266 | 1,283 | 85,891 | 25,279 | 110,026 | 22,598 | 87,428 | 19,055 |
| 1 Includes imputed rent of owner occupied dwellings. | ||||||||||
| 2 Total Household Income does not equal the sum of Primary Income & Social Transfers due to the effect of the Statistical Discrepancy (-€1,144m in 2011 at State level). | ||||||||||
| Table 2 Estimates of Primary, Total & Disposable Household Income by Region & County in 2010 | ||||||||||
| Compensation of Employees | Income of Self Employed | Rent 1 of Dwellings | Net Interest and Dividends | Primary Income | Social Transfers | Total 2 Household Income | Taxes | Disposable Household Income | Disposable Income per Person | |
| €m | €m | €m | €m | €m | €m | €m | €m | €m | € | |
| Border, Midland & Western | 16,269 | 2,411 | 1,165 | 467 | 20,313 | 7,001 | 26,964 | 4,485 | 22,479 | 18,240 |
| Border | 6,460 | 916 | 450 | 184 | 8,010 | 3,009 | 10,881 | 1,714 | 9,166 | 17,882 |
| Cavan | 906 | 145 | 60 | 26 | 1,138 | 375 | 1,493 | 242 | 1,251 | 17,864 |
| Donegal | 1,646 | 298 | 128 | 49 | 2,121 | 1,006 | 3,090 | 437 | 2,654 | 16,465 |
| Leitrim | 400 | 72 | 27 | 12 | 511 | 191 | 693 | 108 | 585 | 18,474 |
| Louth | 1,806 | 176 | 122 | 50 | 2,153 | 732 | 2,848 | 467 | 2,381 | 19,554 |
| Monaghan | 743 | 93 | 50 | 21 | 907 | 332 | 1,223 | 195 | 1,029 | 16,789 |
| Sligo | 958 | 131 | 64 | 27 | 1,180 | 373 | 1,533 | 267 | 1,266 | 18,995 |
| Midland | 3,745 | 470 | 247 | 105 | 4,567 | 1,537 | 6,025 | 1,030 | 4,995 | 17,801 |
| Laois | 1,088 | 103 | 69 | 30 | 1,289 | 380 | 1,647 | 289 | 1,358 | 18,161 |
| Longford | 455 | 75 | 31 | 13 | 574 | 246 | 810 | 128 | 682 | 17,787 |
| Offaly | 959 | 133 | 66 | 27 | 1,186 | 425 | 1,591 | 262 | 1,328 | 16,812 |
| Westmeath | 1,243 | 159 | 80 | 35 | 1,517 | 486 | 1,977 | 350 | 1,627 | 18,386 |
| West | 6,065 | 1,025 | 468 | 178 | 7,737 | 2,455 | 10,058 | 1,740 | 8,318 | 18,937 |
| Galway | 3,592 | 581 | 289 | 105 | 4,567 | 1,348 | 5,835 | 1,055 | 4,780 | 19,460 |
| Mayo | 1,661 | 306 | 122 | 49 | 2,138 | 777 | 2,879 | 461 | 2,417 | 18,411 |
| Roscommon | 812 | 138 | 57 | 24 | 1,032 | 330 | 1,344 | 224 | 1,121 | 17,987 |
| Southern & Eastern | 53,298 | 7,333 | 4,171 | 1,526 | 66,329 | 17,638 | 82,826 | 16,605 | 66,221 | 19,903 |
| Dublin | 22,129 | 2,620 | 1,968 | 629 | 27,346 | 6,549 | 33,424 | 7,343 | 26,081 | 20,697 |
| Mid East | 9,159 | 1,068 | 613 | 255 | 11,096 | 2,369 | 13,274 | 2,821 | 10,453 | 19,741 |
| Kildare | 3,776 | 389 | 249 | 104 | 4,519 | 938 | 5,379 | 1,158 | 4,221 | 20,335 |
| Meath | 3,116 | 368 | 194 | 87 | 3,764 | 757 | 4,456 | 939 | 3,518 | 19,394 |
| Wicklow | 2,267 | 312 | 169 | 65 | 2,813 | 674 | 3,439 | 724 | 2,714 | 19,311 |
| Mid West | 5,727 | 875 | 383 | 165 | 7,150 | 2,211 | 9,238 | 1,678 | 7,559 | 19,993 |
| Clare | 1,759 | 270 | 113 | 50 | 2,191 | 611 | 2,764 | 518 | 2,246 | 19,331 |
| Limerick | 3,023 | 417 | 199 | 86 | 3,724 | 1,194 | 4,854 | 892 | 3,962 | 20,555 |
| North Tipperary | 945 | 188 | 72 | 28 | 1,234 | 406 | 1,619 | 268 | 1,351 | 19,540 |
| South East | 6,552 | 1,146 | 476 | 193 | 8,366 | 2,954 | 11,176 | 1,858 | 9,318 | 18,705 |
| Carlow | 680 | 102 | 55 | 20 | 858 | 347 | 1,189 | 184 | 1,005 | 18,467 |
| Kilkenny | 1,242 | 222 | 91 | 37 | 1,592 | 485 | 2,050 | 359 | 1,691 | 17,865 |
| South Tipperary | 1,257 | 221 | 80 | 37 | 1,595 | 530 | 2,098 | 352 | 1,746 | 19,407 |
| Waterford | 1,607 | 251 | 111 | 46 | 2,015 | 708 | 2,689 | 468 | 2,221 | 19,032 |
| Wexford | 1,765 | 349 | 138 | 53 | 2,306 | 884 | 3,150 | 495 | 2,655 | 18,642 |
| South West | 9,732 | 1,624 | 731 | 285 | 12,371 | 3,556 | 15,714 | 2,905 | 12,810 | 19,370 |
| Cork | 8,042 | 1,199 | 593 | 232 | 10,066 | 2,747 | 12,640 | 2,409 | 10,231 | 19,965 |
| Kerry | 1,690 | 425 | 138 | 53 | 2,305 | 809 | 3,075 | 496 | 2,579 | 17,321 |
| State | 69,567 | 9,744 | 5,337 | 1,993 | 86,642 | 24,639 | 109,790 | 21,090 | 88,700 | 19,453 |
| 1 Includes imputed rent of owner occupied dwellings. | ||||||||||
| 2 Total Household Income does not equal the sum of Primary Income & Social Transfers due to the effect of the Statistical Discrepancy (-€1,490m in 2010 at State level). | ||||||||||
| Table 3 Estimates of Disposable Income Per Person by Region and County, 2002 to 20111 | ||||||||||
| Disposable Income per Person (€) | ||||||||||
| 2002 | 2003 | 2004 | 2005 | 2006 | 2007 | 2008 | 2009 | 2010 | 2011 | |
| Border, Midland and Western | 14,564 | 15,780 | 16,771 | 17,886 | 18,301 | 19,122 | 20,599 | 19,324 | 18,240 | 17,390 |
| Border | 14,221 | 15,289 | 16,365 | 17,532 | 17,921 | 18,918 | 20,206 | 18,982 | 17,882 | 16,984 |
| Cavan | 14,265 | 15,225 | 16,475 | 17,962 | 18,342 | 19,717 | 20,520 | 19,084 | 17,864 | 16,741 |
| Donegal | 12,442 | 13,308 | 14,015 | 14,852 | 15,570 | 16,465 | 18,016 | 17,255 | 16,465 | 15,897 |
| Leitrim | 14,147 | 15,272 | 16,856 | 18,103 | 18,630 | 19,560 | 20,949 | 19,648 | 18,474 | 17,604 |
| Louth | 16,351 | 17,423 | 18,435 | 19,775 | 19,888 | 20,905 | 22,362 | 20,958 | 19,554 | 18,095 |
| Monaghan | 14,198 | 15,359 | 17,058 | 18,430 | 18,361 | 19,138 | 19,928 | 17,897 | 16,789 | 16,261 |
| Sligo | 14,712 | 16,233 | 17,316 | 18,389 | 18,831 | 19,870 | 21,136 | 20,124 | 18,995 | 18,211 |
| Midland | 15,055 | 16,566 | 17,435 | 18,464 | 18,810 | 19,270 | 20,408 | 18,885 | 17,801 | 17,428 |
| Laois | 14,892 | 16,385 | 17,838 | 18,532 | 19,183 | 19,890 | 20,949 | 19,365 | 18,161 | 17,705 |
| Longford | 15,068 | 16,357 | 16,864 | 18,280 | 18,597 | 18,951 | 20,376 | 18,792 | 17,787 | 17,158 |
| Offaly | 14,633 | 16,137 | 17,201 | 18,376 | 18,934 | 19,054 | 19,770 | 18,052 | 16,812 | 16,792 |
| Westmeath | 15,557 | 17,187 | 17,557 | 18,564 | 18,478 | 19,077 | 20,534 | 19,263 | 18,386 | 17,856 |
| West | 14,664 | 15,870 | 16,837 | 17,942 | 18,422 | 19,263 | 21,172 | 19,997 | 18,937 | 17,836 |
| Galway | 14,829 | 16,084 | 16,908 | 18,004 | 18,690 | 19,649 | 21,897 | 20,543 | 19,460 | 18,324 |
| Mayo | 14,292 | 15,516 | 16,726 | 17,667 | 17,761 | 18,552 | 20,145 | 19,360 | 18,411 | 17,608 |
| Roscommon | 14,833 | 15,796 | 16,797 | 18,284 | 18,755 | 19,243 | 20,481 | 19,189 | 17,987 | 16,392 |
| Southern and Eastern | 17,120 | 18,262 | 19,121 | 20,342 | 21,068 | 22,052 | 23,349 | 21,623 | 19,903 | 19,673 |
| Dublin | 19,187 | 20,447 | 21,163 | 22,308 | 22,940 | 23,898 | 25,357 | 23,503 | 20,697 | 21,329 |
| Mid East | 17,316 | 18,455 | 19,701 | 20,867 | 21,932 | 22,539 | 23,306 | 21,338 | 19,741 | 19,094 |
| Kildare | 18,006 | 19,120 | 20,424 | 21,602 | 22,750 | 23,166 | 24,180 | 22,241 | 20,335 | 19,779 |
| Meath | 16,485 | 17,566 | 18,916 | 20,374 | 21,683 | 22,396 | 23,020 | 20,773 | 19,394 | 18,563 |
| Wicklow | 17,301 | 18,564 | 19,614 | 20,409 | 21,045 | 21,796 | 22,383 | 20,732 | 19,311 | 18,754 |
| Mid West | 15,545 | 16,630 | 17,265 | 18,791 | 19,306 | 20,295 | 21,721 | 20,205 | 19,993 | 18,485 |
| Clare | 15,458 | 16,345 | 17,198 | 18,518 | 18,931 | 20,215 | 21,434 | 19,617 | 19,331 | 17,453 |
| Limerick | 15,731 | 16,961 | 17,384 | 18,855 | 19,434 | 20,385 | 21,972 | 20,603 | 20,555 | 19,247 |
| North Tipperary | 15,162 | 16,167 | 17,043 | 19,070 | 19,581 | 20,176 | 21,504 | 20,081 | 19,540 | 18,124 |
| South East | 15,011 | 16,057 | 16,938 | 18,053 | 19,077 | 20,578 | 21,734 | 20,006 | 18,705 | 17,954 |
| Carlow | 13,919 | 14,858 | 15,422 | 16,954 | 17,883 | 19,291 | 21,098 | 19,656 | 18,467 | 18,421 |
| Kilkenny | 14,470 | 15,558 | 16,170 | 17,351 | 18,825 | 20,155 | 21,402 | 19,495 | 17,865 | 17,002 |
| South Tipperary | 15,233 | 16,439 | 17,444 | 18,092 | 19,587 | 21,159 | 21,955 | 20,757 | 19,407 | 18,817 |
| Waterford | 16,225 | 17,201 | 18,301 | 19,339 | 19,523 | 20,964 | 22,062 | 20,212 | 19,032 | 18,407 |
| Wexford | 14,606 | 15,632 | 16,565 | 17,851 | 19,013 | 20,668 | 21,789 | 19,837 | 18,642 | 17,525 |
| South West | 15,442 | 16,475 | 17,452 | 18,790 | 19,331 | 20,237 | 21,682 | 20,292 | 19,370 | 18,929 |
| Cork | 15,955 | 16,983 | 17,974 | 19,366 | 19,869 | 20,805 | 22,324 | 20,875 | 19,965 | 19,465 |
| Kerry | 13,706 | 14,753 | 15,673 | 16,815 | 17,481 | 18,284 | 19,472 | 18,287 | 17,321 | 17,016 |
| State | 16,443 | 17,601 | 18,494 | 19,686 | 20,328 | 21,269 | 22,611 | 21,004 | 19,453 | 19,055 |
| 1 Estimates are provided for Regional Authority areas and counties. The county estimates should be interpreted with caution because the underlying data are not always sufficiently robust. They should be regarded as indicative of relative levels rather than as accurate absolute figures. | ||||||||||
| Table 4 Indices of Disposable Income Per Person by Region and County, 2002 to 20111 | ||||||||||
| Indices of Disposable Income (State = 100) | ||||||||||
| 2002 | 2003 | 2004 | 2005 | 2006 | 2007 | 2008 | 2009 | 2010 | 2011 | |
| Border, Midland and Western | 88.6 | 89.7 | 90.7 | 90.9 | 90.0 | 89.9 | 91.1 | 92.0 | 93.8 | 91.3 |
| Border | 86.5 | 86.9 | 88.5 | 89.1 | 88.2 | 88.9 | 89.4 | 90.4 | 91.9 | 89.1 |
| Cavan | 86.8 | 86.5 | 89.1 | 91.2 | 90.2 | 92.7 | 90.8 | 90.9 | 91.8 | 87.9 |
| Donegal | 75.7 | 75.6 | 75.8 | 75.4 | 76.6 | 77.4 | 79.7 | 82.1 | 84.6 | 83.4 |
| Leitrim | 86.0 | 86.8 | 91.1 | 92.0 | 91.6 | 92.0 | 92.6 | 93.5 | 95.0 | 92.4 |
| Louth | 99.4 | 99.0 | 99.7 | 100.5 | 97.8 | 98.3 | 98.9 | 99.8 | 100.5 | 95.0 |
| Monaghan | 86.3 | 87.3 | 92.2 | 93.6 | 90.3 | 90.0 | 88.1 | 85.2 | 86.3 | 85.3 |
| Sligo | 89.5 | 92.2 | 93.6 | 93.4 | 92.6 | 93.4 | 93.5 | 95.8 | 97.6 | 95.6 |
| Midland | 91.6 | 94.1 | 94.3 | 93.8 | 92.5 | 90.6 | 90.3 | 89.9 | 91.5 | 91.5 |
| Laois | 90.6 | 93.1 | 96.5 | 94.1 | 94.4 | 93.5 | 92.6 | 92.2 | 93.4 | 92.9 |
| Longford | 91.6 | 92.9 | 91.2 | 92.9 | 91.5 | 89.1 | 90.1 | 89.5 | 91.4 | 90.0 |
| Offaly | 89.0 | 91.7 | 93.0 | 93.3 | 93.1 | 89.6 | 87.4 | 85.9 | 86.4 | 88.1 |
| Westmeath | 94.6 | 97.6 | 94.9 | 94.3 | 90.9 | 89.7 | 90.8 | 91.7 | 94.5 | 93.7 |
| West | 89.2 | 90.2 | 91.0 | 91.1 | 90.6 | 90.6 | 93.6 | 95.2 | 97.3 | 93.6 |
| Galway | 90.2 | 91.4 | 91.4 | 91.5 | 91.9 | 92.4 | 96.8 | 97.8 | 100.0 | 96.2 |
| Mayo | 86.9 | 88.2 | 90.4 | 89.7 | 87.4 | 87.2 | 89.1 | 92.2 | 94.6 | 92.4 |
| Roscommon | 90.2 | 89.7 | 90.8 | 92.9 | 92.3 | 90.5 | 90.6 | 91.4 | 92.5 | 86.0 |
| Southern and Eastern | 104.1 | 103.8 | 103.4 | 103.3 | 103.6 | 103.7 | 103.3 | 102.9 | 102.3 | 103.2 |
| Dublin | 116.7 | 116.2 | 114.4 | 113.3 | 112.9 | 112.4 | 112.1 | 111.9 | 106.4 | 111.9 |
| Mid East | 105.3 | 104.9 | 106.5 | 106.0 | 107.9 | 106.0 | 103.1 | 101.6 | 101.5 | 100.2 |
| Kildare | 109.5 | 108.6 | 110.4 | 109.7 | 111.9 | 108.9 | 106.9 | 105.9 | 104.5 | 103.8 |
| Meath | 100.3 | 99.8 | 102.3 | 103.5 | 106.7 | 105.3 | 101.8 | 98.9 | 99.7 | 97.4 |
| Wicklow | 105.2 | 105.5 | 106.1 | 103.7 | 103.5 | 102.5 | 99.0 | 98.7 | 99.3 | 98.4 |
| Mid West | 94.5 | 94.5 | 93.4 | 95.5 | 95.0 | 95.4 | 96.1 | 96.2 | 102.8 | 97.0 |
| Clare | 94.0 | 92.9 | 93.0 | 94.1 | 93.1 | 95.0 | 94.8 | 93.4 | 99.4 | 91.6 |
| Limerick | 95.7 | 96.4 | 94.0 | 95.8 | 95.6 | 95.8 | 97.2 | 98.1 | 105.7 | 101.0 |
| North Tipperary | 92.2 | 91.9 | 92.2 | 96.9 | 96.3 | 94.9 | 95.1 | 95.6 | 100.4 | 95.1 |
| South East | 91.3 | 91.2 | 91.6 | 91.7 | 93.8 | 96.8 | 96.1 | 95.2 | 96.2 | 94.2 |
| Carlow | 84.7 | 84.4 | 83.4 | 86.1 | 88.0 | 90.7 | 93.3 | 93.6 | 94.9 | 96.7 |
| Kilkenny | 88.0 | 88.4 | 87.4 | 88.1 | 92.6 | 94.8 | 94.6 | 92.8 | 91.8 | 89.2 |
| South Tipperary | 92.6 | 93.4 | 94.3 | 91.9 | 96.4 | 99.5 | 97.1 | 98.8 | 99.8 | 98.8 |
| Waterford | 98.7 | 97.7 | 99.0 | 98.2 | 96.0 | 98.6 | 97.6 | 96.2 | 97.8 | 96.6 |
| Wexford | 88.8 | 88.8 | 89.6 | 90.7 | 93.5 | 97.2 | 96.4 | 94.4 | 95.8 | 92.0 |
| South West | 93.9 | 93.6 | 94.4 | 95.4 | 95.1 | 95.1 | 95.9 | 96.6 | 99.6 | 99.3 |
| Cork | 97.0 | 96.5 | 97.2 | 98.4 | 97.7 | 97.8 | 98.7 | 99.4 | 102.6 | 102.2 |
| Kerry | 83.4 | 83.8 | 84.7 | 85.4 | 86.0 | 86.0 | 86.1 | 87.1 | 89.0 | 89.3 |
| State | 100 | 100 | 100 | 100 | 100 | 100 | 100 | 100 | 100 | 100 |
| 1 Estimates are provided for Regional Authority areas and counties. The county estimates should be interpreted with caution because the underlying data | ||||||||||
| are not always sufficiently robust. They should be regarded as indicative of relative levels rather than as accurate absolute figures. | ||||||||||
| Table 5 Estimates of Total Income Per Person by Region and County, 2002 to 20111 | ||||||||||
| Total Income per Person ( € ) | ||||||||||
| 2002 | 2003 | 2004 | 2005 | 2006 | 2007 | 2008 | 2009 | 2010 | 2011 | |
| Border, Midland and Western | 17,690 | 19,136 | 20,566 | 21,791 | 22,421 | 23,455 | 24,572 | 23,036 | 21,878 | 21,013 |
| Border | 17,319 | 18,540 | 19,944 | 21,209 | 21,843 | 23,011 | 23,895 | 22,424 | 21,227 | 20,324 |
| Cavan | 17,177 | 18,272 | 19,870 | 21,493 | 22,051 | 23,802 | 24,428 | 22,721 | 21,315 | 20,144 |
| Donegal | 14,837 | 15,838 | 17,042 | 17,870 | 18,954 | 19,855 | 20,923 | 20,026 | 19,175 | 18,574 |
| Leitrim | 16,851 | 18,200 | 20,053 | 21,481 | 22,208 | 23,153 | 24,688 | 23,112 | 21,876 | 21,059 |
| Louth | 20,622 | 21,737 | 22,585 | 24,054 | 24,316 | 25,621 | 26,659 | 24,925 | 23,386 | 22,063 |
| Monaghan | 16,990 | 18,392 | 20,475 | 22,113 | 22,223 | 23,224 | 23,635 | 21,160 | 19,964 | 19,520 |
| Sligo | 18,051 | 19,862 | 21,703 | 22,848 | 23,570 | 24,778 | 25,337 | 24,174 | 23,003 | 21,955 |
| Midland | 18,364 | 20,168 | 21,255 | 22,460 | 23,007 | 23,607 | 24,523 | 22,633 | 21,472 | 21,121 |
| Laois | 18,069 | 19,830 | 21,371 | 22,277 | 23,060 | 24,028 | 25,300 | 23,345 | 22,032 | 21,644 |
| Longford | 17,997 | 19,522 | 20,644 | 22,194 | 22,724 | 23,265 | 24,383 | 22,311 | 21,134 | 20,033 |
| Offaly | 17,606 | 19,391 | 20,627 | 22,055 | 22,845 | 22,975 | 23,619 | 21,508 | 20,131 | 20,263 |
| Westmeath | 19,435 | 21,416 | 21,982 | 23,091 | 23,231 | 23,964 | 24,735 | 23,175 | 22,343 | 21,889 |
| West | 17,712 | 19,198 | 20,862 | 22,049 | 22,718 | 23,869 | 25,384 | 24,001 | 22,899 | 21,742 |
| Galway | 18,146 | 19,744 | 21,510 | 22,564 | 23,480 | 24,832 | 26,443 | 24,868 | 23,757 | 22,614 |
| Mayo | 17,084 | 18,538 | 20,092 | 21,240 | 21,453 | 22,479 | 23,872 | 22,922 | 21,923 | 21,010 |
| Roscommon | 17,395 | 18,501 | 19,979 | 21,745 | 22,381 | 22,999 | 24,395 | 22,857 | 21,575 | 19,822 |
| Southern and Eastern | 21,233 | 22,454 | 23,838 | 25,377 | 26,457 | 27,781 | 29,018 | 26,858 | 24,894 | 25,082 |
| Dublin | 24,079 | 25,396 | 26,717 | 28,331 | 29,353 | 30,763 | 32,274 | 29,912 | 26,524 | 28,129 |
| Mid East | 21,468 | 22,625 | 24,386 | 25,901 | 27,389 | 28,238 | 29,339 | 26,812 | 25,069 | 24,601 |
| Kildare | 22,697 | 23,739 | 25,589 | 27,092 | 28,686 | 29,332 | 30,555 | 28,068 | 25,914 | 25,693 |
| Meath | 20,246 | 21,414 | 23,198 | 25,030 | 26,726 | 27,720 | 28,926 | 26,033 | 24,569 | 23,685 |
| Wicklow | 21,140 | 22,470 | 24,096 | 25,254 | 26,329 | 27,292 | 28,076 | 25,962 | 24,465 | 24,156 |
| Mid West | 19,069 | 20,275 | 21,451 | 23,159 | 23,958 | 25,203 | 26,260 | 24,386 | 24,432 | 22,760 |
| Clare | 18,792 | 19,679 | 20,825 | 22,455 | 23,053 | 24,667 | 26,071 | 23,819 | 23,790 | 21,763 |
| Limerick | 19,528 | 20,951 | 22,129 | 23,665 | 24,613 | 25,806 | 26,557 | 24,874 | 25,183 | 23,749 |
| North Tipperary | 18,216 | 19,354 | 20,591 | 22,920 | 23,651 | 24,426 | 25,749 | 23,977 | 23,414 | 21,725 |
| South East | 18,219 | 19,397 | 20,689 | 21,925 | 23,274 | 25,087 | 26,024 | 23,872 | 22,434 | 21,644 |
| Carlow | 17,223 | 18,261 | 19,705 | 21,131 | 22,432 | 24,146 | 24,980 | 23,223 | 21,855 | 21,839 |
| Kilkenny | 17,243 | 18,486 | 19,563 | 20,995 | 22,853 | 24,514 | 25,891 | 23,525 | 21,656 | 20,647 |
| South Tipperary | 18,329 | 19,703 | 21,039 | 21,878 | 23,751 | 25,649 | 26,415 | 24,913 | 23,317 | 22,710 |
| Waterford | 20,104 | 21,146 | 22,732 | 23,794 | 24,251 | 25,939 | 26,485 | 24,194 | 23,039 | 22,548 |
| Wexford | 17,568 | 18,758 | 19,878 | 21,332 | 22,774 | 24,773 | 25,887 | 23,431 | 22,120 | 20,870 |
| South West | 19,029 | 20,167 | 21,604 | 23,184 | 24,023 | 25,185 | 26,358 | 24,727 | 23,763 | 23,526 |
| Cork | 19,796 | 20,913 | 22,411 | 24,044 | 24,859 | 26,085 | 27,316 | 25,584 | 24,667 | 24,408 |
| Kerry | 16,437 | 17,636 | 18,852 | 20,238 | 21,145 | 22,087 | 23,063 | 21,780 | 20,652 | 20,382 |
| State | 20,294 | 21,571 | 22,964 | 24,418 | 25,377 | 26,624 | 27,826 | 25,828 | 24,079 | 23,980 |
| 1 Estimates are provided for Regional Authority areas and counties. The county estimates should be interpreted with caution because the underlying data are not always sufficiently robust. They should be regarded as indicative of relative levels rather than as accurate absolute figures. | ||||||||||
| Table 6 Indices of Total Income Per Person by Region and County, 2002 to 20111 | ||||||||||
| Indices of Total Income (State = 100) | ||||||||||
| 2002 | 2003 | 2004 | 2005 | 2006 | 2007 | 2008 | 2009 | 2010 | 2011 | |
| Border, Midland and Western | 87.2 | 88.7 | 89.6 | 89.2 | 88.4 | 88.1 | 88.3 | 89.2 | 90.9 | 87.6 |
| Border | 85.3 | 85.9 | 86.8 | 86.9 | 86.1 | 86.4 | 85.9 | 86.8 | 88.2 | 84.8 |
| Cavan | 84.6 | 84.7 | 86.5 | 88.0 | 86.9 | 89.4 | 87.8 | 88.0 | 88.5 | 84.0 |
| Donegal | 73.1 | 73.4 | 74.2 | 73.2 | 74.7 | 74.6 | 75.2 | 77.5 | 79.6 | 77.5 |
| Leitrim | 83.0 | 84.4 | 87.3 | 88.0 | 87.5 | 87.0 | 88.7 | 89.5 | 90.9 | 87.8 |
| Louth | 101.6 | 100.8 | 98.3 | 98.5 | 95.8 | 96.2 | 95.8 | 96.5 | 97.1 | 92.0 |
| Monaghan | 83.7 | 85.3 | 89.2 | 90.6 | 87.6 | 87.2 | 84.9 | 81.9 | 82.9 | 81.4 |
| Sligo | 88.9 | 92.1 | 94.5 | 93.6 | 92.9 | 93.1 | 91.1 | 93.6 | 95.5 | 91.6 |
| Midland | 90.5 | 93.5 | 92.6 | 92.0 | 90.7 | 88.7 | 88.1 | 87.6 | 89.2 | 88.1 |
| Laois | 89.0 | 91.9 | 93.1 | 91.2 | 90.9 | 90.2 | 90.9 | 90.4 | 91.5 | 90.3 |
| Longford | 88.7 | 90.5 | 89.9 | 90.9 | 89.5 | 87.4 | 87.6 | 86.4 | 87.8 | 83.5 |
| Offaly | 86.8 | 89.9 | 89.8 | 90.3 | 90.0 | 86.3 | 84.9 | 83.3 | 83.6 | 84.5 |
| Westmeath | 95.8 | 99.3 | 95.7 | 94.6 | 91.5 | 90.0 | 88.9 | 89.7 | 92.8 | 91.3 |
| West | 87.3 | 89.0 | 90.8 | 90.3 | 89.5 | 89.7 | 91.2 | 92.9 | 95.1 | 90.7 |
| Galway | 89.4 | 91.5 | 93.7 | 92.4 | 92.5 | 93.3 | 95.0 | 96.3 | 98.7 | 94.3 |
| Mayo | 84.2 | 85.9 | 87.5 | 87.0 | 84.5 | 84.4 | 85.8 | 88.7 | 91.0 | 87.6 |
| Roscommon | 85.7 | 85.8 | 87.0 | 89.1 | 88.2 | 86.4 | 87.7 | 88.5 | 89.6 | 82.7 |
| Southern and Eastern | 104.6 | 104.1 | 103.8 | 103.9 | 104.3 | 104.3 | 104.3 | 104.0 | 103.4 | 104.6 |
| Dublin | 118.6 | 117.7 | 116.3 | 116.0 | 115.7 | 115.5 | 116.0 | 115.8 | 110.2 | 117.3 |
| Mid East | 105.8 | 104.9 | 106.2 | 106.1 | 107.9 | 106.1 | 105.4 | 103.8 | 104.1 | 102.6 |
| Kildare | 111.8 | 110.1 | 111.4 | 111.0 | 113.0 | 110.2 | 109.8 | 108.7 | 107.6 | 107.1 |
| Meath | 99.8 | 99.3 | 101.0 | 102.5 | 105.3 | 104.1 | 104.0 | 100.8 | 102.0 | 98.8 |
| Wicklow | 104.2 | 104.2 | 104.9 | 103.4 | 103.8 | 102.5 | 100.9 | 100.5 | 101.6 | 100.7 |
| Mid West | 94.0 | 94.0 | 93.4 | 94.8 | 94.4 | 94.7 | 94.4 | 94.4 | 101.5 | 94.9 |
| Clare | 92.6 | 91.2 | 90.7 | 92.0 | 90.8 | 92.6 | 93.7 | 92.2 | 98.8 | 90.8 |
| Limerick | 96.2 | 97.1 | 96.4 | 96.9 | 97.0 | 96.9 | 95.4 | 96.3 | 104.6 | 99.0 |
| North Tipperary | 89.8 | 89.7 | 89.7 | 93.9 | 93.2 | 91.7 | 92.5 | 92.8 | 97.2 | 90.6 |
| South East | 89.8 | 89.9 | 90.1 | 89.8 | 91.7 | 94.2 | 93.5 | 92.4 | 93.2 | 90.3 |
| Carlow | 84.9 | 84.7 | 85.8 | 86.5 | 88.4 | 90.7 | 89.8 | 89.9 | 90.8 | 91.1 |
| Kilkenny | 85.0 | 85.7 | 85.2 | 86.0 | 90.1 | 92.1 | 93.0 | 91.1 | 89.9 | 86.1 |
| South Tipperary | 90.3 | 91.3 | 91.6 | 89.6 | 93.6 | 96.3 | 94.9 | 96.5 | 96.8 | 94.7 |
| Waterford | 99.1 | 98.0 | 99.0 | 97.4 | 95.6 | 97.4 | 95.2 | 93.7 | 95.7 | 94.0 |
| Wexford | 86.6 | 87.0 | 86.6 | 87.4 | 89.7 | 93.0 | 93.0 | 90.7 | 91.9 | 87.0 |
| South West | 93.8 | 93.5 | 94.1 | 94.9 | 94.7 | 94.6 | 94.7 | 95.7 | 98.7 | 98.1 |
| Cork | 97.5 | 96.9 | 97.6 | 98.5 | 98.0 | 98.0 | 98.2 | 99.1 | 102.4 | 101.8 |
| Kerry | 81.0 | 81.8 | 82.1 | 82.9 | 83.3 | 83.0 | 82.9 | 84.3 | 85.8 | 85.0 |
| State | 100 | 100 | 100 | 100 | 100 | 100 | 100 | 100 | 100 | 100 |
| 1 Estimates are provided for Regional Authority areas and counties. The county estimates should be interpreted with caution because the underlying data are not always | ||||||||||
| sufficiently robust. They should be regarded as indicative of relative levels rather than as accurate absolute figures. | ||||||||||
| Table 7 Estimates of Disposable Income Per Person (Excluding Rent) by Region and County, 2002 to 20111 | ||||||||||
| This table excludes rent, which is mainly imputed rent of owner occupied dwellings, from disposable income. | ||||||||||
| Disposable Income Per Person (€) (Excluding Rent) | ||||||||||
| 2002 | 2003 | 2004 | 2005 | 2006 | 2007 | 2008 | 2009 | 2010 | 2011 | |
| Border, Midland and Western | 13,642 | 14,924 | 16,057 | 17,298 | 17,755 | 18,179 | 19,162 | 18,389 | 17,293 | 16,325 |
| Border | 13,383 | 14,509 | 15,716 | 16,994 | 17,421 | 18,048 | 18,878 | 18,117 | 17,002 | 15,996 |
| Cavan | 13,525 | 14,520 | 15,878 | 17,459 | 17,865 | 18,869 | 19,204 | 18,232 | 17,002 | 15,838 |
| Donegal | 11,730 | 12,644 | 13,462 | 14,393 | 15,143 | 15,717 | 16,847 | 16,482 | 15,672 | 15,011 |
| Leitrim | 13,262 | 14,476 | 16,216 | 17,589 | 18,163 | 18,715 | 19,650 | 18,803 | 17,624 | 16,722 |
| Louth | 15,323 | 16,473 | 17,649 | 19,128 | 19,293 | 19,894 | 20,847 | 19,974 | 18,553 | 16,922 |
| Monaghan | 13,430 | 14,627 | 16,435 | 17,903 | 17,860 | 18,289 | 18,657 | 17,083 | 15,971 | 15,316 |
| Sligo | 13,771 | 15,365 | 16,600 | 17,800 | 18,286 | 18,913 | 19,683 | 19,180 | 18,036 | 17,134 |
| Midland | 14,186 | 15,753 | 16,753 | 17,896 | 18,286 | 18,379 | 19,049 | 18,006 | 16,919 | 16,432 |
| Laois | 14,055 | 15,590 | 17,163 | 17,964 | 18,655 | 18,973 | 19,525 | 18,441 | 17,235 | 16,705 |
| Longford | 14,277 | 15,623 | 16,253 | 17,775 | 18,131 | 18,143 | 19,094 | 17,971 | 16,973 | 16,327 |
| Offaly | 13,811 | 15,358 | 16,539 | 17,819 | 18,414 | 18,182 | 18,476 | 17,216 | 15,971 | 15,799 |
| Westmeath | 14,585 | 16,294 | 16,819 | 17,959 | 17,926 | 18,155 | 19,138 | 18,360 | 17,475 | 16,787 |
| West | 13,614 | 14,904 | 16,028 | 17,284 | 17,811 | 18,205 | 19,561 | 18,948 | 17,870 | 16,637 |
| Galway | 13,601 | 14,965 | 15,979 | 17,255 | 18,004 | 18,465 | 20,100 | 19,379 | 18,284 | 17,009 |
| Mayo | 13,457 | 14,739 | 16,067 | 17,125 | 17,250 | 17,664 | 18,779 | 18,459 | 17,479 | 16,536 |
| Roscommon | 14,007 | 15,019 | 16,134 | 17,734 | 18,234 | 18,321 | 19,082 | 18,280 | 17,064 | 15,389 |
| Southern and Eastern | 15,829 | 17,069 | 18,129 | 19,532 | 20,326 | 20,798 | 21,453 | 20,389 | 18,650 | 18,196 |
| Dublin | 17,494 | 18,897 | 19,885 | 21,272 | 22,004 | 22,327 | 22,989 | 21,963 | 19,139 | 19,465 |
| Mid East | 16,102 | 17,323 | 18,749 | 20,083 | 21,208 | 21,325 | 21,502 | 20,183 | 18,581 | 17,719 |
| Kildare | 16,742 | 17,938 | 19,428 | 20,780 | 21,989 | 21,883 | 22,277 | 21,034 | 19,132 | 18,377 |
| Meath | 15,358 | 16,517 | 18,038 | 19,654 | 21,020 | 21,281 | 21,363 | 19,708 | 18,318 | 17,299 |
| Wicklow | 16,055 | 17,401 | 18,636 | 19,602 | 20,299 | 20,559 | 20,536 | 19,541 | 18,107 | 17,270 |
| Mid West | 14,566 | 15,724 | 16,511 | 18,178 | 18,742 | 19,324 | 20,221 | 19,216 | 18,976 | 17,336 |
| Clare | 14,554 | 15,498 | 16,486 | 17,933 | 18,387 | 19,271 | 19,989 | 18,672 | 18,359 | 16,360 |
| Limerick | 14,659 | 15,982 | 16,577 | 18,205 | 18,842 | 19,373 | 20,434 | 19,596 | 19,520 | 18,031 |
| North Tipperary | 14,317 | 15,371 | 16,369 | 18,514 | 19,060 | 19,278 | 20,015 | 19,071 | 18,498 | 17,067 |
| South East | 14,131 | 15,228 | 16,237 | 17,471 | 18,532 | 19,646 | 20,313 | 19,075 | 17,748 | 16,846 |
| Carlow | 12,982 | 13,978 | 14,681 | 16,342 | 17,314 | 18,306 | 19,582 | 18,664 | 17,453 | 17,278 |
| Kilkenny | 13,593 | 14,726 | 15,461 | 16,761 | 18,269 | 19,211 | 19,967 | 18,553 | 16,898 | 15,871 |
| South Tipperary | 14,411 | 15,663 | 16,785 | 17,543 | 19,069 | 20,281 | 20,628 | 19,891 | 18,512 | 17,743 |
| Waterford | 15,291 | 16,337 | 17,582 | 18,751 | 18,979 | 20,032 | 20,653 | 19,289 | 18,080 | 17,295 |
| Wexford | 13,754 | 14,820 | 15,872 | 17,272 | 18,468 | 19,731 | 20,344 | 18,888 | 17,670 | 16,428 |
| South West | 14,392 | 15,494 | 16,627 | 18,109 | 18,697 | 19,156 | 20,036 | 19,212 | 18,264 | 17,645 |
| Cork | 14,840 | 15,943 | 17,101 | 18,649 | 19,202 | 19,673 | 20,601 | 19,744 | 18,807 | 18,119 |
| Kerry | 12,878 | 13,971 | 15,008 | 16,262 | 16,959 | 17,378 | 18,091 | 17,380 | 16,393 | 15,955 |
| State | 15,249 | 16,498 | 17,575 | 18,935 | 19,639 | 20,098 | 20,838 | 19,851 | 18,283 | 17,689 |
| 1 Estimates are provided for Regional Authority areas and counties. The county estimates should be interpreted with caution because the underlying data | ||||||||||
| are not always sufficiently robust. They should be regarded as indicative of relative levels rather than as accurate absolute figures. | ||||||||||
| Table 8 Indices of Disposable Income Per Person (Excluding Rent) by Region and County, 2002 to 20111 | ||||||||||
| This table excludes rent, which is mainly imputed rent of owner occupied dwellings, from disposable income. | ||||||||||
| Indices of Disposable Income Per Person (Excluding Rent) (State = 100) | ||||||||||
| 2002 | 2003 | 2004 | 2005 | 2006 | 2007 | 2008 | 2009 | 2010 | 2011 | |
| Border, Midland and Western | 89.5 | 90.5 | 91.4 | 91.4 | 90.4 | 90.5 | 92.0 | 92.6 | 94.6 | 92.3 |
| Border | 87.8 | 87.9 | 89.4 | 89.7 | 88.7 | 89.8 | 90.6 | 91.3 | 93.0 | 90.4 |
| Cavan | 88.7 | 88.0 | 90.3 | 92.2 | 91.0 | 93.9 | 92.2 | 91.8 | 93.0 | 89.5 |
| Donegal | 76.9 | 76.6 | 76.6 | 76.0 | 77.1 | 78.2 | 80.8 | 83.0 | 85.7 | 84.9 |
| Leitrim | 87.0 | 87.7 | 92.3 | 92.9 | 92.5 | 93.1 | 94.3 | 94.7 | 96.4 | 94.5 |
| Louth | 100.5 | 99.8 | 100.4 | 101.0 | 98.2 | 99.0 | 100.0 | 100.6 | 101.5 | 95.7 |
| Monaghan | 88.1 | 88.7 | 93.5 | 94.6 | 90.9 | 91.0 | 89.5 | 86.1 | 87.4 | 86.6 |
| Sligo | 90.3 | 93.1 | 94.5 | 94.0 | 93.1 | 94.1 | 94.5 | 96.6 | 98.7 | 96.9 |
| Midland | 93.0 | 95.5 | 95.3 | 94.5 | 93.1 | 91.4 | 91.4 | 90.7 | 92.5 | 92.9 |
| Laois | 92.2 | 94.5 | 97.7 | 94.9 | 95.0 | 94.4 | 93.7 | 92.9 | 94.3 | 94.4 |
| Longford | 93.6 | 94.7 | 92.5 | 93.9 | 92.3 | 90.3 | 91.6 | 90.5 | 92.8 | 92.3 |
| Offaly | 90.6 | 93.1 | 94.1 | 94.1 | 93.8 | 90.5 | 88.7 | 86.7 | 87.4 | 89.3 |
| Westmeath | 95.6 | 98.8 | 95.7 | 94.8 | 91.3 | 90.3 | 91.8 | 92.5 | 95.6 | 94.9 |
| West | 89.3 | 90.3 | 91.2 | 91.3 | 90.7 | 90.6 | 93.9 | 95.5 | 97.7 | 94.1 |
| Galway | 89.2 | 90.7 | 90.9 | 91.1 | 91.7 | 91.9 | 96.5 | 97.6 | 100.0 | 96.2 |
| Mayo | 88.2 | 89.3 | 91.4 | 90.4 | 87.8 | 87.9 | 90.1 | 93.0 | 95.6 | 93.5 |
| Roscommon | 91.9 | 91.0 | 91.8 | 93.7 | 92.8 | 91.2 | 91.6 | 92.1 | 93.3 | 87.0 |
| Southern and Eastern | 103.8 | 103.5 | 103.1 | 103.2 | 103.5 | 103.5 | 102.9 | 102.7 | 102.0 | 102.9 |
| Dublin | 114.7 | 114.5 | 113.1 | 112.3 | 112.0 | 111.1 | 110.3 | 110.6 | 104.7 | 110.0 |
| Mid East | 105.6 | 105.0 | 106.7 | 106.1 | 108.0 | 106.1 | 103.2 | 101.7 | 101.6 | 100.2 |
| Kildare | 109.8 | 108.7 | 110.5 | 109.7 | 112.0 | 108.9 | 106.9 | 106.0 | 104.6 | 103.9 |
| Meath | 100.7 | 100.1 | 102.6 | 103.8 | 107.0 | 105.9 | 102.5 | 99.3 | 100.2 | 97.8 |
| Wicklow | 105.3 | 105.5 | 106.0 | 103.5 | 103.4 | 102.3 | 98.5 | 98.4 | 99.0 | 97.6 |
| Mid West | 95.5 | 95.3 | 93.9 | 96.0 | 95.4 | 96.1 | 97.0 | 96.8 | 103.8 | 98.0 |
| Clare | 95.4 | 93.9 | 93.8 | 94.7 | 93.6 | 95.9 | 95.9 | 94.1 | 100.4 | 92.5 |
| Limerick | 96.1 | 96.9 | 94.3 | 96.1 | 95.9 | 96.4 | 98.1 | 98.7 | 106.8 | 101.9 |
| North Tipperary | 93.9 | 93.2 | 93.1 | 97.8 | 97.1 | 95.9 | 96.0 | 96.1 | 101.2 | 96.5 |
| South East | 92.7 | 92.3 | 92.4 | 92.3 | 94.4 | 97.8 | 97.5 | 96.1 | 97.1 | 95.2 |
| Carlow | 85.1 | 84.7 | 83.5 | 86.3 | 88.2 | 91.1 | 94.0 | 94.0 | 95.5 | 97.7 |
| Kilkenny | 89.1 | 89.3 | 88.0 | 88.5 | 93.0 | 95.6 | 95.8 | 93.5 | 92.4 | 89.7 |
| South Tipperary | 94.5 | 94.9 | 95.5 | 92.6 | 97.1 | 100.9 | 99.0 | 100.2 | 101.3 | 100.3 |
| Waterford | 100.3 | 99.0 | 100.0 | 99.0 | 96.6 | 99.7 | 99.1 | 97.2 | 98.9 | 97.8 |
| Wexford | 90.2 | 89.8 | 90.3 | 91.2 | 94.0 | 98.2 | 97.6 | 95.1 | 96.7 | 92.9 |
| South West | 94.4 | 93.9 | 94.6 | 95.6 | 95.2 | 95.3 | 96.1 | 96.8 | 99.9 | 99.8 |
| Cork | 97.3 | 96.6 | 97.3 | 98.5 | 97.8 | 97.9 | 98.9 | 99.5 | 102.9 | 102.4 |
| Kerry | 84.4 | 84.7 | 85.4 | 85.9 | 86.4 | 86.5 | 86.8 | 87.6 | 89.7 | 90.2 |
| State | 100 | 100 | 100 | 100 | 100 | 100 | 100 | 100 | 100 | 100 |
| 1 Estimates are provided for Regional Authority areas and counties. The county estimates should be interpreted with caution because the underlying data are not always sufficiently robust. They should be regarded as indicative of relative levels rather than as accurate absolute figures. | ||||||||||
| Table 9 GVA per person at Basic Prices, 2002 to 2011 € | ||||||||||
| Region | 2002 | 2003 | 2004 | 2005 | 2006 | 2007 | 2008 | 2009 | 2010 | 2011 |
| Border, Midland and Western | 20,743 | 21,960 | 23,835 | 24,482 | 26,474 | 26,219 | 25,010 | 22,438 | 20,685 | 21,387 |
| Border | 21,542 | 22,378 | 23,748 | 24,192 | 26,594 | 26,162 | 24,795 | 22,522 | 18,171 | 18,571 |
| Midland | 18,930 | 21,833 | 22,949 | 23,877 | 26,353 | 25,101 | 22,767 | 19,640 | 18,242 | 17,777 |
| West | 20,908 | 21,564 | 24,466 | 25,170 | 26,411 | 26,982 | 26,665 | 24,109 | 25,178 | 26,933 |
| Southern and Eastern | 33,435 | 35,367 | 36,491 | 38,568 | 40,341 | 42,212 | 39,778 | 36,057 | 35,337 | 36,249 |
| Dublin | 39,244 | 42,571 | 45,645 | 50,020 | 51,544 | 53,226 | 52,068 | 47,701 | 45,121 | 47,539 |
| Mid East | 24,785 | 24,477 | 26,220 | 27,098 | 29,775 | 31,263 | 28,249 | 24,061 | 23,330 | 21,714 |
| Dublin plus Mid East | 35,358 | 37,623 | 40,252 | 43,546 | 45,320 | 46,887 | 45,135 | 40,762 | 38,674 | 39,937 |
| Mid West | 21,513 | 26,945 | 28,497 | 30,106 | 31,469 | 33,463 | 30,416 | 27,538 | 29,617 | 25,982 |
| South East | 26,648 | 27,184 | 26,750 | 25,813 | 26,908 | 28,750 | 27,451 | 22,453 | 22,029 | 22,610 |
| South West | 40,278 | 40,274 | 38,283 | 39,657 | 42,141 | 44,659 | 39,916 | 38,448 | 39,603 | 42,311 |
| State | 30,071 | 31,800 | 33,111 | 34,803 | 36,631 | 37,937 | 35,819 | 32,388 | 31,377 | 32,224 |
| Table 10 Indices of GVA per person at Basic Prices, 2002 to 2011 (State = 100) | ||||||||||
| Region | 2002 | 2003 | 2004 | 2005 | 2006 | 2007 | 2008 | 2009 | 2010 | 2011 |
| Border, Midland and Western | 69.0 | 69.1 | 72.0 | 70.3 | 72.3 | 69.1 | 69.8 | 69.3 | 65.9 | 66.4 |
| Border | 71.6 | 70.4 | 71.7 | 69.5 | 72.6 | 69.0 | 69.2 | 69.5 | 57.9 | 57.6 |
| Midland | 63.0 | 68.7 | 69.3 | 68.6 | 71.9 | 66.2 | 63.6 | 60.6 | 58.1 | 55.2 |
| West | 69.5 | 67.8 | 73.9 | 72.3 | 72.1 | 71.1 | 74.4 | 74.4 | 80.2 | 83.6 |
| Southern and Eastern | 111.2 | 111.2 | 110.2 | 110.8 | 110.1 | 111.3 | 111.1 | 111.3 | 112.6 | 112.5 |
| Dublin | 130.5 | 133.9 | 137.9 | 143.7 | 140.7 | 140.3 | 145.4 | 147.3 | 143.8 | 147.5 |
| Mid East | 82.4 | 77.0 | 79.2 | 77.9 | 81.3 | 82.4 | 78.9 | 74.3 | 74.4 | 67.4 |
| Dublin plus Mid East | 117.6 | 118.3 | 121.6 | 125.1 | 123.7 | 123.6 | 126.0 | 125.9 | 123.3 | 123.9 |
| Mid West | 71.5 | 84.7 | 86.1 | 86.5 | 85.9 | 88.2 | 84.9 | 85.0 | 94.4 | 80.6 |
| South East | 88.6 | 85.5 | 80.8 | 74.2 | 73.5 | 75.8 | 76.6 | 69.3 | 70.2 | 70.2 |
| South West | 133.9 | 126.6 | 115.6 | 113.9 | 115.0 | 117.7 | 111.4 | 118.7 | 126.2 | 131.3 |
| State | 100 | 100 | 100 | 100 | 100 | 100 | 100 | 100 | 100 | 100 |
| Table 11 Indices of GVA per person at Basic Prices, 2002 to 2011 (EU27 = 100) | ||||||||||
| Region | 2002 | 2003 | 2004 | 2005 | 2006 | 2007 | 2008 | 2009 | 2010 | 2011 |
| Border, Midland and Western | 95.9 | 98.1 | 102.9 | 101.3 | 105.5 | 100.9 | 92.2 | 89.4 | 85.0 | 85.6 |
| Border | 99.6 | 99.9 | 102.6 | 100.1 | 106.0 | 100.7 | 91.4 | 89.7 | 74.7 | 74.3 |
| Midland | 87.5 | 97.5 | 99.1 | 98.8 | 105.0 | 96.6 | 83.9 | 78.2 | 75.0 | 71.2 |
| West | 96.6 | 96.3 | 105.7 | 104.1 | 105.3 | 103.8 | 98.3 | 96.0 | 103.5 | 107.8 |
| Southern and Eastern | 154.5 | 157.9 | 157.6 | 159.6 | 160.8 | 162.4 | 146.6 | 143.6 | 145.3 | 145.1 |
| Dublin | 181.4 | 190.1 | 197.1 | 207.0 | 205.4 | 204.8 | 191.9 | 190.0 | 185.5 | 190.3 |
| Mid East | 114.6 | 109.3 | 113.2 | 112.1 | 118.7 | 120.3 | 104.1 | 95.8 | 95.9 | 86.9 |
| Dublin plus Mid East | 163.4 | 168.0 | 173.8 | 180.2 | 180.6 | 180.4 | 166.3 | 162.4 | 159.0 | 159.9 |
| Mid West | 99.4 | 120.3 | 123.1 | 124.6 | 125.4 | 128.8 | 112.1 | 109.7 | 121.8 | 104.0 |
| South East | 123.2 | 121.4 | 115.5 | 106.8 | 107.2 | 110.6 | 101.2 | 89.4 | 90.6 | 90.5 |
| South West | 186.2 | 179.8 | 165.3 | 164.1 | 168.0 | 171.9 | 147.1 | 153.1 | 162.8 | 169.4 |
| State | 139.0 | 142.0 | 143.0 | 144.0 | 146.0 | 146.0 | 132.0 | 129.0 | 129.0 | 129.0 |
| Table 12 GVA at Basic Prices, population and persons at work for each region, 2010 | ||||||
| Region | GVA (€m) | Population (000) | Persons at work (000) | GVA % | Population % | Persons at work (%) |
| Border, Midland and Western | 25,493 | 1,232 | 483 | 17.8 | 27.0 | 25.5 |
| Border | 9,315 | 513 | 194 | 6.5 | 11.2 | 10.2 |
| Midland | 5,119 | 281 | 105 | 3.6 | 6.2 | 5.6 |
| West | 11,060 | 439 | 184 | 7.7 | 9.6 | 9.7 |
| Southern and Eastern | 117,574 | 3,327 | 1,414 | 82.2 | 73.0 | 74.5 |
| Dublin | 56,859 | 1,260 | 562 | 39.7 | 27.6 | 29.6 |
| Mid East | 12,353 | 530 | 228 | 8.6 | 11.6 | 12.0 |
| Dublin plus Mid East | 69,213 | 1,790 | 790 | 48.4 | 39.2 | 41.7 |
| Mid West | 11,198 | 378 | 151 | 7.8 | 8.3 | 8.0 |
| South East | 10,974 | 498 | 191 | 7.7 | 10.9 | 10.1 |
| South West | 26,189 | 661 | 282 | 18.3 | 14.5 | 14.8 |
| State | 143,066 | 4,560 | 1,897 | 100.0 | 100.0 | 100.0 |
| Table 13 GVA at Basic Prices, population and persons at work for each region, 2011 | |||||||||
| Region | GVA (€m) | Population (000) | Persons at work (000) | GVA % | Population % | Persons at work (%) | |||
| Border, Midland and Western | 26,577 | 1,243 | 471 | 18.0 | 27.1 | 25.3 | |||
| Border | 9,562 | 515 | 183 | 6.5 | 11.2 | 9.9 | |||
| Midland | 5,020 | 282 | 108 | 3.4 | 6.2 | 5.8 | |||
| West | 11,995 | 445 | 179 | 8.1 | 9.7 | 9.6 | |||
| Southern and Eastern | 121,276 | 3,346 | 1,387 | 82.0 | 72.9 | 74.7 | |||
| Dublin | 60,521 | 1,273 | 555 | 40.9 | 27.7 | 29.9 | |||
| Mid East | 11,532 | 531 | 224 | 7.8 | 11.6 | 12.0 | |||
| Dublin plus Mid East | 72,052 | 1,804 | 779 | 48.7 | 39.3 | 41.9 | |||
| Mid West | 9,856 | 379 | 157 | 6.7 | 8.3 | 8.4 | |||
| South East | 11,250 | 498 | 185 | 7.6 | 10.8 | 9.9 | |||
| South West | 28,117 | 665 | 267 | 19.0 | 14.5 | 14.4 | |||
| State | 147,853 | 4,588 | 1,857 | 100.0 | 100.0 | 100.0 | |||
| Table 14 Total GVA of each region at Factor Cost, Basic Prices and Market Prices, 2011 | € million | ||||||
| Region | GVA at Factor Cost | Other Taxes | Other Subsidies | GVA at Basic Prices | Product Taxes | Product Subsidies | GVA at Market Prices |
| Border, Midland and Western | 26,890 | 416 | -729 | 26,577 | 2,830 | -179 | 29,228 |
| Border | 9,682 | 162 | -283 | 9,562 | 1,018 | -64 | 10,516 |
| Midland | 5,109 | 77 | -166 | 5,020 | 535 | -34 | 5,521 |
| West | 12,099 | 177 | -281 | 11,995 | 1,277 | -81 | 13,191 |
| Southern and Eastern | 120,662 | 1,940 | -1,326 | 121,276 | 12,913 | -816 | 133,373 |
| Dublin | 59,921 | 869 | -270 | 60,521 | 6,443 | -407 | 66,557 |
| Mid East | 11,524 | 197 | -189 | 11,532 | 1,228 | -78 | 12,682 |
| Dublin plus Mid East | 71,445 | 1,065 | -458 | 72,052 | 7,671 | -485 | 79,239 |
| Mid West | 9,910 | 172 | -226 | 9,856 | 1,049 | -66 | 10,839 |
| South East | 11,395 | 154 | -299 | 11,250 | 1,198 | -76 | 12,372 |
| South West | 27,911 | 548 | -342 | 28,117 | 2,994 | -189 | 30,922 |
| State | 147,552 | 2,356 | -2,055 | 147,853 | 15,742 | -994 | 162,600 |
| Table 15 GVA at Basic Prices classified by region and branch, 2010 and 2011 | € million | |||||||
| Region | Agriculture, Forestry and Fishing | Manufacturing, Building and Construction | Market and Non Market Services | Total GVA1 | ||||
| 2010 | 2011 | 2010 | 2011 | 2010 | 2011 | 2010 | 2011 | |
| Border, Midland and Western | 661 | 793 | 7,436 | 8,655 | 17,661 | 17,334 | 25,493 | 26,577 |
| Border | 305 | 346 | 2,260 | 2,639 | 6,847 | 6,650 | 9,315 | 9,562 |
| Midland | 145 | 190 | 1,072 | 989 | 3,955 | 3,880 | 5,119 | 5,020 |
| West | 211 | 257 | 4,104 | 5,027 | 6,859 | 6,804 | 11,060 | 11,995 |
| Southern and Eastern | 1,543 | 1,971 | 30,791 | 33,097 | 86,465 | 87,146 | 117,574 | 121,276 |
| Dublin | 92 | 101 | 8,639 | 8,140 | 48,721 | 52,748 | 56,859 | 60,521 |
| Mid East | 214 | 259 | 3,608 | 3,199 | 8,660 | 8,163 | 12,353 | 11,532 |
| Dublin plus Mid East | 306 | 360 | 12,247 | 11,339 | 57,381 | 60,911 | 69,213 | 72,052 |
| Mid West | 260 | 322 | 3,299 | 3,072 | 7,755 | 6,538 | 11,198 | 9,856 |
| South East | 415 | 540 | 2,645 | 3,524 | 8,029 | 7,273 | 10,974 | 11,250 |
| South West | 561 | 750 | 12,601 | 15,162 | 13,300 | 12,424 | 26,189 | 28,117 |
| State | 2,204 | 2,764 | 38,228 | 41,752 | 104,125 | 104,480 | 143,066 | 147,853 |
| 1 Total GVA does not equal the sum of the three sectors shown due to the effect of the Statistical Discrepancy (-€1,490m in 2010 and | ||||||||
| -€1144m in 2011 at State level) - see Background Notes. | ||||||||
| Table 15a GVA at Factor Cost1 classified by region and branch, 2010 and 2011 | € million | |||||||
| Region | Agriculture, Forestry and Fishing | Manufacturing, Building and Construction | Market and Non Market Services | Total GVA2 | ||||
| 2010 | 2011 | 2010 | 2011 | 2010 | 2011 | 2010 | 2011 | |
| Border, Midland and Western | 1,189 | 1,306 | 7,309 | 8,502 | 17,622 | 17,288 | 25,854 | 26,890 |
| Border | 501 | 540 | 2,219 | 2,584 | 6,832 | 6,633 | 9,455 | 9,682 |
| Midland | 263 | 312 | 1,050 | 971 | 3,941 | 3,864 | 5,200 | 5,109 |
| West | 426 | 454 | 4,040 | 4,946 | 6,849 | 6,791 | 11,199 | 12,099 |
| Southern and Eastern | 2,171 | 2,631 | 30,219 | 32,503 | 85,822 | 86,465 | 116,988 | 120,662 |
| Dublin | 100 | 109 | 8,507 | 8,009 | 48,605 | 52,272 | 56,619 | 59,921 |
| Mid East | 301 | 350 | 3,529 | 3,147 | 8,554 | 8,116 | 12,256 | 11,524 |
| Dublin plus Mid East | 401 | 459 | 12,036 | 11,156 | 57,159 | 60,387 | 68,876 | 71,445 |
| Mid West | 400 | 468 | 3,270 | 3,035 | 7,602 | 6,484 | 11,156 | 9,910 |
| South East | 603 | 744 | 2,612 | 3,495 | 7,944 | 7,244 | 11,044 | 11,395 |
| South West | 767 | 960 | 12,301 | 14,818 | 13,117 | 12,351 | 25,912 | 27,911 |
| State | 3,360 | 3,937 | 37,528 | 41,005 | 103,444 | 103,753 | 142,842 | 147,552 |
| 1 The relationship between GVA at Factor Cost, Basic Prices and Market Prices can be seen in Table 14. | ||||||||
| 2 Total GVA does not equal the sum of the three sectors shown due to the effect of the Statistical Discrepancy (-€1,490m in 2010 and | ||||||||
| -€1,144m in 2011 at State level) - see Background Notes. | ||||||||
| Table 16 Percentage share of GVA at Basic Prices produced by each branch within each region, 2010 and 2011 | ||||||||
| Region | Agriculture, Forestry and Fishing | Manufacturing, Building and Construction | Market and Non Market Services | Total GVA | ||||
| 2010 | 2011 | 2010 | 2011 | 2010 | 2011 | 2010 | 2011 | |
| Border, Midland and Western | 2.6 | 3.0 | 28.9 | 32.3 | 68.6 | 64.7 | 100 | 100 |
| Border | 3.2 | 3.6 | 24.0 | 27.4 | 72.7 | 69.0 | 100 | 100 |
| Midland | 2.8 | 3.8 | 20.7 | 19.6 | 76.5 | 76.7 | 100 | 100 |
| West | 1.9 | 2.1 | 36.7 | 41.6 | 61.4 | 56.3 | 100 | 100 |
| Southern and Eastern | 1.3 | 1.6 | 25.9 | 27.1 | 72.8 | 71.3 | 100 | 100 |
| Dublin | 0.2 | 0.2 | 15.0 | 13.3 | 84.8 | 86.5 | 100 | 100 |
| Mid East | 1.7 | 2.2 | 28.9 | 27.5 | 69.4 | 70.2 | 100 | 100 |
| Dublin plus Mid East | 0.4 | 0.5 | 17.5 | 15.6 | 82.1 | 83.9 | 100 | 100 |
| Mid West | 2.3 | 3.2 | 29.2 | 30.9 | 68.5 | 65.8 | 100 | 100 |
| South East | 3.7 | 4.8 | 23.9 | 31.1 | 72.4 | 64.2 | 100 | 100 |
| South West | 2.1 | 2.6 | 47.6 | 53.5 | 50.3 | 43.8 | 100 | 100 |
| State | 1.5 | 1.9 | 26.4 | 28.0 | 72.0 | 70.1 | 100 | 100 |
| Table 16a Percentage share of GVA at Factor Cost1 produced by each branch within each region, 2010 and 2011 | ||||||||
| Region | Agriculture, Forestry and Fishing | Manufacturing, Building and Construction | Market and Non Market Services | Total GVA | ||||
| 2010 | 2011 | 2010 | 2011 | 2010 | 2011 | 2010 | 2011 | |
| Border, Midland and Western | 4.6 | 4.8 | 28.0 | 31.4 | 67.5 | 63.8 | 100 | 100 |
| Border | 5.2 | 5.5 | 23.2 | 26.5 | 71.5 | 68.0 | 100 | 100 |
| Midland | 5.0 | 6.1 | 20.0 | 18.9 | 75.0 | 75.1 | 100 | 100 |
| West | 3.8 | 3.7 | 35.7 | 40.6 | 60.5 | 55.7 | 100 | 100 |
| Southern and Eastern | 1.8 | 2.2 | 25.6 | 26.7 | 72.6 | 71.1 | 100 | 100 |
| Dublin | 0.2 | 0.2 | 14.9 | 13.3 | 85.0 | 86.6 | 100 | 100 |
| Mid East | 2.4 | 3.0 | 28.5 | 27.1 | 69.1 | 69.9 | 100 | 100 |
| Dublin plus Mid East | 0.6 | 0.6 | 17.3 | 15.5 | 82.1 | 83.9 | 100 | 100 |
| Mid West | 3.6 | 4.7 | 29.0 | 30.4 | 67.4 | 64.9 | 100 | 100 |
| South East | 5.4 | 6.5 | 23.4 | 30.4 | 71.2 | 63.1 | 100 | 100 |
| South West | 2.9 | 3.4 | 47.0 | 52.7 | 50.1 | 43.9 | 100 | 100 |
| State | 2.3 | 2.6 | 26.0 | 27.6 | 71.7 | 69.8 | 100 | 100 |
| 1 The relationship between GVA at Factor Cost, Basic Prices and Market Prices can be seen in Table 14. | ||||||||
| Table 17 Percentage share of GVA at Basic Prices of each branch produced by each region, 2010 and 2011 | € million | |||||||
| Region | Agriculture, Forestry and Fishing | Manufacturing, Building and Construction | Market and Non Market Services | Total GVA | ||||
| 2010 | 2011 | 2010 | 2011 | 2010 | 2011 | 2010 | 2011 | |
| Border, Midland and Western | 30.0 | 28.7 | 19.5 | 20.7 | 17.0 | 16.6 | 17.8 | 18.0 |
| Border | 13.8 | 12.5 | 5.9 | 6.3 | 6.6 | 6.4 | 6.5 | 6.5 |
| Midland | 6.6 | 6.9 | 2.8 | 2.4 | 3.8 | 3.7 | 3.6 | 3.4 |
| West | 9.6 | 9.3 | 10.7 | 12.0 | 6.6 | 6.5 | 7.7 | 8.1 |
| Southern and Eastern | 70.0 | 71.3 | 80.5 | 79.3 | 83.0 | 83.4 | 82.2 | 82.0 |
| Dublin | 4.2 | 3.6 | 22.6 | 19.5 | 46.8 | 50.5 | 39.7 | 40.9 |
| Mid East | 9.7 | 9.4 | 9.4 | 7.7 | 8.3 | 7.8 | 8.6 | 7.8 |
| Dublin plus Mid East | 13.9 | 13.0 | 32.0 | 27.2 | 55.1 | 58.3 | 48.4 | 48.7 |
| Mid West | 11.8 | 11.7 | 8.6 | 7.4 | 7.4 | 6.3 | 7.8 | 6.7 |
| South East | 18.8 | 19.5 | 6.9 | 8.4 | 7.7 | 7.0 | 7.7 | 7.6 |
| South West | 25.5 | 27.1 | 33.0 | 36.3 | 12.8 | 11.9 | 18.3 | 19.0 |
| State | 100 | 100 | 100 | 100 | 100 | 100 | 100 | 100 |
| Table 17a Percentage share of GVA at Factor Cost¹ of each branch produced by each region, 2010 and 2011 | ||||||||
| Region | Agriculture, Forestry and Fishing | Manufacturing, Building and Construction | Market and Non Market Services | Total GVA | ||||
| 2010 | 2011 | 2010 | 2011 | 2010 | 2011 | 2010 | 2011 | |
| Border, Midland and Western | 35.4 | 33.2 | 19.5 | 20.7 | 17.0 | 16.7 | 18.1 | 18.2 |
| Border | 14.9 | 13.7 | 5.9 | 6.3 | 6.6 | 6.4 | 6.6 | 6.6 |
| Midland | 7.8 | 7.9 | 2.8 | 2.4 | 3.8 | 3.7 | 3.6 | 3.5 |
| West | 12.7 | 11.5 | 10.8 | 12.1 | 6.6 | 6.5 | 7.8 | 8.2 |
| Southern and Eastern | 64.6 | 66.8 | 80.5 | 79.3 | 83.0 | 83.3 | 81.9 | 81.8 |
| Dublin | 3.0 | 2.8 | 22.7 | 19.5 | 47.0 | 50.4 | 39.6 | 40.6 |
| Mid East | 9.0 | 8.9 | 9.4 | 7.7 | 8.3 | 7.8 | 8.6 | 7.8 |
| Dublin plus Mid East | 11.9 | 11.7 | 32.1 | 27.2 | 55.3 | 58.2 | 48.2 | 48.4 |
| Mid West | 11.9 | 11.9 | 8.7 | 7.4 | 7.3 | 6.2 | 7.8 | 6.7 |
| South East | 17.9 | 18.9 | 7.0 | 8.5 | 7.7 | 7.0 | 7.7 | 7.7 |
| South West | 22.8 | 24.4 | 32.8 | 36.1 | 12.7 | 11.9 | 18.1 | 18.9 |
| State | 100 | 100 | 100 | 100 | 100 | 100 | 100 | 100 |
| 1 The relationship between GVA at Factor Cost, Basic Prices and Market Prices can be seen in Table 14. | ||||||||
| Table 18 GVA at Basic Prices (€m & %) classified by region and branch, 2002 to 2009 | ||||||||
| Region | Agriculture, Forestry and Fishing | Manufacturing, Building and Construction | Market and Non Market Services | Total GVA1 | ||||
| 2002 | ||||||||
| €m | % | €m | % | €m | % | €m | % | |
| Border, Midland and Western | 1,086 | 5.1 | 8,237 | 38.9 | 11,859 | 56.0 | 21,535 | 100 |
| Border | 489 | 5.3 | 3,948 | 43.1 | 4,729 | 51.6 | 9,318 | 100 |
| Midland | 240 | 5.7 | 1,365 | 32.5 | 2,592 | 61.8 | 4,266 | 100 |
| West | 357 | 4.6 | 2,925 | 37.4 | 4,539 | 58.0 | 7,951 | 100 |
| Southern and Eastern | 1,937 | 2.0 | 36,592 | 38.6 | 56,152 | 59.3 | 96,260 | 100 |
| Dublin | 95 | 0.2 | 9,322 | 21.5 | 33,924 | 78.3 | 44,064 | 100 |
| Mid East | 322 | 3.2 | 4,992 | 49.6 | 4,745 | 47.2 | 10,227 | 100 |
| Dublin plus Mid East | 417 | 0.8 | 14,314 | 26.8 | 38,670 | 72.4 | 54,291 | 100 |
| Mid West | 328 | 4.6 | 2,285 | 31.8 | 4,572 | 63.6 | 7,306 | 100 |
| South East | 557 | 5.0 | 5,669 | 51.1 | 4,878 | 43.9 | 11,289 | 100 |
| South West | 635 | 2.8 | 14,324 | 62.3 | 8,032 | 34.9 | 23,375 | 100 |
| State | 3,023 | 2.6 | 44,829 | 38.7 | 68,011 | 58.7 | 117,795 | 100 |
| 2003 | ||||||||
| €m | % | €m | % | €m | % | €m | % | |
| Border, Midland and Western | 1,064 | 4.6 | 7,929 | 34.6 | 13,914 | 60.7 | 23,256 | 100 |
| Border | 478 | 4.9 | 3,683 | 38.0 | 5,528 | 57.1 | 9,837 | 100 |
| Midland | 238 | 4.8 | 1,650 | 33.3 | 3,066 | 61.9 | 5,029 | 100 |
| West | 348 | 4.2 | 2,596 | 31.4 | 5,320 | 64.4 | 8,390 | 100 |
| Southern and Eastern | 1,899 | 1.9 | 35,934 | 35.3 | 63,920 | 62.8 | 103,303 | 100 |
| Dublin | 90 | 0.2 | 8,714 | 18.3 | 38,712 | 81.5 | 48,240 | 100 |
| Mid East | 316 | 3.1 | 4,584 | 44.6 | 5,383 | 52.4 | 10,440 | 100 |
| Dublin plus Mid East | 407 | 0.7 | 13,298 | 23.0 | 44,096 | 76.3 | 58,680 | 100 |
| Mid West | 311 | 3.4 | 3,669 | 40.4 | 5,107 | 56.2 | 9,225 | 100 |
| South East | 550 | 4.8 | 5,372 | 46.6 | 5,604 | 48.6 | 11,701 | 100 |
| South West | 632 | 2.7 | 13,596 | 58.2 | 9,114 | 39.0 | 23,697 | 100 |
| State | 2,963 | 2.4 | 43,863 | 35.2 | 77,834 | 62.4 | 126,558 | 100 |
| 2004 | ||||||||
| €m | % | €m | % | €m | % | €m | % | |
| Border, Midland and Western | 1,142 | 4.5 | 8,981 | 35.4 | 15,221 | 60.1 | 25,748 | 100 |
| Border | 487 | 4.6 | 3,879 | 36.9 | 6,148 | 58.5 | 10,681 | 100 |
| Midland | 273 | 5.1 | 1,767 | 33.1 | 3,300 | 61.8 | 5,426 | 100 |
| West | 382 | 4.0 | 3,335 | 35.1 | 5,772 | 60.8 | 9,641 | 100 |
| Southern and Eastern | 2,028 | 1.9 | 35,462 | 33.3 | 69,003 | 64.8 | 108,192 | 100 |
| Dublin | 92 | 0.2 | 9,583 | 18.6 | 41,758 | 81.2 | 52,254 | 100 |
| Mid East | 332 | 2.9 | 5,046 | 44.4 | 5,979 | 52.6 | 11,537 | 100 |
| Dublin plus Mid East | 424 | 0.7 | 14,629 | 23.3 | 47,737 | 76.0 | 63,792 | 100 |
| Mid West | 355 | 3.7 | 3,873 | 40.0 | 5,466 | 56.4 | 9,849 | 100 |
| South East | 597 | 5.2 | 4,945 | 42.9 | 5,992 | 52.0 | 11,718 | 100 |
| South West | 653 | 2.9 | 12,015 | 53.5 | 9,808 | 43.6 | 22,834 | 100 |
| State | 3,170 | 2.4 | 44,443 | 33.7 | 84,224 | 63.9 | 133,940 | 100 |
| 2005 | ||||||||
| €m | % | €m | % | €m | % | €m | % | |
| Border, Midland and Western | 893 | 3.3 | 9,437 | 35.2 | 16,503 | 61.5 | 27,052 | 100 |
| Border | 408 | 3.7 | 3,963 | 36.1 | 6,609 | 60.2 | 11,069 | 100 |
| Midland | 182 | 3.2 | 1,930 | 33.7 | 3,616 | 63.1 | 5,775 | 100 |
| West | 302 | 3.0 | 3,545 | 35.0 | 6,279 | 62.0 | 10,208 | 100 |
| Southern and Eastern | 1,641 | 1.4 | 36,854 | 31.8 | 77,376 | 66.8 | 116,816 | 100 |
| Dublin | 79 | 0.1 | 10,735 | 18.6 | 46,770 | 81.2 | 58,055 | 100 |
| Mid East | 254 | 2.1 | 5,238 | 42.7 | 6,788 | 55.3 | 12,380 | 100 |
| Dublin plus Mid East | 333 | 0.5 | 15,973 | 22.9 | 53,558 | 76.7 | 70,434 | 100 |
| Mid West | 330 | 3.1 | 4,166 | 39.5 | 6,049 | 57.4 | 10,631 | 100 |
| South East | 435 | 3.8 | 4,370 | 38.0 | 6,692 | 58.2 | 11,591 | 100 |
| South West | 543 | 2.3 | 12,345 | 51.5 | 11,077 | 46.2 | 24,160 | 100 |
| State | 2,534 | 1.8 | 46,291 | 32.4 | 93,879 | 65.8 | 143,868 | 100 |
| 2006 | ||||||||
| €m | % | €m | % | €m | % | €m | % | |
| Border, Midland and Western | 749 | 2.5 | 11,304 | 37.6 | 18,027 | 59.9 | 30,029 | 100 |
| Border | 352 | 2.8 | 4,918 | 39.4 | 7,208 | 57.8 | 12,456 | 100 |
| Midland | 159 | 2.4 | 2,518 | 37.9 | 3,966 | 59.7 | 6,632 | 100 |
| West | 239 | 2.2 | 3,869 | 35.3 | 6,853 | 62.5 | 10,941 | 100 |
| Southern and Eastern | 1,509 | 1.2 | 39,448 | 31.4 | 84,539 | 67.4 | 125,282 | 100 |
| Dublin | 80 | 0.1 | 10,543 | 17.2 | 50,674 | 82.7 | 61,192 | 100 |
| Mid East | 237 | 1.7 | 6,241 | 44.0 | 7,700 | 54.3 | 14,154 | 100 |
| Dublin plus Mid East | 317 | 0.4 | 16,784 | 22.2 | 58,373 | 77.3 | 75,346 | 100 |
| Mid West | 278 | 2.4 | 4,497 | 39.5 | 6,606 | 58.0 | 11,361 | 100 |
| South East | 432 | 3.5 | 4,526 | 36.4 | 7,462 | 60.1 | 12,400 | 100 |
| South West | 481 | 1.8 | 13,641 | 52.0 | 12,097 | 46.1 | 26,175 | 100 |
| State | 2,258 | 1.5 | 50,753 | 32.6 | 102,566 | 65.9 | 155,311 | 100 |
| 2007 | ||||||||
| €m | % | €m | % | €m | % | €m | % | |
| Border, Midland and Western | 778 | 2.5 | 10,761 | 34.6 | 19,576 | 62.9 | 30,828 | 100 |
| Border | 380 | 3.0 | 4,647 | 36.1 | 7,831 | 60.9 | 12,738 | 100 |
| Midland | 159 | 2.4 | 2,227 | 33.3 | 4,309 | 64.4 | 6,633 | 100 |
| West | 239 | 2.1 | 3,888 | 33.6 | 7,436 | 64.3 | 11,456 | 100 |
| Southern and Eastern | 1,788 | 1.3 | 41,768 | 30.4 | 93,772 | 68.3 | 136,057 | 100 |
| Dublin | 88 | 0.1 | 9,925 | 15.0 | 56,238 | 84.9 | 65,637 | 100 |
| Mid East | 261 | 1.7 | 6,738 | 42.7 | 8,790 | 55.7 | 15,642 | 100 |
| Dublin plus Mid East | 348 | 0.4 | 16,663 | 20.3 | 65,028 | 79.3 | 81,280 | 100 |
| Mid West | 289 | 2.3 | 4,985 | 40.0 | 7,186 | 57.7 | 12,345 | 100 |
| South East | 535 | 3.9 | 5,073 | 36.5 | 8,288 | 59.6 | 13,768 | 100 |
| South West | 616 | 2.1 | 15,048 | 52.0 | 13,268 | 45.9 | 28,664 | 100 |
| State | 2,566 | 1.5 | 52,529 | 31.2 | 113,348 | 67.3 | 166,884 | 100 |
| 2008 | ||||||||
| €m | % | €m | % | €m | % | €m | % | |
| Border, Midland and Western | 672 | 2.2 | 10,114 | 33.6 | 19,340 | 64.2 | 30,103 | 100 |
| Border | 296 | 2.4 | 4,425 | 35.7 | 7,670 | 61.9 | 12,381 | 100 |
| Midland | 141 | 2.3 | 1,792 | 29.0 | 4,254 | 68.8 | 6,182 | 100 |
| West | 234 | 2.0 | 3,897 | 33.7 | 7,417 | 64.2 | 11,539 | 100 |
| Southern and Eastern | 1,591 | 1.2 | 35,685 | 27.3 | 93,531 | 71.5 | 130,706 | 100 |
| Dublin | 83 | 0.1 | 9,352 | 14.3 | 55,804 | 85.5 | 65,188 | 100 |
| Mid East | 226 | 1.6 | 5,546 | 38.2 | 8,761 | 60.3 | 14,521 | 100 |
| Dublin plus Mid East | 309 | 0.4 | 14,898 | 18.7 | 64,564 | 80.9 | 79,710 | 100 |
| Mid West | 242 | 2.1 | 3,962 | 34.7 | 7,211 | 63.2 | 11,406 | 100 |
| South East | 480 | 3.6 | 4,550 | 33.8 | 8,430 | 62.6 | 13,450 | 100 |
| South West | 561 | 2.1 | 12,275 | 46.9 | 13,326 | 50.9 | 26,141 | 100 |
| State | 2,263 | 1.4 | 45,799 | 28.5 | 112,871 | 70.1 | 160,809 | 100 |
| 2009 | ||||||||
| €m | % | €m | % | €m | % | €m | % | |
| Border, Midland and Western | 521 | 1.9 | 8,006 | 29.4 | 18,712 | 68.7 | 27,414 | 100 |
| Border | 249 | 2.2 | 3,747 | 33.0 | 7,373 | 64.9 | 11,441 | 100 |
| Midland | 95 | 1.8 | 1,210 | 22.4 | 4,089 | 75.8 | 5,429 | 100 |
| West | 177 | 1.7 | 3,049 | 29.1 | 7,250 | 69.2 | 10,544 | 100 |
| Southern and Eastern | 1,132 | 1.0 | 32,399 | 27.3 | 85,184 | 71.8 | 119,478 | 100 |
| Dublin | 80 | 0.1 | 9,158 | 15.4 | 50,388 | 84.5 | 60,010 | 100 |
| Mid East | 181 | 1.5 | 4,284 | 34.3 | 8,033 | 64.3 | 12,578 | 100 |
| Dublin plus Mid East | 261 | 0.4 | 13,442 | 18.6 | 58,420 | 81.0 | 72,588 | 100 |
| Mid West | 147 | 1.4 | 3,427 | 33.2 | 6,753 | 65.4 | 10,393 | 100 |
| South East | 346 | 3.1 | 3,031 | 27.4 | 7,680 | 69.5 | 11,128 | 100 |
| South West | 378 | 1.5 | 12,499 | 49.6 | 12,331 | 48.9 | 25,370 | 100 |
| State | 1,652 | 1.1 | 40,405 | 27.7 | 103,895 | 71.2 | 146,892 | 100 |
| 1 Total GVA does not equal the sum of the three sectors shown due to the effect of the Statistical Discrepancy - See Background Notes. | ||||||||
| Table 18a GVA at Factor Cost (€m & %) classified by region and branch, 2002 to 2009 | ||||||||
| Region | Agriculture, Forestry and Fishing | Manufacturing, Building and Construction | Market and Non Market Services | Total GVA1 | ||||
| 2002 | ||||||||
| €m | % | €m | % | €m | % | €m | % | |
| Border, Midland and Western | 1,356 | 6.3 | 8,171 | 38.3 | 11,832 | 55.4 | 21,712 | 100 |
| Border | 594 | 6.4 | 3,921 | 42.5 | 4,717 | 51.1 | 9,384 | 100 |
| Midland | 285 | 6.8 | 1,340 | 31.8 | 2,585 | 61.4 | 4,280 | 100 |
| West | 477 | 6.0 | 2,910 | 36.8 | 4,531 | 57.2 | 8,048 | 100 |
| Southern and Eastern | 2,127 | 2.3 | 36,274 | 38.4 | 55,953 | 59.3 | 95,933 | 100 |
| Dublin | 95 | 0.2 | 9,212 | 21.4 | 33,795 | 78.4 | 43,826 | 100 |
| Mid East | 342 | 3.4 | 4,931 | 49.3 | 4,734 | 47.3 | 10,175 | 100 |
| Dublin plus Mid East | 438 | 0.8 | 14,143 | 26.6 | 38,530 | 72.5 | 54,001 | 100 |
| Mid West | 381 | 5.3 | 2,270 | 31.5 | 4,551 | 63.2 | 7,322 | 100 |
| South East | 596 | 5.4 | 5,640 | 50.8 | 4,866 | 43.8 | 11,288 | 100 |
| South West | 712 | 3.1 | 14,222 | 62.0 | 8,006 | 34.9 | 23,323 | 100 |
| State | 3,483 | 3.0 | 44,445 | 38.4 | 67,785 | 58.6 | 117,646 | 100 |
| 2003 | ||||||||
| €m | % | €m | % | €m | % | €m | % | |
| Border, Midland and Western | 1,275 | 5.6 | 7,826 | 34.1 | 13,879 | 60.4 | 23,329 | 100 |
| Border | 558 | 5.7 | 3,645 | 37.5 | 5,512 | 56.7 | 9,863 | 100 |
| Midland | 274 | 5.5 | 1,614 | 32.6 | 3,057 | 61.8 | 5,021 | 100 |
| West | 444 | 5.3 | 2,566 | 30.8 | 5,309 | 63.8 | 8,445 | 100 |
| Southern and Eastern | 2,020 | 2.0 | 35,590 | 35.1 | 63,664 | 62.9 | 102,824 | 100 |
| Dublin | 88 | 0.2 | 8,593 | 18.2 | 38,541 | 81.6 | 47,945 | 100 |
| Mid East | 329 | 3.2 | 4,535 | 44.3 | 5,370 | 52.5 | 10,390 | 100 |
| Dublin plus Mid East | 417 | 0.7 | 13,128 | 22.8 | 43,910 | 76.4 | 58,335 | 100 |
| Mid West | 350 | 3.9 | 3,613 | 39.9 | 5,083 | 56.2 | 9,184 | 100 |
| South East | 575 | 5.0 | 5,336 | 46.4 | 5,589 | 48.6 | 11,675 | 100 |
| South West | 677 | 2.9 | 13,514 | 58.1 | 9,082 | 39.0 | 23,629 | 100 |
| State | 3,295 | 2.7 | 43,416 | 34.9 | 77,543 | 62.4 | 126,152 | 100 |
| 2004 | ||||||||
| €m | % | €m | % | €m | % | €m | % | |
| Border, Midland and Western | 1,353 | 5.3 | 8,886 | 34.9 | 15,215 | 59.8 | 25,858 | 100 |
| Border | 569 | 5.4 | 3,841 | 36.4 | 6,145 | 58.2 | 10,723 | 100 |
| Midland | 306 | 5.7 | 1,738 | 32.5 | 3,297 | 61.7 | 5,426 | 100 |
| West | 477 | 5.0 | 3,307 | 34.6 | 5,773 | 60.4 | 9,708 | 100 |
| Southern and Eastern | 2,142 | 2.0 | 35,052 | 33.1 | 68,780 | 64.9 | 107,673 | 100 |
| Dublin | 90 | 0.2 | 9,444 | 18.5 | 41,585 | 81.3 | 51,941 | 100 |
| Mid East | 342 | 3.0 | 5,001 | 44.2 | 5,970 | 52.8 | 11,494 | 100 |
| Dublin plus Mid East | 432 | 0.7 | 14,446 | 23.1 | 47,555 | 76.2 | 63,435 | 100 |
| Mid West | 393 | 4.1 | 3,854 | 39.7 | 5,450 | 56.2 | 9,851 | 100 |
| South East | 619 | 5.4 | 4,898 | 42.6 | 5,986 | 52.0 | 11,687 | 100 |
| South West | 698 | 3.1 | 11,855 | 53.1 | 9,788 | 43.8 | 22,700 | 100 |
| State | 3,495 | 2.7 | 43,938 | 33.4 | 83,994 | 63.9 | 133,531 | 100 |
| 2005 | ||||||||
| €m | % | €m | % | €m | % | €m | % | |
| Border, Midland and Western | 1,543 | 5.6 | 9,373 | 34.2 | 16,483 | 60.2 | 27,618 | 100 |
| Border | 641 | 5.7 | 3,922 | 35.1 | 6,600 | 59.1 | 11,253 | 100 |
| Midland | 330 | 5.6 | 1,918 | 32.7 | 3,609 | 61.6 | 5,904 | 100 |
| West | 572 | 5.5 | 3,532 | 34.0 | 6,275 | 60.5 | 10,462 | 100 |
| Southern and Eastern | 2,343 | 2.0 | 36,369 | 31.4 | 77,128 | 66.6 | 116,786 | 100 |
| Dublin | 84 | 0.1 | 10,521 | 18.4 | 46,590 | 81.5 | 57,665 | 100 |
| Mid East | 356 | 2.9 | 5,187 | 42.1 | 6,776 | 55.0 | 12,420 | 100 |
| Dublin plus Mid East | 440 | 0.6 | 15,708 | 22.6 | 53,366 | 76.8 | 70,085 | 100 |
| Mid West | 519 | 4.9 | 4,149 | 38.8 | 6,029 | 56.4 | 10,783 | 100 |
| South East | 618 | 5.3 | 4,325 | 37.2 | 6,685 | 57.5 | 11,721 | 100 |
| South West | 766 | 3.2 | 12,187 | 50.8 | 11,048 | 46.0 | 24,196 | 100 |
| State | 3,887 | 2.7 | 45,742 | 31.9 | 93,611 | 65.4 | 144,404 | 100 |
| 2006 | ||||||||
| €m | % | €m | % | €m | % | €m | % | |
| Border, Midland and Western | 1,366 | 4.5 | 11,186 | 36.6 | 18,004 | 58.9 | 30,506 | 100 |
| Border | 578 | 4.6 | 4,837 | 38.4 | 7,197 | 57.1 | 12,591 | 100 |
| Midland | 298 | 4.4 | 2,490 | 36.9 | 3,961 | 58.7 | 6,737 | 100 |
| West | 490 | 4.4 | 3,859 | 34.5 | 6,846 | 61.2 | 11,177 | 100 |
| Southern and Eastern | 2,215 | 1.8 | 38,965 | 31.1 | 84,257 | 67.2 | 125,223 | 100 |
| Dublin | 84 | 0.1 | 10,335 | 17.0 | 50,459 | 82.9 | 60,774 | 100 |
| Mid East | 338 | 2.4 | 6,205 | 43.6 | 7,687 | 54.0 | 14,206 | 100 |
| Dublin plus Mid East | 422 | 0.6 | 16,540 | 22.0 | 58,147 | 77.4 | 74,980 | 100 |
| Mid West | 436 | 3.8 | 4,485 | 39.0 | 6,586 | 57.2 | 11,487 | 100 |
| South East | 644 | 5.1 | 4,492 | 35.7 | 7,454 | 59.2 | 12,570 | 100 |
| South West | 712 | 2.7 | 13,448 | 51.3 | 12,070 | 46.0 | 26,186 | 100 |
| State | 3,581 | 2.3 | 50,151 | 32.1 | 102,261 | 65.6 | 155,728 | 100 |
| 2007 | ||||||||
| €m | % | €m | % | €m | % | €m | % | |
| Border, Midland and Western | 1,392 | 4.4 | 10,688 | 33.8 | 19,578 | 61.8 | 31,371 | 100 |
| Border | 601 | 4.6 | 4,608 | 35.3 | 7,829 | 60.0 | 12,919 | 100 |
| Midland | 301 | 4.4 | 2,208 | 32.4 | 4,307 | 63.2 | 6,754 | 100 |
| West | 490 | 4.2 | 3,872 | 32.8 | 7,442 | 63.0 | 11,698 | 100 |
| Southern and Eastern | 2,515 | 1.8 | 41,213 | 30.0 | 93,478 | 68.1 | 135,934 | 100 |
| Dublin | 93 | 0.1 | 9,785 | 14.9 | 56,009 | 85.0 | 65,273 | 100 |
| Mid East | 365 | 2.3 | 6,663 | 42.2 | 8,777 | 55.5 | 15,659 | 100 |
| Dublin plus Mid East | 458 | 0.6 | 16,447 | 20.1 | 64,786 | 79.3 | 80,932 | 100 |
| Mid West | 449 | 3.6 | 4,892 | 39.1 | 7,166 | 57.3 | 12,391 | 100 |
| South East | 759 | 5.4 | 5,044 | 35.8 | 8,286 | 58.8 | 13,961 | 100 |
| South West | 849 | 2.9 | 14,829 | 51.3 | 13,240 | 45.8 | 28,651 | 100 |
| State | 3,907 | 2.3 | 51,901 | 30.7 | 113,056 | 67.0 | 167,306 | 100 |
| 2008 | ||||||||
| €m | % | €m | % | €m | % | €m | % | |
| Border, Midland and Western | 1,257 | 4.1 | 9,981 | 32.6 | 19,346 | 63.3 | 30,560 | 100 |
| Border | 515 | 4.1 | 4,366 | 34.8 | 7,670 | 61.1 | 12,542 | 100 |
| Midland | 274 | 4.4 | 1,766 | 28.1 | 4,251 | 67.6 | 6,286 | 100 |
| West | 468 | 4.0 | 3,848 | 32.8 | 7,425 | 63.2 | 11,732 | 100 |
| Southern and Eastern | 2,291 | 1.8 | 35,167 | 26.9 | 93,161 | 71.3 | 130,518 | 100 |
| Dublin | 89 | 0.1 | 9,227 | 14.2 | 55,528 | 85.6 | 64,794 | 100 |
| Mid East | 320 | 2.2 | 5,478 | 37.7 | 8,739 | 60.1 | 14,527 | 100 |
| Dublin plus Mid East | 409 | 0.5 | 14,705 | 18.5 | 64,268 | 81.0 | 79,321 | 100 |
| Mid West | 394 | 3.4 | 3,922 | 34.1 | 7,184 | 62.5 | 11,491 | 100 |
| South East | 702 | 5.1 | 4,515 | 33.1 | 8,423 | 61.8 | 13,629 | 100 |
| South West | 786 | 3.0 | 12,026 | 46.1 | 13,286 | 50.9 | 26,077 | 100 |
| State | 3,547 | 2.2 | 45,148 | 28.0 | 112,507 | 69.8 | 161,078 | 100 |
| 2009 | ||||||||
| €m | % | €m | % | €m | % | €m | % | |
| Border, Midland and Western | 1,109 | 4.0 | 7,872 | 28.4 | 18,703 | 67.6 | 27,859 | 100 |
| Border | 470 | 4.1 | 3,691 | 32.0 | 7,369 | 63.9 | 11,604 | 100 |
| Midland | 226 | 4.1 | 1,178 | 21.5 | 4,084 | 74.4 | 5,523 | 100 |
| West | 412 | 3.9 | 3,003 | 28.2 | 7,250 | 68.0 | 10,732 | 100 |
| Southern and Eastern | 1,800 | 1.5 | 31,826 | 26.9 | 84,809 | 71.6 | 119,199 | 100 |
| Dublin | 83 | 0.1 | 9,011 | 15.2 | 50,106 | 84.6 | 59,583 | 100 |
| Mid East | 271 | 2.2 | 4,215 | 33.7 | 8,012 | 64.1 | 12,579 | 100 |
| Dublin plus Mid East | 354 | 0.5 | 13,226 | 18.4 | 58,118 | 81.1 | 72,162 | 100 |
| Mid West | 305 | 2.9 | 3,397 | 32.6 | 6,726 | 64.5 | 10,494 | 100 |
| South East | 547 | 4.9 | 2,997 | 26.7 | 7,672 | 68.4 | 11,287 | 100 |
| South West | 594 | 2.4 | 12,207 | 48.6 | 12,293 | 49.0 | 25,257 | 100 |
| State | 2,909 | 2.0 | 39,698 | 27.2 | 103,512 | 70.8 | 147,058 | 100 |
| 1 Total GVA does not equal the sum of the three sectors shown due to the effect of the Statistical Discrepancy - See Background Notes. | ||||||||
Introduction
Household income data were first published in 2000 (Household Incomes Regions and Counties 1991-1997 – Pn 8218) and the publication included a detailed description of the methodology used to estimate the regional values of the income components. Since then, results have been issued on an annual basis.
Regional accounts were first published in 1996 (Regional Accounts 1991 – Pn 3232). They were in respect of 1991 and a full description of the methodology used was included. A further set of accounts in respect of 1993 was published in 1997 with some additional methodological details. Results have been published annually since.
Revisions
Revisions to national accounts data published in National Income and Expenditure 2012 have been carried through into these tables, as is the usual practice.
NACE
Tables15 to 18a provide GVA for the regions broken down into three main sectors of the economy. In former releases these sectors were defined as in the publication “National Income and Expenditure 20XX” (NIE 20XX) and corresponded with the national classification system of industries used in National Accounts at the time. Since the 2009 release (as linked to NIE 2010) the sectors have been revised to correspond with the NACE Rev.2 classification system. The main effect of the NACE Rev.2 (re)classification, on the three sectors distinguished in tables 15 to 18a, is that the Publishing Industry (including the publishing of software) has been reclassified from the Manufacturing sector to the Services sector. This results in the Services sector accounting for a larger proportion of total GVA compared to former releases. Similarly, the Manufacturing sector accounts for a smaller proportion of GVA than in former releases.
The more significant aggregates in all tables in these accounts (e.g. gross value added, compensation of employees) are compiled internally according to the NACE classification system. Again the NACE Rev.2 system has been used compared to the NACE Rev.1 system in earlier releases. The retrospective data for the years 2002 to 2009 have also been recalculated using NACE Rev.2. This inevitably gives rise to some revisions to the retrospective series.
Household Income
Primary Income
Household Primary Income is defined for National Income purposes as follows:
Compensation of employees (i.e. Wages and Salaries, Benefits in kind,
Employers’ social insurance contributions)
plus
Income of self-employed
plus
Rent of dwellings (including imputed rent of owner-occupied dwellings)
plus
Net interest and dividends
The last component is a net item, which implies that payments by households of interest are deducted in deriving primary income.
Total Income
Total income is defined as:
Primary income
plus
Social benefits
plus
Other current transfers
Disposable Income
Disposable income is defined as follows:
Total income
minus
Current taxes on income (i.e. Income taxes, other current taxes)
minus
Social insurance contributions (i.e. Employers’, employees’, self-employed, etc.)
National Income
The estimates for the State for the different components of household income have already been published in the National Income and Expenditure Report 2012 (NIE 2012). The other current transfer payments to and from households are included in this household income report on a net basis with social benefits.
| Item | 2011 Value | Source (NIE 2012) |
| €M | ||
| Primary Income | ||
| Income of Self-Employed | 9,562 | Items 1 & 5, Table 1 |
| Rent of Private Property Dwellings (incl. imputed rent) | 6,266 | Row 11, Table 12 |
| Renumeration of Employees | 68,780 |
Items 2,3,9 & 10, Table 1 plus Row 4, Table 12 |
| Net Interest and Dividends | 1,282 | Rows 9,10,12 & 13, Table 12 |
| Social Benefits and net current transfers |
25,279 |
Item 122, Table 9 |
| Statistical Discrepancy |
-1,144 |
Item 12, table 1 |
| Total Income | 110,026 | Item 125, table 9 |
| Taxes on Personal and Income and Wealth | ||
| Income tax (incl Universal Charge Income Levy) |
14,009 |
Table 22 |
| Motor Vehicle duties (household part) | 556 | Table 22 |
|
Other taxes |
184 | Table 22 |
| Training and employment levy | 317 | Table 22 |
| Socail Insurance Contribution | 7,532 | Item 168, Table 19 |
| Total Taxes on Income | 22,598 | Item 127, Table 9 |
Per Capita Incomes
The CSO publishes population estimates at regional level annually but not at county level. County populations for 2002 to 2011 have been estimated in this report by applying the year to year changes at regional level, shown in the revised regional population figures which were compiled following the publication of the 2006 and the 2011 Censuses, to the counties within the regions. The population figures for 2006 and 2011 have been taken directly from the 2006 and 2011 Censuses.
Statistical Discrepancy
The official level of GDP is taken to be the average of the independently compiled Income and Expenditure estimates. The resulting balancing item, which is half of the difference between the two estimates, is called the Statistical Discrepancy. This must be added to the income components in tables 1 and 2 to derive Total Household Income.
GDP by Region
Gross Value Added
Gross Value Added (GVA) at basic prices is a measure of the value of the final goods and services produced in a region (less the materials and services used which come from outside the region) priced at the value which the producers received minus any taxes payable and plus any subsidies receivable as a consequence of their production or sale. GVA differs from household income in three main respects.
(Note: GDP and GVA are the same concept i.e. they measure the value of the goods and services (or part thereof) which are produced within a region or country. GDP is valued at market prices and hence includes taxes charged and excludes the value of subsidies provided. GVA at basic prices on the other hand excludes product taxes and includes product subsidies – see table 14).
Value added is firstly calculated at factor cost, which includesall subsidies and excludes all taxes. Conversion to a valuation at basic prices is achieved by subtracting overhead subsidies and adding overhead taxes. Conversion to market prices is then obtained by subtracting product subsidies and adding product taxes (see table 14). Most of the tables in this report on GVA are based on GVA at basic prices. However tables 15a to 18a are based on GVA at factor cost. The results in this release are based on the ESA95 system of accounts which is now in use throughout the European Union. Results provided in earlier releases (up to GDP by region 1997) were based on the ESA79 system of accounts. GVA is one of the principal concepts used in deciding eligibility for structural funds within the EU.
EU Averages
The indices of GVA per person in relation to the EU27=100 for years 2002 to 2011, shown in table 11, are based on the relevant position of Ireland as given on the Eurostat website.
Regions
The regional classifications in this release are based on the NUTS (Nomenclature of Territorial Units) classification used by Eurostat. The regions for which the accounts have been compiled are the eight Regional Authority NUTS3 regions. The Mid East region (Kildare, Meath and Wicklow) and the Dublin region are affected by a substantial proportion of their workforce living in one region and commuting to work in another. It is therefore more meaningful to combine these two regions. The definition of the regions is outlined below. Figures have also been shown for the two overall NUTS2 regions i.e. “Border, Midland and Western” region and “Southern and Eastern” region.
Composition of Regions
Border, Midland and Western NUTS 2 Region
Border Cavan, Donegal, Leitrim, Louth, Monaghan and Sligo
Midland Laois, Longford, Offaly and Westmeath
West Galway County, Galway City, Mayo and Roscommon
Southern and Eastern NUTS 2 Region
Dublin Dublin City, Dun Laoghaire-Rathdown, Fingal and South Dublin
Mid East Kildare, Meath and Wicklow
Mid West Limerick County, Limerick City, Clare and North Tipperary
South East Waterford County, Waterford City, Carlow, Kilkenny, Wexford and South Tipperary
South West Cork County, Cork City and Kerry
 Hide Background Notes
Scan the QR code below to view this release online or go to
http://www.cso.ie/en/releasesandpublications/er/cirgdp/countyincomesandregionalgdp2011/
 Show Table 1 Estimates of Primary, Total & Disposable Household Income by Region & County in 2011
 Hide Table 1 Estimates of Primary, Total & Disposable Household Income by Region & County in 2011