
| Census of Industrial Production - Local Units 2011 | |||||||||||
| Border | Dublin | Mid-East | Midland | Mid-West | South-East | South-West | West | State | |||
| Nationality of Ownership | |||||||||||
| Gross Output (€m) | Irish | 3,608 | 2,773 | 2,375 | 1,657 | 1,625 | 3,788 | 5,492 | 2,473 | 27,466 | |
| Foreign | 1,908 | 16,387 | 5,112 | 1,087 | 4,996 | 5,972 | 31,198 | 7,170 | 73,830 | ||
| Number of persons engaged | Irish | 15,746 | 18,788 | 10,795 | 7,797 | 8,746 | 13,407 | 14,793 | 10,720 | 107,655 | |
| Foreign | 6,077 | 12,138 | 9,884 | 3,172 | 9,778 | 9,944 | 18,693 | 12,228 | 81,914 | ||
| Size Class of Unit | |||||||||||
| Gross Output (€m) | Small & medium | 4,045 | 8,814 | 3,237 | 2,145 | 2,042 | 3,291 | 13,888 | 2,008 | 39,471 | |
| Large | 1,471 | 10,345 | 4,250 | 599 | 4,580 | 6,468 | 22,802 | 7,635 | 61,825 | ||
| Number of persons engaged | Small & medium | 16,835 | 21,236 | 11,358 | 7,288 | 10,173 | 13,060 | 17,227 | 11,085 | 108,262 | |
| Large | 4,988 | 9,690 | 9,321 | 3,681 | 8,351 | 10,291 | 16,259 | 11,863 | 81,307 | ||
| % Gross output exported | 57.2% | 82.5% | 73.8% | 54.5% | 83.4% | 76.9% | 83.6% | 75.6% | 76.2% | ||
| Wages and salaries (€m) | 701 | 1,383 | 896 | 374 | 793 | 897 | 1,501 | 826 | 7,878 | ||
| Small and medium local units employ 249 persons or less while large units employ 250 or more. Number of persons engaged refers to actual number of persons and not full-time equivalents. State totals include units not attributable to size class or region. Foreign nationality of ownership refers to all countries excluding Ireland. | |||||||||||
In Ireland in 2011 the South-West region accounted for 36.2% or €36.7 billion of Irish industrial output. Dublin as a region produced 18.9% or €19.2 billion worth of industrial gross output in 2011. In contrast to these two regions, the Midland region produced €2.7 billion or 2.7% of the total industrial output produced in Ireland in 2011.
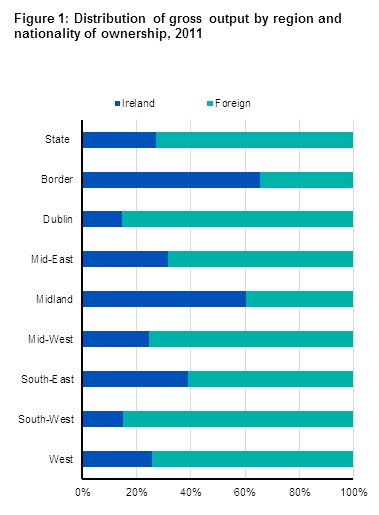
Irish owned units in Dublin and the South-West region each accounted for 15% of industrial gross output in those regions in 2011
Dublin as a region had the lowest proportion of gross output for Irish owned industrial units in 2011 at 14.5%. The South-West region had a similar figure of 15.0%.
The Border and Midland regions both had in excess of 60% of total gross industrial output coming from Irish owned units. The Border region had the highest rate at 65.4%, while the Midland region was the next highest at 60.4%.
For the State as a whole 27.1% of total gross output of industrial units in Ireland in 2011 was produced by Irish owned units. See Figure 1.
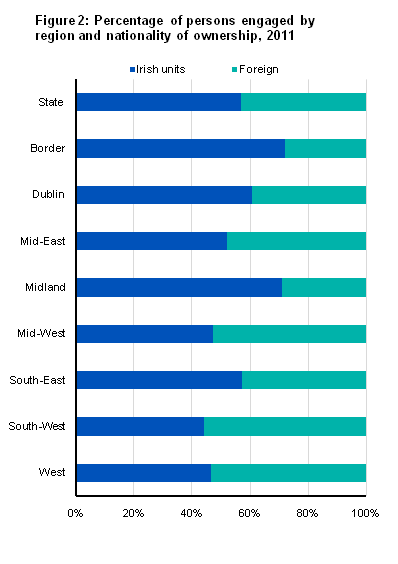
South-West, West and Mid-West regions had more persons engaged in foreign owned industrial units than Irish owned in 2011
The South-West, West and Mid-West regions all had more persons engaged in foreign owned industrial units than Irish owned units in 2011. The South-West region had 55.8% or 18,700 persons engaged in foreign owned units, while the West region had 53.3% or 12,200 persons engaged.
The Border region had the highest proportion of persons engaged in Irish owned industrial units in 2011 at 72.2%. In the Border region there was 15,700 persons engaged in Irish owned industrial units compared to 6,100 persons engaged in foreign owned industrial units. The Midland region, which had the lowest number of persons engaged in industrial activity in 2011 at 11,000, had 71.1% or 7,800 persons engaged in Irish owned units and 28.9% or 3,200 persons engaged in foreign owned units.
In 2011 in Ireland 81,900 of all persons engaged in industrial units were employed in foreign owned units, which represented over 43.2% of the total number of persons engaged in industrial activity. See Figure 2.
7% of persons employed in Dublin in 2011 worked in the industry sector
According to the Quarterly National Household Survey (QNHS) results in 2011, just 7.4% or 40,200 persons in Dublin worked in the industry sector. There were 543,500 persons in employment in Dublin in 2011. The Mid-East region had the next lowest rate for percentage of persons employed working in Industry at 12.6% or 28,500 persons.
The Mid-West region had the highest rate at 17.5% of all persons employed working in the industrial sector in 2011. Both the West and the South-East regions had 16.1% of their employment in the industrial sector while the South-West region had the fourth highest regional industrial employment rate in 2011 at 15.5%.
For the state as a whole, the total number of persons employed in Ireland in 2011 was estimated at 1,845,600 persons. Of this, 12.9% or 238,900 persons were employed in industrial activity. See Figure 3.
Source QNHS
| X-axis label | % Labour Force in Industry |
|---|---|
| State | 12.9 |
| Border | 14.9 |
| Dublin | 7.4 |
| Mid-East | 12.6 |
| Midland | 15 |
| Mid-West | 17.5 |
| South-East | 16.1 |
| South-West | 15.5 |
| West | 16.1 |
Wages per person in industry highest in the South-West region at €44,800 in 2011
Wages and salaries per person engaged in the Industry sector in Ireland in 2011 was highest in the South-West region at €44,800, while the Dublin region was next highest at €44,700.
The Border region reported the lowest average wage per person in Industry in 2011 at €32,100. The Midland region had the next lowest at €34,100.
Almost €7.9 billion was spent on wages and salaries by industrial units in Ireland in 2011. The South-West region had the highest total spend at €1.5 billion while the Dublin region spent €1.4 billion. The Midland region reported the lowest total spend on wages and salaries by industrial units in 2011 at €374 million. See Figure 4.
| X-axis label | Wages and salaries per person |
|---|---|
| State | 41556 |
| Border | 32142 |
| Dublin | 44713 |
| Mid-East | 43322 |
| Midland | 34055 |
| Mid-West | 42823 |
| South-East | 38405 |
| South-West | 44836 |
| West | 35998 |
79% of gross industrial output in the Western region in 2011 came from large sized units
Large sized units (employing 250 or more persons) based in the Western region accounted for 79.2% of total industrial gross output in that region in 2011. This region produced industrial gross output of €9.6 billion of which €7.6 billion was produced by large units and €2 billion produced by small and medium sized units.
All regions, with the exception of the Midland and Border regions, saw the majority of industrial gross output derived from large units in 2011. The Midland region had the highest percentage of industrial gross output for small and medium sized units in Ireland in 2011 at 78.2%. The Midland region produced €2.7 billion of industrial output in 2011 of which €2.1 billion was produced by small and medium sized units, while the remaining €600 million was produced by large sized units.
In the Border region small and medium sized units accounted for 73.3% of all industrial gross output compared to a figure of 46% for the Dublin region.
Of the €101 billion total industrial gross output for Ireland in 2011, 61% was generated by large sized units while small and medium sized units were responsible for the remaining 39%. See Figure 5.
| Small and medium (under 250) | Large (250+) | |
| Border | 4046000000 | 1471000000 |
| Dublin | 8814000000 | 10345000000 |
| Mid-East | 3237000000 | 4250000000 |
| Midland | 2145000000 | 599000000 |
| Mid-West | 2042000000 | 4580000000 |
| South-East | 3291000000 | 6468000000 |
| South-West | 13888000000 | 22802000000 |
| West | 2008000000 | 7635000000 |
57% of total industrial employment, or 108,300 Persons, were engaged by small and medium industrial units in Ireland in 2011
In 2011, there were 108,300 persons engaged in small and medium industrial units in Ireland. The Border region had the greatest proportion of persons engaged in small and medium sized industrial units at 16,800 or 77.1% of all such persons, while the remaining 22.9% were employed by large units.
The Dublin region had the highest number of persons engaged in small and medium sized industrial units at 21,200. The West region had the smallest proportion of persons engaged in small and medium sized industrial units at 11,100 or 48.3% of all such persons in that region.
For large industrial units the South-West region had the highest number of persons engaged in 2011 at 16,300. The Midland region had the lowest number of person engaged in large industrial units at just 3,700. In total, 81,300 persons were engaged in large industrial units in Ireland in 2011.
The West was the only region in Ireland in 2011 that had more persons engaged in large industrial units at 11,900, compared to small and medium units who had a total of 11,100 persons engaged. See Figure 6.
| X-axis label | Small and medium (under 250) | Large (250+) |
|---|---|---|
| Border | 16835 | 4988 |
| Dublin | 21236 | 9690 |
| Mid-East | 11358 | 9321 |
| Midland | 7288 | 3681 |
| Mid-West | 10173 | 8351 |
| South-East | 13060 | 10291 |
| South-West | 17227 | 16259 |
| West | 11085 | 11863 |
Number of persons engaged in manufacturing units who didn’t export fell 27% between 2008 and 2011
Between 2008 and 2011 the number of persons engaged in manufacturing units who exported at least some of their output fell by 9.6%, whereas manufacturing units who didn’t export any output experienced a fall of 26.8% in the number of persons engaged.
Between 2008 and 2011 of the regions, the South-East region experienced the smallest percentage change in the number of persons engaged in exporting manufacturing units, down 0.2%, whereas for non-exporting manufacturing units the total number of persons engaged in this region fell by 43.7%.
Between 2008 and 2011 all regions in Ireland experienced a decrease in the number of persons engaged in non-exporting manufacturing units, however, the percentage fall was less severe in all regions for exporting manufacturing units. Indeed both the West and the South-West regions had an increase in the number of persons engaged in manufacturing units who exported in 2011 compared to 2008, with the West region increasing 6.7% and the South-West region increasing 1.2%. See Figure 7.
| X-axis label | Exporting 2008 | Exporting 2011 | Non-Exporting 2008 | Non-Exporting 2011 |
|---|---|---|---|---|
| Border | 20171 | 18571 | 4391 | 3252 |
| Dublin | 28107 | 21954 | 11920 | 8972 |
| Mid-East | 19165 | 16966 | 5244 | 3713 |
| Midland | 9585 | 7757 | 4019 | 3212 |
| Mid-West | 20153 | 15077 | 4896 | 3447 |
| South-East | 19283 | 19242 | 7295 | 4109 |
| South-West | 26818 | 27151 | 7878 | 6335 |
| West | 17119 | 18271 | 5915 | 4677 |
Cork had €1.18 million and Carlow €143,000 worth of industrial gross output per person in 2011
In 2011, County Cork had the highest value of gross output per person engaged in Ireland at €1.18 million. Mayo and Roscommon combined was the next highest at €0.78 million, while County Dublin was third in the rankings with €0.62 million per person.
The three counties with the lowest value of gross output per person engaged were Carlow at €143,000, Offaly at €178,000 and Louth at €185,000. More county level information can be found at StatBank on the CSO website. See Figure 8.
| County | Gross output |
|---|---|
| Carlow | 143176.747555234 |
| Cavan | 350511.377741001 |
| Clare | 223974.276527331 |
| Cork | 1178531.49793178 |
| Donegal | 204141.387612169 |
| Dublin | 619539.643018819 |
| Galway | 224188.888143327 |
| Kerry | 483544.338677355 |
| Kildare | 430935.127055306 |
| Kilkenny | 449569.967456997 |
| Laois | 202784.59237098 |
| Leitrim | 205786.970010341 |
| Limerick | 480931.41470945 |
| Longford | 351552.580331061 |
| Louth | 184773.802050638 |
| Mayo/Roscommon | 783334.3691734 |
| Meath | 258888.468809074 |
| Monaghan | 304814.874696847 |
| Offaly | 177935.643564356 |
| Sligo | 228161.660479244 |
| Tipperary | 495371.586549312 |
| Waterford | 458017.188693659 |
| Westmeath | 291767.100056529 |
| Wexford | 255546.21370279 |
| Wicklow | 343240.621761658 |
Introduction
The Census of Industrial Production comprises two separate but closely related annual inquiries, namely:
(i) the Census of Industrial Enterprises covers those enterprises which are wholly or primarily engaged in industrial production and have three or more persons engaged; published 8 August, 2013.
(ii) the Census of Industrial Local Units which covers all industrial local units with three or more persons engaged; published 19 September, 2013.
The Census of Industrial Production is required under Council Regulation (EC, Euratom) No 58/97. The 2011 census was taken in accordance with SI 78/2008.
NACE refers to the classification NACE Revision 2 which is the European Union’s Statistical Classification of Economic Activity in the European communities
For further information on the NACE Rev. 2 classification of industrial activity, visit the CSO website:
http://www.cso.ie/en/surveysandmethodology/classifications/
An enterprise is defined as the smallest combination of legal units that is an organisational unit producing goods or services, which benefits from a certain degree of autonomy in decision making, especially for the allocation of its current resources. A local unit is defined as an enterprise or part thereof situated in a geographically identified place.
Appreciation is extended to firms that co-operate in this annual census. The information they provide is treated as strictly confidential to the Central Statistics Office. Direct or indirect disclosure of information relating to individual respondents is avoided in the publication of results by combining categories containing small numbers of units and suppressing figures, etc. This factor also limits the degree of cross-classification that is possible in presenting results.
Presentation of Results
All tables are available on the Central Statistics Office website, please see:
Enterprises Industrial = Click here
Enterprises Manufacturing = Click here
Local Units Industrial
Local Units Manufacturing
Period Covered by the Census
Although the census relates in principle to the calendar year, respondents are permitted to return figures for their nearest accounting year. The end of the accounting year for all returns used falls between May of the reference year and April of the following year. Returns which cover a period of less than 12 months are accepted in cases where businesses have started or ceased trading during the year.
All employment details in the 2011 census relate to the week ending 9 September 2011. Concerns that had no persons engaged in this week (e.g. ceased operations earlier in the year or started production later in the year) were classified as having zero employment. In tables which analyse local units in terms of persons engaged, these are included in the lowest size class, e.g. less than ten persons engaged.
Data Collection
The census is conducted by post. A permanent up-to-date register is kept of all relevant local units and enterprises known to be involved in industrial production. The register is maintained from the Central Business Register, administrative and public utility records, announcements in the press, business journals, field personnel contacts, etc. This register is constantly being updated. This results in differing estimates for the total number of enterprises/local units through the dissemination cycle.
An ‘enterprise’ questionnaire is sent to all enterprises whose activity is primarily industrial. The type of ‘enterprise’ questionnaire depends on the size of the enterprise. The most detailed form (form F) is generally sent to all enterprises with twenty or more persons engaged. A less detailed form (form C) is sent to enterprises with between three and twenty persons engaged. In previous years the cut-off point was thirteen persons engaged. In the case of multi-location enterprises, a ‘local unit’ questionnaire is sent to each local unit with three or more persons engaged which was in production during the year. For the majority of local units, this questionnaire is the standard form L. In a small number of exceptional cases, a single form L is issued to cover several local units operated by the same enterprise - see Scope of the Local Unit Census below.
All forms are available on CSO’s website at:
http://www.cso.ie/en/surveysandmethodology/industry/
In relation to local units involved in NACE Division 36 (Water collection, treatment and supply) a W form is used. This reflects the difference in activity type of these firms.
All returns are scrutinised clerically for internal accuracy. They are compared with returns for previous years and in some instances with returns to other industrial inquiries. Local unit and enterprise returns relating to the same enterprise are examined together for consistency. A further set of consistency checks is carried out in the computer processing of the data. Substantial queries arising from these scrutiny operations are referred to the respondent by telephone, in writing or via a field officer.
Industrial Activity Classification and Statistical Units
The 2011 results are classified by NACE Revision 2, which was first introduced for the year 2008. A correlation table showing the relationship between headings of the old and new classifications is available on request. Each 4 digit class in NACE Revision 2 relates to a specific form of economic activity, eg manufacture of basic pharmaceuticals products (NACE 2110). The statistical units in the census (local unit and enterprise) are coded to the NACE class relating to their principal industrial activity during the census year. In the case of local units, this is determined on the basis of detailed information provided on their production of individual products. The activity classification of enterprises is based on the NACE codes of the constituent local units. An enterprise that operates several industrial local units coded to different NACE classes is classified to the activity which accounts for the highest proportion of the total value added of the enterprise.
The scope of the census extends to NACE sections B, C, D and E, namely:
Section B: Mining and quarrying
Section C: Manufacturing
Section D: Electricity, gas, steam and air conditioning supply
Section E: Water supply; sewerage, waste management and remediation activities
The traditional category Transportable Goods Industries used in industrial statistics is equivalent to NACE sections B and C. The Manufacturing Industries grouping includes only section C.
Classification by Nationality of Ownership
The classification is determined by the nationality of the owners of 50 per cent or more of the share capital. The breakdown which can be provided at sectoral level is in many cases constrained by the need to preserve the confidentiality of data provided by individual units. For total manufacturing industry, however, a more detailed nationality classification is possible.
Export Performance and the Purchase of Imported Materials
Details are provided on value of output of industrial local units which was exported and the proportion of materials purchased which were imported. The proportions of exports destined for four major markets are also given. These results are presented classified by major industrial sectors, NUTS 2 regions classified by major industrial sector and local units classified by nationality of ownership and number of persons engaged.
These analyses are based on respondents’ replies to questions asking the value of production (or turnover) which was exported and the breakdown by destination, as well as the value of materials purchased which was imported. It must be recognised in interpreting these results that this is information that is not readily available in standard business accounts, particularly in relation to the origin of materials purchased from suppliers.
Scope and Coverage
The enterprise census covers all enterprises which have three or more persons engaged and which are wholly or principally involved in industrial production (i.e. NACE Sections B to E).
An enterprise is defined as the smallest combination of legal units that is an organisational unit producing goods or services, which benefits from a certain degree of autonomy in decision making, especially for the allocation of its current resources (e.g. company, partnership, individual proprietorship, etc.). An enterprise may be a sole legal unit. In practice, the enterprise is equivalent to a company or firm. Within a group of companies, each individual company is treated as a separate enterprise. The return for each enterprise relates to all of its activities and covers all local units operated by it, including those involved in non-industrial activity, e.g. wholesaling or retailing.
Estimation for Non-Respondents
If information for key non-respondents is available from an alternative source, for example, Monthly Production, Quarterly Statistics or Prodcom or a return for the previous year, then the record is manually estimated; otherwise a computerised imputation procedure is used. Full data for enterprises filling in the more restricted C forms is derived using a method known as ratio extension. Ratio extension involves the application of ratios between known variables to cases where only one subcomponent is known. The ratios are typically calculated at NACE class level before being applied, although some merging of NACE classes may take place in order to ensure that the ratio estimates are not based on very small populations.
Enterprise Results for 2011
In 2011 there were 5133 enterprises known to the CSO to have three or more persons engaged and to be involved wholly or primarily in industrial production (NACE Sections B, C, D and E). Their total turnover was €112,300 million and purchases of goods and services amounted to €75,008 million; total gross value added was €38,242 million. The total number of persons engaged in these enterprises (excluding outside piece-workers) in September 2011 was 188,684; labour costs in the year amounted to €9,468 million, of which wages and salaries accounted for €7,812 million.
64% of industrial turnover is classified to the following three NACE classes.
Scope and Coverage
The Census of Industrial Local Units relates to all local units engaged in industrial activity which have on average three or more persons engaged during the year. A local unit is defined as an enterprise or part thereof situated in a geographically identified place. The different geographical locations in which an enterprise conducts industrial activities are treated as separate local units. A separate return is sought for each industrial local unit. The extent to which separate returns are obtained in practice, however, depends on the availability of separate records in the business for the different local units.
If separate details are not available for multi-location enterprises then for those tables involving a classification of local units by size (e.g. number of persons engaged per local unit or gross output per local unit) or by location (county or region) the local units are classified as non-attributable.
Single local units are estimated at enterprise level while multiple local units attached to a single enterprise are estimated by using the enterprise return and apportioning accordingly relative to employment.
Coverage and Statistical Units
The results for industrial enterprises must be distinguished from the results for industrial local units. Despite the fact that, in the majority of cases, the local unit is equivalent to the enterprise, the use of two different units in the two censuses has a number of consequences which must be borne in mind when interpreting and comparing their results, namely:
Variables
The local unit census focuses on the industrial process, namely the utilisation of materials, industrial services and labour, and the value of goods produced during the year. The most important variables distinguished are, therefore, gross output, industrial input and net output. Gross output represents the selling value of goods actually produced in the year, as reported by the businesses themselves, irrespective of whether sold or put into stock. Industrial input is defined as the cost of materials, industrial services and fuel and power used in the year. Net output is gross output less industrial input.
The enterprise census, on the other hand, relates to the trading dimension, namely turnover, purchases of materials and services and labour costs during the year. One of the main variables in this census is, therefore, turnover, which represents the revenue received during the year. This can be compared with gross output by means of the derived variable production value. This variable approximates closely to the value of gross output of the industrial local units operated by the enterprises. The different treatment of excise duties and operating subsidies in the two censuses makes comparison more difficult for the small number of industries affected by these factors.
The variable in the enterprise census which approximates most closely to industrial input is intermediate consumption which is defined as the purchases of materials, industrial and non-industrial services and fuel and power less the rise (or plus the fall) during the year of stocks of materials and fuels. The main difference, therefore, is the inclusion of non-industrial services in intermediate consumption. In the enterprise census gross value added (excluding VAT) is defined as production value less intermediate consumption; this is the closest approximation to net output as distinguished in the local unit Census.
 Hide Background Notes
Scan the QR code below to view this release online or go to
http://www.cso.ie/en/releasesandpublications/er/ciprcd/censusofindustrialproduction-localunitsregionalandcountydata2011/
 Show Background Notes
 Hide Background Notes