
| € million | ||||
| Merchandise Balance | Invisibles Balance | Current Account Balance | Current Account Balance as % of GDP | |
| Q1 2018 | 27,078 | -17,527 | 9,552 | 12.4 |
| Q1 2017 | 25,032 | -19,976 | 5,056 | 7.4 |
| Year 2017 | 107,639 | -82,713 | 24,924 | 8.5 |
| Year 2016 | 106,088 | -117,460 | -11,373 | -4.2 |
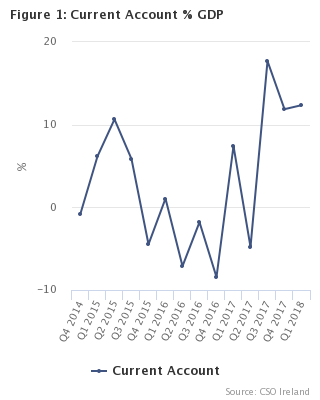
The Balance of Payments current account, a measure of Ireland’s economic flows with the rest of the world, showed a surplus of nearly €9.6bn in the first quarter of 2018. A merchandise surplus of over €27bn was partially offset by a deficit of €17.5bn on services and income. This surplus in the first quarter of 2018 followed a similar surplus of €9.4bn in the fourth quarter of 2017.
For the year 2017, the current account surplus was €25bn, an increase of €36bn on 2016, where large imports of intellectual property dominated the figures. Large globalisation effects related to goods for processing and trade in intellectual property continue to increase the Irish current account balance in 2017, similar to the pattern seen in 2015 (see Table 1).
|
This release includes the results of our annual revisions work to prior quarters, consistent with our National Accounts and other Macroeconomic publications. We have also included for the first time, new quarterly data series on goods for processing and additional detail on royalty payments for the Pharmaceutical and ICT industry. |
| X-axis label | Merchandise | Services | Primary Income | Secondary Income | Balance on Current Account |
|---|---|---|---|---|---|
| Q3 2015 | 29.755 | -7.431 | -17.792 | -0.593 | 3.939 |
| Q4 2015 | 29.955 | -16.466 | -15.558 | -0.965 | -3.035 |
| Q1 2016 | 27.29 | -14.564 | -11.001 | -1.02 | 0.705 |
| Q2 2016 | 24.44 | -16.885 | -11.342 | -0.768 | -4.555 |
| Q3 2016 | 26.315 | -12.294 | -14.425 | -0.82 | -1.224 |
| Q4 2016 | 28.043 | -19.992 | -13.144 | -1.205 | -6.299 |
| Q1 2017 | 25.032 | -5.356 | -13.684 | -0.936 | 5.056 |
| Q2 2017 | 23.545 | -9.642 | -15.647 | -1.558 | -3.303 |
| Q3 2017 | 28.915 | 0.681 | -14.829 | -1.006 | 13.76 |
| Q4 2017 | 30.147 | -4.034 | -15.613 | -1.089 | 9.411 |
| Q1 2018 | 27.078 | -1.25 | -14.971 | -1.306 | 9.552 |
Other points of note in the Quarter 1 2018 results are:
| X-axis label | Direct Investment | Portfolio Investment | Other Investment | Reserve Assets | Balance on Financial Account |
|---|---|---|---|---|---|
| Q4 2015 | -90.174 | -11.856 | 97.039 | 0.103 | -4.889 |
| Q1 2016 | 12.279 | -7.497 | 1.42 | 1.095 | 7.297 |
| Q2 2016 | -0.293 | 2.933 | -14.069 | -0.224 | -11.653 |
| Q3 2016 | -10.522 | 10.385 | -7.662 | 0.379 | -7.42 |
| Q4 2016 | -9.894 | 21.89 | -8.762 | 0.206 | 3.441 |
| Q1 2017 | -4.669 | -13.224 | -1.406 | -0.101 | -19.4 |
| Q2 2017 | 4.186 | -45.62 | 37.482 | 0.163 | -3.789 |
| Q3 2017 | 4.069 | 0.598 | 6.773 | 0.235 | 11.675 |
| Q4 2017 | -37.167 | 2.931 | 50.327 | 0.102 | 16.192 |
| Q1 2018 | 26.339 | 7.45 | -20.09 | -0.022 | 13.677 |
| X-axis label | Merchandise | Services | Income | Current Account |
|---|---|---|---|---|
| Q1 2016 | 0.881 | 1.758 | -2.848 | -0.209 |
| Q2 2016 | 0.245 | 2.351 | -3.545 | -0.949 |
| Q3 2016 | 0.44 | 2.722 | -3.702 | -0.54 |
| Q4 2016 | 1.052 | 2.438 | -2.414 | 1.076 |
| Q1 2017 | 0.706 | 2.137 | -2.076 | 0.767 |
| Q2 2017 | 0.382 | 2.78 | -3.039 | 0.124 |
| Q3 2017 | -0.091 | 2.915 | -2.826 | -0.002 |
| Q4 2017 | -0.536 | 1.959 | -1.888 | -0.465 |
| Q1 2018 | -0.27 | 1.772 | -2.279 | -0.778 |
| Table 1 Summary of Current, Capital and Financial Account Balances | € million | ||||||||||||||||
| Period | Balance on Current Account | Balance on Capital Account | Direct Investment | Portfolio Investment | Other2 Investment | Reserve Assets | Balance on Financial Account | Net errors and omissions | |||||||||
| Merchandise1 | services and income balance | ||||||||||||||||
| Services | Primary Income | Secondary Income | Total | ||||||||||||||
| 1998 | Year | 17,510 | -8,426 | -9,776 | 1,319 | -16,883 | 627 | 840 | -4,422 | 8,466 | -7,459 | 2,280 | -1,135 | -2,602 | |||
| 1999 | Year | 22,170 | -9,723 | -13,398 | 1,177 | -21,944 | 226 | 560 | -11,359 | 14,342 | 974 | -1,746 | 2,211 | 1,425 | |||
| 2000 | Year | 28,312 | -13,312 | -15,327 | 994 | -27,645 | 667 | 1,182 | -22,957 | 5,358 | 9,037 | 142 | -8,420 | -10,269 | |||
| 2001 | Year | 31,464 | -12,412 | -17,762 | -1,075 | -31,249 | 215 | 779 | -6,241 | 25,158 | -19,183 | 441 | 175 | -819 | |||
| 2002 | Year | 36,982 | -13,619 | -21,910 | -1,116 | -36,645 | 337 | 588 | -19,444 | 37,979 | -19,425 | -343 | -1,233 | -2,158 | |||
| 2003 | Year | 32,954 | -10,903 | -20,035 | -1,303 | -32,241 | 713 | 445 | -15,270 | 39,977 | -22,751 | -1,770 | 186 | -972 | |||
| 2004 | Year | 34,588 | -12,141 | -21,345 | -1,255 | -34,741 | -153 | 355 | 23,095 | -14,287 | -12,170 | -1,177 | -4,539 | -4,741 | |||
| 2005 | Year | 32,184 | -13,655 | -22,786 | -1,769 | -38,210 | -6,026 | 340 | 37,660 | -52,698 | 15,364 | -1,472 | -1,147 | 4,539 | |||
| 2006 | Year | 27,194 | -12,313 | -22,723 | -2,063 | -37,099 | -9,905 | 299 | 15,841 | -8,135 | -16,635 | -87 | -9,016 | 590 | |||
| 2007 | Year | 28,698 | -12,384 | -26,630 | -2,510 | -41,524 | -12,826 | 115 | -1,621 | 7,283 | -20,086 | 12 | -14,413 | -1,702 | |||
| 2008 | Year | 32,622 | -16,468 | -25,141 | -2,729 | -44,339 | -11,716 | 119 | 23,288 | 45,749 | -85,932 | 78 | -16,817 | -5,220 | |||
| 2009 | Year | 38,752 | -15,823 | -27,885 | -2,948 | -46,656 | -7,904 | 14 | -245 | -22,626 | 19,433 | -79 | -3,517 | 4,373 | |||
| 2010 | Year | 41,288 | -13,421 | -27,178 | -2,701 | -43,300 | -2,012 | 91 | -16,318 | -85,965 | 90,883 | -5 | -11,404 | -9,484 | |||
| 2011 | Year | 41,257 | -9,096 | -32,312 | -2,660 | -44,067 | -2,810 | 234 | -18,698 | -26,908 | 31,086 | -329 | -14,849 | -12,272 | |||
| 2012 3 | Year | 36,896 | -6,282 | -33,939 | -2,609 | -42,830 | -5,934 | 86 | -20,497 | -767 | 10,952 | -12 | -10,324 | -4,476 | |||
| 2013 3 | Year | 34,506 | -718 | -28,069 | -2,931 | -31,718 | 2,787 | -936 | -16,137 | 35,737 | -15,467 | 10 | 4,143 | 2,289 | |||
| 2014 3 | Year | 40,731 | -5,546 | -30,341 | -2,750 | -38,637 | 2,093 | -6,769 | -5,279 | -27,862 | 20,506 | 136 | -12,498 | -7,824 | |||
| 2015 3 | Year | 113,394 | -37,715 | -60,785 | -3,338 | -101,838 | 11,556 | -1,303 | -44,510 | -88,281 | 138,621 | 494 | 6,321 | -3,930 | |||
| 2016 3 | Year | 106,088 | -63,735 | -49,912 | -3,813 | -117,460 | -11,373 | -4,331 | -8,430 | 27,711 | -29,073 | 1,456 | -8,335 | 7,368 | |||
| 2017 3 | Year | 107,639 | -18,351 | -59,773 | -4,589 | -82,713 | 24,924 | -28,168 | -33,581 | -55,315 | 93,176 | 399 | 4,678 | 7,922 | |||
| 2011 | Quarter 1 | 10,624 | -2,926 | -8,278 | -841 | -12,046 | -1,422 | 24 | -8,453 | -7,063 | 11,286 | -65 | -4,295 | -2,897 | |||
| Quarter 2 | 9,576 | -1,580 | -8,820 | -513 | -10,913 | -1,336 | 1 | -7,601 | -22,344 | 27,157 | 29 | -2,759 | -1,424 | ||||
| Quarter 3 | 11,547 | -1,862 | -8,307 | -641 | -10,810 | 736 | -1 | -6,802 | 19,456 | -16,652 | -24 | -4,022 | -4,757 | ||||
| Quarter 4 | 9,510 | -2,729 | -6,906 | -664 | -10,299 | -789 | 210 | 4,158 | -16,957 | 9,295 | -269 | -3,772 | -3,194 | ||||
| 2012 3 | Quarter 1 | 8,969 | -1,805 | -9,051 | -814 | -11,670 | -2,702 | 61 | -13,176 | 44,957 | -32,626 | -12 | -857 | 1,784 | |||
| Quarter 2 | 9,275 | -2,603 | -8,488 | -603 | -11,694 | -2,419 | 1 | 3,238 | -33,254 | 20,949 | 6 | -9,061 | -6,643 | ||||
| Quarter 3 | 10,072 | -327 | -8,632 | -643 | -9,602 | 471 | 5 | -14,231 | -6,315 | 17,833 | -1 | -2,714 | -3,190 | ||||
| Quarter 4 | 8,580 | -1,547 | -7,768 | -549 | -9,864 | -1,284 | 19 | 3,672 | -6,155 | 4,796 | -5 | 2,308 | 3,573 | ||||
| 2013 3 | Quarter 1 | 7,726 | -578 | -7,146 | -828 | -8,552 | -826 | -207 | -5,114 | 6,365 | 1,731 | 0 | 2,982 | 4,015 | |||
| Quarter 2 | 9,638 | -564 | -8,095 | -700 | -9,359 | 279 | -244 | -8,296 | 11,868 | -4,657 | 1 | -1,084 | -1,120 | ||||
| Quarter 3 | 9,816 | 634 | -7,154 | -663 | -7,183 | 2,632 | -259 | -1,371 | 932 | 1,709 | 4 | 1,274 | -1,100 | ||||
| Quarter 4 | 7,326 | -210 | -5,674 | -740 | -6,624 | 702 | -226 | -1,356 | 16,572 | -14,250 | 5 | 971 | 494 | ||||
| 2014 3 | Quarter 1 | 8,939 | -1,820 | -7,567 | -899 | -10,286 | -1,347 | -1,691 | 2,726 | -12,658 | 3,620 | 0 | -6,312 | -3,274 | |||
| Quarter 2 | 11,286 | -1,449 | -8,117 | -608 | -10,174 | 1,112 | -1,717 | -3,671 | -4,567 | 12,119 | 1 | 3,882 | 4,487 | ||||
| Quarter 3 | 10,985 | 151 | -7,891 | -545 | -8,285 | 2,700 | -1,649 | -485 | -15,427 | 9,887 | 2 | -6,023 | -7,075 | ||||
| Quarter 4 | 9,521 | -2,428 | -6,766 | -698 | -9,892 | -372 | -1,712 | -3,849 | 4,790 | -5,120 | 133 | -4,045 | -1,962 | ||||
| 2015 3 | Quarter 1 | 26,790 | -5,794 | -16,013 | -986 | -22,793 | 3,998 | -707 | 38,272 | -72,519 | 36,581 | 108 | 2,441 | -849 | |||
| Quarter 2 | 26,894 | -8,024 | -11,422 | -794 | -20,240 | 6,654 | -226 | -2,591 | 13,757 | -9,476 | 307 | 1,996 | -4,432 | ||||
| Quarter 3 | 29,755 | -7,431 | -17,792 | -593 | -25,816 | 3,939 | 100 | 9,983 | -17,663 | 14,477 | -24 | 6,773 | 2,735 | ||||
| Quarter 4 | 29,955 | -16,466 | -15,558 | -965 | -32,989 | -3,035 | -470 | -90,174 | -11,856 | 97,039 | 103 | -4,889 | -1,384 | ||||
| 2016 3 | Quarter 1 | 27,290 | -14,564 | -11,001 | -1,020 | -26,585 | 705 | -2,670 | 12,279 | -7,497 | 1,420 | 1,095 | 7,297 | 9,262 | |||
| Quarter 2 | 24,440 | -16,885 | -11,342 | -768 | -28,995 | -4,555 | -586 | -293 | 2,933 | -14,069 | -224 | -11,653 | -6,513 | ||||
| Quarter 3 | 26,315 | -12,294 | -14,425 | -820 | -27,539 | -1,224 | 161 | -10,522 | 10,385 | -7,662 | 379 | -7,420 | -6,357 | ||||
| Quarter 4 | 28,043 | -19,992 | -13,144 | -1,205 | -34,341 | -6,299 | -1,236 | -9,894 | 21,890 | -8,762 | 206 | 3,441 | 10,976 | ||||
| 2017 3 | Quarter 1 | 25,032 | -5,356 | -13,684 | -936 | -19,976 | 5,056 | -14,100 | -4,669 | -13,224 | -1,406 | -101 | -19,400 | -10,355 | |||
| Quarter 2 | 23,545 | -9,642 | -15,647 | -1,558 | -26,847 | -3,303 | -6,237 | 4,186 | -45,620 | 37,482 | 163 | -3,789 | 5,751 | ||||
| Quarter 3 | 28,915 | 681 | -14,829 | -1,006 | -15,154 | 13,760 | -5,971 | 4,069 | 598 | 6,773 | 235 | 11,675 | 3,886 | ||||
| Quarter 4 | 30,147 | -4,034 | -15,613 | -1,089 | -20,736 | 9,411 | -1,860 | -37,167 | 2,931 | 50,327 | 102 | 16,192 | 8,640 | ||||
| 2018 | Quarter 1 | 27,078 | -1,250 | -14,971 | -1,306 | -17,527 | 9,552 | -437 | 26,339 | 7,450 | -20,090 | -22 | 13,677 | 4,562 | |||
| 1Adjusted for balance of payments purposes. | |||||||||||||||||
| 2Includes financial derivatives and also life insurance liabilities to non-residents. Occasionally includes large capital transactions which cannot be shown in the Capital Account Balance due to confidentiality constraints. | |||||||||||||||||
| 3Revised. | |||||||||||||||||
| Table 2a Current and Capital Accounts | € million | ||||||||||||||
| 2016 1 | 2017 1 | 2016 1 | 2017 1 | 2018 | |||||||||||
| Item | Year | Quarter 1 | Quarter 2 | Quarter 3 | Quarter 4 | Quarter 1 | Quarter 2 | Quarter 3 | Quarter 4 | Quarter 1 | |||||
| Current Account | |||||||||||||||
| Merchandise2 | Exports | 193,160 | 192,854 | 48,495 | 47,648 | 46,899 | 50,118 | 45,963 | 45,793 | 48,427 | 52,671 | 48,485 | |||
| Imports | 87,072 | 85,214 | 21,205 | 23,207 | 20,584 | 22,076 | 20,931 | 22,248 | 19,512 | 22,523 | 21,407 | ||||
| International trade | Exports | 119,267 | 122,539 | 27,808 | 30,300 | 30,354 | 30,805 | 32,134 | 31,030 | 28,921 | 30,454 | 33,514 | |||
| Imports | 71,934 | 76,677 | 17,073 | 18,351 | 17,563 | 18,947 | 18,639 | 20,519 | 17,278 | 20,241 | 19,327 | ||||
| Goods for processing | Exports | 67,436 | 64,668 | 18,020 | 16,108 | 15,172 | 18,136 | 15,672 | 12,985 | 15,872 | 20,139 | 13,821 | |||
| Imports | 8,379 | 5,575 | 2,677 | 3,158 | 1,287 | 1,257 | 1,601 | 975 | 1,508 | 1,491 | 1,629 | ||||
| Other conceptual adjustments | Exports | 115 | -1,947 | 949 | -229 | -429 | -176 | -4,096 | -203 | 2,307 | 45 | -721 | |||
| Imports | 6,758 | 2,961 | 1,455 | 1,697 | 1,734 | 1,872 | 690 | 753 | 727 | 791 | 451 | ||||
| Merchanting (net export) | Exports | 6,341 | 7,593 | 1,717 | 1,469 | 1,802 | 1,353 | 2,253 | 1,980 | 1,327 | 2,033 | 1,871 | |||
| Services | Exports | 135,076 | 159,701 | 30,235 | 32,439 | 35,561 | 36,841 | 36,234 | 39,477 | 40,262 | 43,728 | 38,205 | |||
| Imports | 198,809 | 178,054 | 44,798 | 49,324 | 47,854 | 56,833 | 41,591 | 49,120 | 39,581 | 47,762 | 39,455 | ||||
| Repairs and Processing | Exports | 2,527 | 2,254 | 526 | 624 | 689 | 688 | 527 | 545 | 605 | 577 | 476 | |||
| Imports | 3,904 | 4,855 | 896 | 790 | 902 | 1,316 | 1,169 | 1,136 | 1,049 | 1,501 | 1,077 | ||||
| Transport | Exports | 7,225 | 8,086 | 1,126 | 1,833 | 2,794 | 1,472 | 1,190 | 2,147 | 3,099 | 1,650 | 1,228 | |||
| Imports | 2,689 | 2,540 | 671 | 729 | 633 | 656 | 623 | 663 | 583 | 671 | 642 | ||||
| Tourism and Travel 3 | Exports | 4,685 | 4,972 | 716 | 1,296 | 1,718 | 955 | 708 | 1,433 | 1,762 | 1,069 | 817 | |||
| Imports | 5,623 | 5,814 | 1,075 | 1,354 | 1,920 | 1,274 | 1,077 | 1,407 | 2,063 | 1,267 | 1,239 | ||||
| Insurance | Exports | 9,296 | 9,913 | 2,314 | 2,303 | 2,259 | 2,420 | 2,496 | 2,451 | 2,373 | 2,593 | 2,526 | |||
| Imports | 6,695 | 7,079 | 1,812 | 1,624 | 1,623 | 1,636 | 1,734 | 1,801 | 1,689 | 1,855 | 2,088 | ||||
| Financial services | Exports | 13,287 | 15,309 | 3,078 | 3,226 | 3,362 | 3,621 | 3,764 | 3,637 | 3,865 | 4,043 | 3,886 | |||
| Imports | 11,549 | 13,246 | 2,766 | 2,713 | 2,948 | 3,122 | 3,278 | 3,162 | 3,320 | 3,486 | 3,386 | ||||
| Royalties/Licences | Exports | 8,052 | 9,608 | 1,964 | 1,940 | 2,008 | 2,140 | 1,783 | 1,974 | 2,946 | 2,905 | 2,716 | |||
| Imports | 69,202 | 66,588 | 17,280 | 16,902 | 17,167 | 17,853 | 16,690 | 16,700 | 15,198 | 18,000 | 16,237 | ||||
| of which: Pharmaceutical products and preparations | Exports | 365 | 184 | 78 | 69 | 104 | 114 | 46 | 45 | 45 | 48 | 30 | |||
| Imports | 24,025 | 15,898 | 6,445 | 5,802 | 6,598 | 5,180 | 4,475 | 4,544 | 3,486 | 3,393 | 2,873 | ||||
| Information and communication | Exports | 837 | 2,472 | 293 | 192 | 227 | 125 | 177 | * | * | 1,069 | 1,121 | |||
| Imports | 27,647 | 34,105 | 6,063 | 6,914 | 6,723 | 7,947 | 7,888 | 8,315 | 7,752 | 10,150 | 8,845 | ||||
| Communications | Exports | 719 | 617 | 179 | 182 | 180 | 178 | 156 | 157 | 152 | 152 | 147 | |||
| Imports | 1,165 | 1,145 | 306 | 276 | 289 | 294 | 256 | 289 | 292 | 308 | 268 | ||||
| Computer services4 | Exports | 58,079 | 69,323 | 13,197 | 13,882 | 14,124 | 16,876 | 15,851 | 17,045 | 16,492 | 19,935 | 18,477 | |||
| Imports | 1,385 | 3,353 | 321 | 316 | 353 | 395 | 550 | 787 | 859 | 1,157 | 839 | ||||
| Business services | Exports | 30,093 | 37,075 | 7,092 | 6,863 | 8,450 | 7,688 | 9,304 | 9,547 | 8,570 | 9,654 | 7,445 | |||
| Imports | 96,081 | 72,868 | 19,542 | 24,492 | 21,889 | 30,158 | 16,073 | 23,033 | 14,388 | 19,374 | 13,536 | ||||
| Research and development | Exports | 3,978 | 4,907 | 1,187 | 866 | 1,325 | 600 | 1,178 | 1,161 | 1,041 | 1,527 | 537 | |||
| Imports | 58,052 | 26,832 | 10,739 | 14,862 | 13,197 | 19,254 | 5,866 | 12,192 | 3,297 | 5,477 | 3,403 | ||||
| of which: IP related | Exports | 1,967 | 3,086 | * | 366 | * | 44 | * | * | 586 | 1,162 | 50 | |||
| Imports | 46,053 | 14,034 | 8,060 | 11,943 | 10,390 | 15,660 | 2,839 | 9,139 | * | * | 104 | ||||
| Operational leasing | Exports | 13,169 | 13,105 | 3,184 | 3,317 | 3,335 | 3,333 | 3,295 | 3,225 | 3,357 | 3,228 | 2,994 | |||
| Imports | 1,074 | 696 | 177 | 326 | 207 | 364 | 304 | 143 | 131 | 118 | 122 | ||||
| Misc. business services5 | Exports | 12,946 | 19,062 | 2,721 | 2,680 | 3,790 | 3,755 | 4,830 | 5,161 | 4,172 | 4,899 | 3,914 | |||
| Imports | 36,955 | 45,340 | 8,626 | 9,304 | 8,485 | 10,540 | 9,903 | 10,697 | 10,960 | 13,780 | 10,012 | ||||
| Other services n.e.s. | Exports | 1,113 | 2,546 | 42 | 290 | -23 | 804 | 456 | 541 | 399 | 1,150 | 488 | |||
| Imports | 517 | 564 | 130 | 127 | 130 | 130 | 140 | 142 | 140 | 142 | 141 | ||||
| Merchandise and Services - Total | Exports | 328,235 | 352,555 | 78,730 | 80,086 | 82,459 | 86,960 | 82,197 | 85,270 | 88,689 | 96,399 | 86,690 | |||
| Imports | 285,882 | 263,268 | 66,004 | 72,531 | 68,438 | 78,909 | 62,521 | 71,367 | 59,094 | 70,286 | 60,862 | ||||
| Trade Balance | Net | 42,353 | 89,289 | 12,726 | 7,556 | 14,021 | 8,050 | 19,676 | 13,903 | 29,596 | 26,114 | 25,829 | |||
| Primary Income | Inflows | 70,346 | 78,224 | 16,841 | 18,426 | 15,596 | 19,483 | 17,934 | 20,516 | 19,294 | 20,480 | 18,162 | |||
| Outflows | 120,260 | 137,996 | 27,842 | 29,769 | 30,021 | 32,628 | 31,617 | 36,163 | 34,123 | 36,093 | 33,133 | ||||
| Compensation of Employees | Inflows | 520 | 528 | 130 | 130 | 130 | 130 | 131 | 131 | 135 | 131 | 131 | |||
| Outflows | 627 | 645 | 156 | 158 | 159 | 154 | 160 | 161 | 160 | 164 | 159 | ||||
| Investment Income | Inflows | 68,346 | 76,189 | 16,362 | 17,948 | 15,095 | 18,941 | 17,456 | 20,037 | 18,777 | 19,919 | 17,672 | |||
| Outflows | 119,322 | 137,035 | 27,617 | 29,539 | 29,793 | 32,373 | 31,384 | 35,933 | 33,884 | 35,834 | 32,897 | ||||
| Direct investment income | Inflows | 18,383 | 20,728 | 4,892 | 4,207 | 2,960 | 6,324 | 4,258 | 4,498 | 5,142 | 6,830 | 3,868 | |||
| Outflows | 61,056 | 72,048 | 14,612 | 13,110 | 15,634 | 17,700 | 16,749 | 17,322 | 18,108 | 19,869 | 17,374 | ||||
| Income on equity | Inflows | 15,193 | 18,079 | 4,022 | 3,471 | 2,251 | 5,449 | 3,511 | 3,762 | 4,495 | 6,311 | 3,599 | |||
| Outflows | 55,285 | 65,966 | 13,175 | 11,732 | 14,220 | 16,158 | 15,081 | 15,757 | 16,646 | 18,482 | 16,145 | ||||
| Dividends & distributed | Inflows | 3,420 | 630 | * | 320 | 200 | * | 33 | 294 | 59 | 244 | 44 | |||
| branch profits | Outflows | 18,603 | 12,936 | 6,922 | 4,760 | 4,230 | 2,691 | 3,046 | 2,854 | 4,277 | 2,759 | 3,963 | |||
| Reinvested earnings | Inflows | 11,774 | 17,450 | * | 3,151 | 2,052 | * | 3,478 | 3,469 | 4,436 | 6,067 | 3,555 | |||
| Outflows | 36,682 | 53,029 | 6,253 | 6,972 | 9,990 | 13,467 | 12,034 | 12,903 | 12,369 | 15,723 | 12,182 | ||||
| Income on debt | Inflows | 3,190 | 2,649 | 870 | 736 | 709 | 875 | 746 | 736 | 647 | 520 | 269 | |||
| Outflows | 5,771 | 6,084 | 1,437 | 1,378 | 1,414 | 1,542 | 1,668 | 1,565 | 1,463 | 1,388 | 1,229 | ||||
| Portfolio investment income | Inflows | 40,784 | 45,557 | 9,287 | 11,245 | 10,094 | 10,158 | 10,653 | 12,966 | 11,177 | 10,761 | 11,351 | |||
| Outflows | 48,036 | 54,714 | 10,666 | 13,916 | 11,570 | 11,884 | 12,170 | 16,089 | 13,188 | 13,267 | 13,068 | ||||
| Income on equity | Inflows | 12,834 | 14,619 | 2,582 | 4,452 | 3,112 | 2,688 | 3,261 | 5,032 | 3,500 | 2,826 | 3,388 | |||
| Outflows | 40,541 | 48,043 | 8,717 | 12,082 | 9,729 | 10,013 | 10,434 | 14,380 | 11,552 | 11,677 | 11,566 | ||||
| Income on debt | Inflows | 27,948 | 30,939 | 6,704 | 6,793 | 6,982 | 7,469 | 7,393 | 7,934 | 7,677 | 7,935 | 7,963 | |||
| Outflows | 7,494 | 6,672 | 1,949 | 1,833 | 1,841 | 1,871 | 1,737 | 1,709 | 1,636 | 1,590 | 1,502 | ||||
| Other investment income | Inflows | 9,177 | 9,904 | 2,183 | 2,495 | 2,040 | 2,459 | 2,545 | 2,573 | 2,458 | 2,328 | 2,453 | |||
| Outflows | 10,231 | 10,272 | 2,339 | 2,514 | 2,589 | 2,789 | 2,464 | 2,522 | 2,588 | 2,698 | 2,456 | ||||
| Other primary income | Inflows | 1,480 | 1,504 | 349 | 348 | 371 | 412 | 346 | 347 | 382 | 429 | 360 | |||
| Outflows | 310 | 317 | 69 | 71 | 69 | 101 | 74 | 69 | 79 | 95 | 77 | ||||
| Secondary Income | Inflows | 4,504 | 5,154 | 1,123 | 1,051 | 1,062 | 1,268 | 1,277 | 1,127 | 1,431 | 1,319 | 1,370 | |||
| Outflows | 8,317 | 9,744 | 2,143 | 1,820 | 1,881 | 2,473 | 2,213 | 2,685 | 2,438 | 2,408 | 2,676 | ||||
| Income Balance | Net | -53,727 | -64,363 | -12,021 | -12,111 | -15,245 | -14,350 | -14,620 | -17,205 | -15,836 | -16,702 | -16,276 | |||
| Current Account - Total | Inflows | 403,086 | 435,934 | 96,694 | 99,564 | 99,117 | 107,711 | 101,408 | 106,913 | 109,415 | 118,198 | 106,223 | |||
| Outflows | 414,458 | 411,009 | 95,988 | 104,119 | 100,341 | 114,010 | 96,352 | 110,216 | 95,655 | 108,786 | 96,671 | ||||
| Current Account Balance | Net | -11,373 | 24,924 | 705 | -4,555 | -1,224 | -6,299 | 5,056 | -3,303 | 13,760 | 9,411 | 9,552 | |||
| Capital Account Balance | Net | -4,331 | -28,168 | -2,670 | -586 | 161 | -1,236 | -14,100 | -6,237 | -5,971 | -1,860 | -437 | |||
| Memorandum Item: | |||||||||||||||
| Government Income | Inflows | 74 | 93 | 12 | 20 | 18 | 24 | 21 | 23 | 25 | 24 | 386 | |||
| Outflows | 3,909 | 3,675 | 1,066 | 998 | 960 | 885 | 958 | 942 | 936 | 839 | 946 | ||||
| 1Revised | |||||||||||||||
| 2Adjusted for balance of payments purposes. | |||||||||||||||
| 3Under the credit item, passenger fare receipts of resident carriers from foreign visitors are excluded; such receipts are included under transport credits - see Background Notes. | |||||||||||||||
| 4Covers exports and imports of software that were not incorporated as part of computer hardware or physical media but separately transmitted by electronic means. The value of sales and purchases of additional software licences is also included. | |||||||||||||||
| 5Covers mainly advertising and inter-affiliate management charges. | |||||||||||||||
| Table 2b Financial Account¹ | € million | ||||||||||||||
| 2016 2 | 2017 2 | 2016 2 | 2017 2 | 2018 | |||||||||||
| Item | Year | Quarter 1 | Quarter 2 | Quarter 3 | Quarter 4 | Quarter 1 | Quarter 2 | Quarter 3 | Quarter 4 | Quarter 1 | |||||
| Direct Investment | Abroad | 27,180 | -34,690 | 32,623 | -2,906 | 1,245 | -3,782 | 127 | 15,417 | 8,118 | -58,352 | 3,520 | |||
| In Ireland | 35,607 | -1,109 | 20,343 | -2,613 | 11,766 | 6,111 | 4,796 | 11,231 | 4,049 | -21,185 | -22,818 | ||||
| Equity | Abroad | 43,782 | -65,888 | 24,086 | 15,101 | -846 | 5,441 | -23,160 | 27,062 | -8,271 | -61,519 | -7,605 | |||
| In Ireland | 97,986 | -35,529 | 38,854 | 7,801 | 11,593 | 39,738 | 19,279 | -13,025 | 260 | -42,043 | -10,882 | ||||
| Reinvested Earnings | Abroad | 11,774 | 17,450 | * | 3,151 | 2,052 | * | 3,478 | 3,469 | 4,436 | 6,067 | 3,555 | |||
| In Ireland | 36,682 | 53,029 | 6,253 | 6,972 | 9,990 | 13,467 | 12,034 | 12,903 | 12,369 | 15,723 | 12,182 | ||||
| Other Capital | Abroad | -28,377 | 13,749 | * | -21,158 | 39 | * | 19,809 | -15,113 | 11,953 | -2,900 | 7,571 | |||
| In Ireland | -99,059 | -18,608 | -24,764 | -17,385 | -9,816 | -47,094 | -26,517 | 11,354 | -8,580 | 5,135 | -24,118 | ||||
| Portfolio Investment | Assets | 116,439 | 253,689 | 7,237 | 23,453 | 32,770 | 52,979 | 79,441 | 40,091 | 64,731 | 69,426 | 80,507 | |||
| Liabilities | 88,727 | 309,004 | 14,734 | 20,520 | 22,385 | 31,088 | 92,665 | 85,711 | 64,133 | 66,495 | 73,057 | ||||
| Equity | Assets | 3,705 | 94,474 | -2,843 | -20,926 | 11,720 | 15,754 | 24,400 | 25,928 | 26,227 | 17,919 | 29,066 | |||
| Liabilities | 130,304 | 306,047 | 15,214 | 48,558 | 29,546 | 36,986 | 76,748 | 91,641 | 69,791 | 67,867 | 62,573 | ||||
| Debt Instruments | Assets | 112,732 | 159,213 | 10,080 | 44,378 | 21,049 | 37,225 | 55,041 | 14,163 | 38,503 | 51,506 | 51,442 | |||
| Liabilities | -41,577 | 2,957 | -480 | -28,038 | -7,161 | -5,898 | 15,917 | -5,930 | -5,658 | -1,372 | 10,484 | ||||
| Bonds and notes | Assets | 83,755 | 115,363 | 12,691 | 35,811 | 14,209 | 21,044 | 33,236 | 37,623 | 21,698 | 22,806 | 33,949 | |||
| Liabilities | -37,624 | -816 | -1,103 | -27,811 | -7,319 | -1,391 | 12,119 | -9,263 | -4,729 | 1,057 | 7,658 | ||||
| Money market instruments | Assets | 28,978 | 43,850 | -2,611 | 8,567 | 6,841 | 16,181 | 21,805 | -23,460 | 16,805 | 28,700 | 17,493 | |||
| Liabilities | -3,955 | 3,775 | 622 | -228 | 158 | -4,507 | 3,799 | 3,333 | -928 | -2,429 | 2,826 | ||||
| Other Investment | Assets | -43,731 | 94,497 | -21,519 | -18,012 | 2,689 | -6,889 | -22,578 | 33,470 | 33,034 | 50,571 | 31,514 | |||
| Liabilities | -14,657 | 1,321 | -22,938 | -3,943 | 10,351 | 1,873 | -21,173 | -4,011 | 26,261 | 244 | 51,604 | ||||
| Loans, currency and deposits | Assets | -7,471 | 105,547 | -5,542 | 12,875 | -11,268 | -3,536 | 5,018 | 32,982 | 19,579 | 47,968 | 22,547 | |||
| Liabilities | 20,151 | 24,897 | 1,227 | 6,089 | 6,129 | 6,706 | 15,171 | 1,169 | 16,012 | -7,455 | 34,571 | ||||
| Other3 | Assets | -36,260 | -11,049 | -15,977 | -30,887 | 13,957 | -3,353 | -27,596 | 488 | 13,456 | 2,603 | 8,967 | |||
| Liabilities | -34,807 | -23,577 | -24,165 | -10,031 | 4,222 | -4,833 | -36,344 | -5,180 | 10,248 | 7,699 | 17,032 | ||||
| Reserve Assets | 1,456 | 399 | 1,095 | -224 | 379 | 206 | -101 | 163 | 235 | 102 | -22 | ||||
| Monetary gold | 0 | 0 | 0 | 0 | 0 | 0 | 0 | 0 | 0 | 0 | 0 | ||||
| Special drawing rights | 113 | -43 | 116 | -19 | 13 | 3 | 12 | 0 | -39 | -16 | -16 | ||||
| Reserve position in the IMF | 730 | 0 | 730 | 0 | 0 | 0 | 0 | 0 | 0 | 0 | -11 | ||||
| Foreign exchange | 416 | 158 | 0 | 2 | 352 | 62 | 43 | 148 | 90 | -123 | -14 | ||||
| Other | 198 | 285 | 249 | -207 | 15 | 141 | -156 | 15 | 185 | 241 | 19 | ||||
| Balance on Financial Account | -8,335 | 4,678 | 7,297 | -11,653 | -7,420 | 3,441 | -19,400 | -3,789 | 11,675 | 16,192 | 13,677 | ||||
| Net errors and omissions | 7,368 | 7,922 | 9,262 | -6,513 | -6,357 | 10,976 | -10,355 | 5,751 | 3,886 | 8,640 | 4,562 | ||||
| Memorandum Item: | |||||||||||||||
| Government financial | Assets | -966 | 426 | -822 | -143 | 506 | -507 | 46 | 407 | 27 | -54 | -1,095 | |||
| transactions | Liabilities | -6,495 | 1,377 | 3,286 | -7,516 | 623 | -2,888 | 6,543 | 2,995 | -631 | -7,530 | 5,771 | |||
| 1Financial account transactions are categorised under two headings 'Assets' and 'Liabilities' for Portfolio Investment, Other Investment and Reserve Assets. 'For Direct Investment, 'a 'directional' categorisation is used: 'Abroad' 'indicates direct investment by Irish investors in foreign companies; 'Direct investment into Ireland is indicated by the heading 'In Ireland'. | |||||||||||||||
| 2Revised. | |||||||||||||||
| 3Includes financial derivatives; in the case of liabilities this category also includes life insurance liabilities to non-residents. Occasionally includes large capital transactions which cannot be shown in the Capital Account Balance due to confidentiality constraints. | |||||||||||||||
| Table 2c Current Account with UK | € million | ||||||||||||||
| 2016 | 2017 | 2016 1 | 2017 1 | 2018 | |||||||||||
| Item | Year | Quarter 1 | Quarter 2 | Quarter 3 | Quarter 4 | Quarter 1 | Quarter 2 | Quarter 3 | Quarter 4 | Quarter 1 | |||||
| Current Account | |||||||||||||||
| Merchandise2 | Exports | 24,005 | 23,464 | 6,018 | 5,570 | 5,536 | 6,881 | 6,007 | 6,213 | 5,508 | 5,736 | 5,315 | |||
| Imports | 21,387 | 23,003 | 5,137 | 5,325 | 5,096 | 5,829 | 5,301 | 5,831 | 5,599 | 6,272 | 5,585 | ||||
| of which: Merchanting (net export) | Exports | 4,156 | 3,853 | * | * | * | * | 1,039 | 868 | 926 | 1,020 | 1,081 | |||
| Services | Exports | 24,055 | 26,266 | 5,410 | 5,790 | 6,423 | 6,432 | 5,973 | 6,632 | 6,921 | 6,740 | 6,148 | |||
| Imports | 14,786 | 16,475 | 3,652 | 3,439 | 3,701 | 3,994 | 3,836 | 3,852 | 4,006 | 4,781 | 4,376 | ||||
| Transport | Exports | 2,285 | 2,349 | 387 | 577 | 847 | 474 | 369 | 631 | 866 | 483 | 392 | |||
| Imports | 505 | 531 | 125 | 125 | 120 | 135 | 128 | 132 | 127 | 144 | 134 | ||||
| Tourism and Travel 3 | Exports | 1,094 | 1,032 | 220 | 283 | 344 | 247 | 204 | 273 | 310 | 245 | 236 | |||
| Imports | 1,185 | 1,266 | 267 | 229 | 337 | 352 | 303 | 281 | 334 | 348 | 351 | ||||
| Insurance | Exports | 2,403 | 2,507 | 634 | 604 | 575 | 590 | 649 | 613 | 599 | 646 | 640 | |||
| Imports | 1,613 | 1,613 | 463 | 419 | 366 | 365 | 407 | 392 | 382 | 432 | 411 | ||||
| Financial services | Exports | 4,853 | 5,595 | 1,128 | 1,197 | 1,223 | 1,305 | 1,364 | 1,304 | 1,452 | 1,475 | 1,453 | |||
| Imports | 3,751 | 4,355 | 879 | 925 | 956 | 991 | 1,071 | 1,027 | 1,127 | 1,130 | 1,184 | ||||
| Royalties/Licences | Exports | 819 | 1,088 | 190 | 191 | 222 | 216 | 263 | 260 | 261 | 304 | 259 | |||
| Imports | 603 | 463 | 178 | 132 | 152 | 141 | 131 | 104 | 122 | 106 | 76 | ||||
| Computer services4 | Exports | 6,088 | 6,327 | 1,349 | 1,295 | 1,621 | 1,823 | 1,443 | 1,564 | 1,579 | 1,741 | 1,541 | |||
| Imports | 157 | 277 | 39 | 40 | 39 | 39 | 56 | 74 | 71 | 76 | 80 | ||||
| Business services | Exports | 3,721 | 4,212 | 886 | 925 | 902 | 1,008 | 1,001 | 1,175 | 987 | 1,049 | 923 | |||
| Imports | 5,953 | 6,954 | 1,444 | 1,318 | 1,474 | 1,717 | 1,492 | 1,593 | 1,577 | 2,292 | 1,875 | ||||
| (of which: Operational leasing) | Exports | 726 | 711 | 183 | 179 | 177 | 187 | 173 | 189 | 168 | 181 | 153 | |||
| Imports | 38 | 28 | 8 | 9 | 9 | 12 | 7 | 7 | 7 | 7 | 7 | ||||
| Other | Exports | 2,792 | 3,156 | 614 | 718 | 691 | 769 | 680 | 813 | 866 | 797 | 704 | |||
| Imports | 1,017 | 1,015 | 257 | 251 | 256 | 253 | 249 | 248 | 265 | 253 | 265 | ||||
| Merchandise and Services Total | Exports | 48,060 | 49,730 | 11,428 | 11,360 | 11,959 | 13,312 | 11,980 | 12,845 | 12,429 | 12,476 | 11,463 | |||
| Imports | 36,173 | 39,478 | 8,789 | 8,764 | 8,797 | 9,822 | 9,137 | 9,683 | 9,606 | 11,053 | 9,961 | ||||
| Trade balance | Net | 11,887 | 10,252 | 2,639 | 2,596 | 3,162 | 3,490 | 2,843 | 3,162 | 2,823 | 1,423 | 1,502 | |||
| Primary Income | Inflows | 13,532 | 16,686 | 3,392 | 3,739 | 2,853 | 3,548 | 4,025 | 4,125 | 4,083 | 4,453 | 4,360 | |||
| Outflows | 25,850 | 26,086 | 6,197 | 7,235 | 6,506 | 5,912 | 6,022 | 7,045 | 6,794 | 6,225 | 6,521 | ||||
| (of which : Investment Income) | Inflows | 13,308 | 16,461 | 3,336 | 3,683 | 2,797 | 3,492 | 3,969 | 4,070 | 4,025 | 4,397 | 4,304 | |||
| Outflows | 25,519 | 25,749 | 6,112 | 7,152 | 6,421 | 5,834 | 5,937 | 6,961 | 6,712 | 6,139 | 6,438 | ||||
| Direct investment income | Inflows | 1,118 | 2,216 | 425 | 498 | -226 | 421 | 581 | 397 | 449 | 789 | 618 | |||
| Outflows | 4,473 | 2,846 | 1,256 | 1,171 | 1,230 | 816 | 811 | 459 | 854 | 722 | 638 | ||||
| Portfolio investment income | Inflows | 9,045 | 10,658 | 2,095 | 2,341 | 2,275 | 2,334 | 2,566 | 2,790 | 2,635 | 2,667 | 2,727 | |||
| Outflows | 18,003 | 20,668 | 4,038 | 5,219 | 4,500 | 4,246 | 4,610 | 5,946 | 5,266 | 4,846 | 5,197 | ||||
| Other investment income | Inflows | 3,145 | 3,586 | 816 | 844 | 748 | 737 | 822 | 882 | 941 | 941 | 960 | |||
| Outflows | 3,044 | 2,232 | 818 | 763 | 692 | 771 | 516 | 555 | 591 | 570 | 604 | ||||
| Secondary Income | Inflows | 1,823 | 2,037 | 511 | 417 | 466 | 429 | 542 | 523 | 556 | 416 | 530 | |||
| Outflows | 2,014 | 2,466 | 554 | 466 | 515 | 479 | 621 | 642 | 671 | 532 | 648 | ||||
| Income balance | Net | -12,509 | -9,829 | -2,848 | -3,545 | -3,702 | -2,414 | -2,076 | -3,039 | -2,826 | -1,888 | -2,279 | |||
| Current Account - Total | Inflows | 63,415 | 68,453 | 15,331 | 15,517 | 15,278 | 17,289 | 16,547 | 17,493 | 17,068 | 17,345 | 16,353 | |||
| Outflows | 64,036 | 68,028 | 15,540 | 16,465 | 15,818 | 16,213 | 15,780 | 17,369 | 17,070 | 17,809 | 17,130 | ||||
| Current Account Balance with UK | -622 | 424 | -209 | -949 | -540 | 1,076 | 767 | 124 | -2 | -465 | -778 | ||||
| 1Revised | |||||||||||||||
| 2Adjusted for balance of payments purposes. | |||||||||||||||
| 3Under the credit item, passenger fare receipts of resident carriers from foreign visitors are excluded; such receipts are included under transport credits - see Background Notes. | |||||||||||||||
| 4Covers exports and imports of software that were not incorporated as part of computer hardware or physical media but separately transmitted by electronic means. The value of sales and purchases of additional software licences is also included. | |||||||||||||||
| Table 3 Current, Capital and Financial Accounts showing IFSC¹ and Non–IFSC activity | € million | ||||||||||||||
| 2016 2 | 2017 2 | 2016 2 | 2017 2 | 2018 | |||||||||||
| Item | Year | Quarter 1 | Quarter 2 | Quarter 3 | Quarter 4 | Quarter 1 | Quarter 2 | Quarter 3 | Quarter 4 | Quarter 1 | |||||
| Current Account - Total | Inflows | 403,086 | 435,934 | 96,694 | 99,564 | 99,117 | 107,711 | 101,408 | 106,913 | 109,415 | 118,198 | 106,223 | |||
| Outflows | 414,458 | 411,009 | 95,988 | 104,119 | 100,341 | 114,010 | 96,352 | 110,216 | 95,655 | 108,786 | 96,671 | ||||
| Merchandise3 | Exports | 193,160 | 192,854 | 48,495 | 47,648 | 46,899 | 50,118 | 45,963 | 45,793 | 48,427 | 52,671 | 48,485 | |||
| Imports | 87,072 | 85,214 | 21,205 | 23,207 | 20,584 | 22,076 | 20,931 | 22,248 | 19,512 | 22,523 | 21,407 | ||||
| Services | Exports | 135,076 | 159,701 | 30,235 | 32,439 | 35,561 | 36,841 | 36,234 | 39,477 | 40,262 | 43,728 | 38,205 | |||
| Imports | 198,809 | 178,054 | 44,798 | 49,324 | 47,854 | 56,833 | 41,591 | 49,120 | 39,581 | 47,762 | 39,455 | ||||
| IFSC | Exports | 36,509 | 39,051 | 8,727 | 9,092 | 9,136 | 9,554 | 9,705 | 9,671 | 9,707 | 9,968 | 9,528 | |||
| Imports | 20,950 | 23,307 | 5,094 | 5,020 | 5,184 | 5,652 | 5,821 | 5,610 | 5,747 | 6,129 | 6,447 | ||||
| Non-IFSC | Exports | 98,566 | 120,652 | 21,508 | 23,346 | 26,425 | 27,287 | 26,529 | 29,807 | 30,555 | 33,761 | 28,676 | |||
| Imports | 177,862 | 154,748 | 39,705 | 44,304 | 42,671 | 51,182 | 35,770 | 43,510 | 33,834 | 41,634 | 33,007 | ||||
| Primary Income | Inflows | 70,346 | 78,224 | 16,841 | 18,426 | 15,596 | 19,483 | 17,934 | 20,516 | 19,294 | 20,480 | 18,162 | |||
| Outflows | 120,260 | 137,996 | 27,842 | 29,769 | 30,021 | 32,628 | 31,617 | 36,163 | 34,123 | 36,093 | 33,133 | ||||
| IFSC | Inflows | 53,101 | 58,578 | 12,238 | 14,468 | 12,849 | 13,546 | 14,257 | 16,307 | 14,236 | 13,778 | 14,106 | |||
| Outflows | 59,166 | 64,820 | 13,626 | 16,116 | 14,637 | 14,787 | 15,466 | 18,031 | 15,800 | 15,523 | 16,622 | ||||
| Non-IFSC | Inflows | 17,246 | 19,644 | 4,603 | 3,958 | 2,747 | 5,938 | 3,676 | 4,208 | 5,058 | 6,702 | 4,057 | |||
| Outflows | 61,095 | 73,176 | 14,216 | 13,653 | 15,385 | 17,841 | 16,151 | 18,132 | 18,323 | 20,570 | 16,511 | ||||
| Secondary Income | Inflows | 4,504 | 5,154 | 1,123 | 1,051 | 1,062 | 1,268 | 1,277 | 1,127 | 1,431 | 1,319 | 1,370 | |||
| Outflows | 8,317 | 9,744 | 2,143 | 1,820 | 1,881 | 2,473 | 2,213 | 2,685 | 2,438 | 2,408 | 2,676 | ||||
| IFSC4 | Inflows | 3,774 | 4,324 | 931 | 864 | 914 | 1,065 | 1,038 | 885 | 1,241 | 1,160 | 1,213 | |||
| Outflows | 3,774 | 4,324 | 931 | 864 | 914 | 1,065 | 1,038 | 885 | 1,241 | 1,160 | 1,213 | ||||
| Non-IFSC | Inflows | 730 | 830 | 192 | 187 | 148 | 203 | 238 | 243 | 190 | 159 | 157 | |||
| Outflows | 4,542 | 5,420 | 1,212 | 955 | 967 | 1,408 | 1,175 | 1,800 | 1,197 | 1,248 | 1,463 | ||||
| Balance on Current Account | -11,373 | 24,924 | 705 | -4,555 | -1,224 | -6,299 | 5,056 | -3,303 | 13,760 | 9,411 | 9,552 | ||||
| Balance on Capital Account | -4,331 | -28,168 | -2,670 | -586 | 161 | -1,236 | -14,100 | -6,237 | -5,971 | -1,860 | -437 | ||||
| Financial Account5 | |||||||||||||||
| Direct investment | Abroad | 27,180 | -34,690 | 32,623 | -2,906 | 1,245 | -3,782 | 127 | 15,417 | 8,118 | -58,352 | 3,520 | |||
| In Ireland | 35,607 | -1,109 | 20,343 | -2,613 | 11,766 | 6,111 | 4,796 | 11,231 | 4,049 | -21,185 | -22,818 | ||||
| IFSC | Abroad | 13,834 | 6,653 | 14,869 | 641 | 516 | -2,192 | * | * | -47 | 1,194 | -2,852 | |||
| In Ireland | 11,809 | 8,124 | 20,575 | -9,214 | 20,108 | -19,660 | -1,284 | -14,189 | 1,398 | 22,199 | -13,516 | ||||
| Non-IFSC | Abroad | 13,345 | -41,344 | 17,754 | -3,547 | 728 | -1,590 | * | * | 8,165 | -59,547 | 6,373 | |||
| In Ireland | 23,800 | -9,232 | -231 | 6,601 | -8,341 | 25,771 | 6,080 | 25,421 | 2,651 | -43,384 | -9,302 | ||||
| Portfolio investment | Assets | 116,439 | 253,689 | 7,237 | 23,453 | 32,770 | 52,979 | 79,441 | 40,091 | 64,731 | 69,426 | 80,507 | |||
| Liabilities | 88,727 | 309,004 | 14,734 | 20,520 | 22,385 | 31,088 | 92,665 | 85,711 | 64,133 | 66,495 | 73,057 | ||||
| IFSC | Assets | 108,091 | 245,900 | 6,347 | 21,347 | 29,452 | 50,945 | 76,242 | 40,903 | 61,346 | 67,409 | 79,420 | |||
| Liabilities | 99,770 | 306,633 | -206 | 29,660 | 26,093 | 44,223 | 86,510 | 84,788 | 66,578 | 68,757 | 65,778 | ||||
| Non-IFSC | Assets | 8,348 | 7,790 | 890 | 2,106 | 3,318 | 2,034 | 3,199 | -811 | 3,385 | 2,017 | 1,088 | |||
| Liabilities | -11,042 | 2,372 | 14,940 | -9,140 | -3,708 | -13,134 | 6,156 | 923 | -2,445 | -2,262 | 7,280 | ||||
| Other investment6 | Assets | -43,731 | 94,497 | -21,519 | -18,012 | 2,689 | -6,889 | -22,578 | 33,470 | 33,034 | 50,571 | 31,514 | |||
| Liabilities | -14,657 | 1,321 | -22,938 | -3,943 | 10,351 | 1,873 | -21,173 | -4,011 | 26,261 | 244 | 51,604 | ||||
| IFSC | Assets | -45,938 | 90,837 | -14,380 | -20,603 | 2,787 | -13,742 | -10,011 | 25,997 | 27,623 | 47,228 | 36,938 | |||
| Liabilities | -21,185 | 9,594 | -18,837 | -6,668 | 6,686 | -2,366 | -11,775 | -3,031 | 22,198 | 2,202 | 58,848 | ||||
| Non-IFSC | Assets | 2,206 | 3,661 | -7,139 | 2,590 | -98 | 6,853 | -12,567 | 7,473 | 5,412 | 3,343 | -5,424 | |||
| Liabilities | 6,528 | -8,273 | -4,101 | 2,725 | 3,665 | 4,239 | -9,398 | -980 | 4,063 | -1,958 | -7,245 | ||||
| Reserve Assets | 1,456 | 399 | 1,095 | -224 | 379 | 206 | -101 | 163 | 235 | 102 | -22 | ||||
| Balance on Financial Account | -8,335 | 4,678 | 7,297 | -11,653 | -7,420 | 3,441 | -19,400 | -3,789 | 11,675 | 16,192 | 13,677 | ||||
| Net errors and omissions | 7,368 | 7,922 | 9,262 | -6,513 | -6,357 | 10,976 | -10,355 | 5,751 | 3,886 | 8,640 | 4,562 | ||||
| 1From the start of 2000, new international financial service projects are no longer subject to the earlier certification and licensing procedures in operation for location in the IFSC and such projects can, therefore, locate anywhere in Ireland. Additions to existing IFSC projects, however, are still subject to the formal procedures. For statistical analysis purposes this table still shows the 'IFSC/non-IFSC' breakdown and the activities of all international financial service enterprises are covered under the IFSC heading. | |||||||||||||||
| 2Revised. | |||||||||||||||
| 3Adjusted for balance of payments purposes. | |||||||||||||||
| 4Secondary income flows to and from IFSC enterprises relate solely to non-life insurance transactions - see Background Notes. | |||||||||||||||
| 5See footnote 1 on Table 2b. | |||||||||||||||
| 6Includes financial derivatives; in the case of liabilities this category also includes life insurance liabilities to non-residents. Occasionally includes large capital transactions which cannot be shown in the Capital Account Balance due to confidentiality constraints. | |||||||||||||||
| Table 4a Current and Capital Accounts showing geographical¹ detail | € million | ||||||||||||||
| 2016 2 | 2017 2 | 2016 2 | 2017 2 | 2018 | |||||||||||
| Item | Year | Quarter 1 | Quarter 2 | Quarter 3 | Quarter 4 | Quarter 1 | Quarter 2 | Quarter 3 | Quarter 4 | Quarter 1 | |||||
| Current Account - Total | Inflows | 403,086 | 435,934 | 96,694 | 99,564 | 99,117 | 107,711 | 101,408 | 106,913 | 109,415 | 118,198 | 106,223 | |||
| Outflows | 414,458 | 411,009 | 95,988 | 104,119 | 100,341 | 114,010 | 96,352 | 110,216 | 95,655 | 108,786 | 96,671 | ||||
| Merchandise3 | Exports | 193,160 | 192,854 | 48,495 | 47,648 | 46,899 | 50,118 | 45,963 | 45,793 | 48,427 | 52,671 | 48,485 | |||
| Imports | 87,072 | 85,214 | 21,205 | 23,207 | 20,584 | 22,076 | 20,931 | 22,248 | 19,512 | 22,523 | 21,407 | ||||
| EMU | Exports | 50,542 | 54,529 | 12,380 | 12,691 | 11,935 | 13,536 | 14,241 | 12,688 | 13,992 | 13,608 | 12,000 | |||
| Imports | 27,421 | 28,509 | 6,225 | 6,936 | 6,671 | 7,589 | 7,555 | 7,516 | 6,376 | 7,062 | 7,286 | ||||
| Non-EMU | Exports | 142,618 | 138,326 | 36,115 | 34,957 | 34,964 | 36,582 | 31,722 | 33,105 | 34,436 | 39,063 | 36,486 | |||
| Imports | 59,651 | 56,704 | 14,980 | 16,272 | 13,913 | 14,486 | 13,375 | 14,732 | 13,136 | 15,461 | 14,120 | ||||
| EU | Exports | 81,848 | 84,741 | 20,246 | 20,004 | 19,111 | 22,487 | 22,014 | 20,518 | 21,074 | 21,135 | 18,755 | |||
| Imports | 51,121 | 53,833 | 11,939 | 12,832 | 12,317 | 14,033 | 13,464 | 13,889 | 12,471 | 14,009 | 13,569 | ||||
| Non-EU | Exports | 111,311 | 108,113 | 28,249 | 27,643 | 27,788 | 27,631 | 23,949 | 25,274 | 27,354 | 31,536 | 29,731 | |||
| Imports | 35,952 | 31,381 | 9,267 | 10,375 | 8,267 | 8,043 | 7,467 | 8,359 | 7,041 | 8,514 | 7,838 | ||||
| Services | Exports | 135,076 | 159,701 | 30,235 | 32,439 | 35,561 | 36,841 | 36,234 | 39,477 | 40,262 | 43,728 | 38,205 | |||
| Imports | 198,809 | 178,054 | 44,798 | 49,324 | 47,854 | 56,833 | 41,591 | 49,120 | 39,581 | 47,762 | 39,455 | ||||
| EMU | Exports | 34,684 | 38,818 | 7,429 | 7,891 | 9,698 | 9,666 | 9,025 | 9,638 | 9,659 | 10,496 | 9,315 | |||
| Imports | 37,956 | 43,459 | 8,705 | 9,771 | 9,318 | 10,162 | 9,483 | 11,070 | 9,631 | 13,275 | 10,233 | ||||
| Non-EMU | Exports | 100,391 | 120,885 | 22,806 | 24,547 | 25,863 | 27,175 | 27,209 | 29,840 | 30,603 | 33,233 | 28,890 | |||
| Imports | 160,854 | 134,594 | 36,094 | 39,553 | 38,536 | 46,671 | 32,107 | 38,050 | 29,950 | 34,487 | 29,221 | ||||
| EU | Exports | 66,263 | 74,074 | 14,583 | 15,552 | 17,986 | 18,142 | 16,998 | 18,497 | 18,784 | 19,795 | 17,741 | |||
| Imports | 54,624 | 62,191 | 12,783 | 13,660 | 13,503 | 14,678 | 13,779 | 15,491 | 14,243 | 18,678 | 15,148 | ||||
| Non-EU | Exports | 68,812 | 85,629 | 15,652 | 16,887 | 17,574 | 18,699 | 19,236 | 20,981 | 21,478 | 23,934 | 20,464 | |||
| Imports | 144,185 | 115,864 | 32,015 | 35,664 | 34,351 | 42,155 | 27,812 | 33,629 | 25,339 | 29,084 | 24,307 | ||||
| Primary Income | Inflows | 70,346 | 78,224 | 16,841 | 18,426 | 15,596 | 19,483 | 17,934 | 20,516 | 19,294 | 20,480 | 18,162 | |||
| Outflows | 120,260 | 137,996 | 27,842 | 29,769 | 30,021 | 32,628 | 31,617 | 36,163 | 34,123 | 36,093 | 33,133 | ||||
| EMU | Inflows | 28,974 | 28,638 | 7,845 | 6,573 | 5,913 | 8,643 | 6,573 | 7,378 | 7,273 | 7,414 | 6,953 | |||
| Outflows | 41,120 | 50,331 | 10,157 | 9,799 | 11,094 | 10,070 | 9,910 | 13,731 | 13,796 | 12,894 | 13,327 | ||||
| Non-EMU | Inflows | 41,373 | 49,586 | 8,996 | 11,854 | 9,683 | 10,840 | 11,361 | 13,138 | 12,021 | 13,066 | 11,209 | |||
| Outflows | 79,139 | 87,664 | 17,685 | 19,969 | 18,927 | 22,558 | 21,707 | 22,432 | 20,327 | 23,198 | 19,806 | ||||
| EU | Inflows | 46,556 | 49,597 | 12,199 | 11,337 | 9,794 | 13,226 | 11,753 | 12,523 | 12,380 | 12,941 | 12,193 | |||
| Outflows | 69,148 | 79,525 | 16,854 | 17,511 | 18,087 | 16,696 | 16,728 | 21,566 | 21,399 | 19,832 | 20,393 | ||||
| Non-EU | Inflows | 23,790 | 28,627 | 4,642 | 7,089 | 5,802 | 6,257 | 6,181 | 7,993 | 6,914 | 7,539 | 5,969 | |||
| Outflows | 51,111 | 58,472 | 10,988 | 12,257 | 11,934 | 15,932 | 14,890 | 14,597 | 12,725 | 16,260 | 12,740 | ||||
| Secondary Income | Inflows | 4,504 | 5,154 | 1,123 | 1,051 | 1,062 | 1,268 | 1,277 | 1,127 | 1,431 | 1,319 | 1,370 | |||
| Outflows | 8,317 | 9,744 | 2,143 | 1,820 | 1,881 | 2,473 | 2,213 | 2,685 | 2,438 | 2,408 | 2,676 | ||||
| EMU | Inflows | 1,470 | 1,846 | 336 | 359 | 322 | 453 | 420 | 280 | 524 | 622 | 445 | |||
| Outflows | 1,816 | 2,615 | 401 | 488 | 397 | 530 | 543 | 488 | 740 | 844 | 637 | ||||
| Non-EMU | Inflows | 3,034 | 3,308 | 787 | 692 | 740 | 815 | 857 | 847 | 907 | 697 | 925 | |||
| Outflows | 6,501 | 7,128 | 1,742 | 1,332 | 1,484 | 1,943 | 1,670 | 2,197 | 1,697 | 1,564 | 2,039 | ||||
| EU | Inflows | 3,474 | 4,112 | 901 | 831 | 820 | 922 | 1,015 | 853 | 1,140 | 1,104 | 1,029 | |||
| Outflows | 6,512 | 7,908 | 1,747 | 1,447 | 1,437 | 1,881 | 1,768 | 2,209 | 1,973 | 1,958 | 2,163 | ||||
| Non-EU | Inflows | 1,030 | 1,041 | 222 | 220 | 242 | 346 | 261 | 274 | 291 | 215 | 341 | |||
| Outflows | 1,805 | 1,834 | 396 | 373 | 444 | 592 | 445 | 475 | 464 | 450 | 512 | ||||
| Balance on Current Account | -11,373 | 24,924 | 705 | -4,555 | -1,224 | -6,299 | 5,056 | -3,303 | 13,760 | 9,411 | 9,552 | ||||
| Balance on Capital Account | -4,331 | -28,168 | -2,670 | -586 | 161 | -1,236 | -14,100 | -6,237 | -5,971 | -1,860 | -437 | ||||
| 1The term ‘EMU’ means the area represented by the 19 Member States participating in Monetary Union since the enlargement of the Euro area on 1 January 2015 to include Lithuania.The term ‘EU’ relates to transactions between residents of Ireland and other residents of the EU-28 area. All data shown on this table relates to EMU-19 and EU-28. | |||||||||||||||
| 2Revised. | |||||||||||||||
| 3Adjusted for balance of payments purposes. | |||||||||||||||
| Table 4b Financial Account¹ showing geographical² detail | € million | ||||||||||||||
| 2016 3 | 2017 3 | 2016 3 | 2017 3 | 2018 | |||||||||||
| Item | Year | Quarter 1 | Quarter 2 | Quarter 3 | Quarter 4 | Quarter 1 | Quarter 2 | Quarter 3 | Quarter 4 | Quarter 1 | |||||
| Direct Investment | Abroad | 27,180 | -34,690 | 32,623 | -2,906 | 1,245 | -3,782 | 127 | 15,417 | 8,118 | -58,352 | 3,520 | |||
| In Ireland | 35,607 | -1,109 | 20,343 | -2,613 | 11,766 | 6,111 | 4,796 | 11,231 | 4,049 | -21,185 | -22,818 | ||||
| EMU | Abroad | -4,713 | -51,544 | 11,947 | -9,077 | -618 | -6,965 | -2,965 | 22,996 | 4,650 | -76,225 | -27,405 | |||
| In Ireland | -37,734 | 52,407 | -7,933 | -1,285 | 441 | -28,957 | 13,673 | 39,363 | 2,167 | -2,796 | -65,119 | ||||
| Non-EMU | Abroad | 31,892 | 16,855 | 20,675 | 6,171 | 1,863 | 3,183 | 3,092 | -7,578 | 3,468 | 17,873 | 30,926 | |||
| In Ireland | 73,343 | -53,515 | 28,277 | -1,328 | 11,326 | 35,068 | -8,877 | -28,131 | 1,882 | -18,389 | 42,301 | ||||
| EU | Abroad | 6,500 | -46,181 | 19,408 | -6,673 | -477 | -5,758 | -2,466 | 26,266 | 3,925 | -73,906 | -29,558 | |||
| In Ireland | -25,915 | 55,127 | -36,933 | 10,294 | 661 | 63 | 10,980 | 40,943 | -1,318 | 4,522 | -90,979 | ||||
| Non-EU | Abroad | 20,680 | 11,491 | 13,215 | 3,767 | 1,722 | 1,976 | 2,593 | -10,848 | 4,193 | 15,553 | 33,078 | |||
| In Ireland | 61,523 | -56,236 | 57,276 | -12,907 | 11,106 | 6,048 | -6,184 | -29,712 | 5,367 | -25,707 | 68,161 | ||||
| Portfolio Investment | Assets | 116,439 | 253,689 | 7,237 | 23,453 | 32,770 | 52,979 | 79,441 | 40,091 | 64,731 | 69,426 | 80,507 | |||
| Liabilities | 88,727 | 309,004 | 14,734 | 20,520 | 22,385 | 31,088 | 92,665 | 85,711 | 64,133 | 66,495 | 73,057 | ||||
| EMU | Assets | 16,755 | 51,988 | -2,663 | -4,202 | 12,051 | 11,569 | 15,981 | 11,707 | 6,660 | 17,640 | 11,470 | |||
| Liabilities | 33,976 | 106,093 | 10,326 | -3,551 | 16,265 | 10,936 | 37,925 | 29,997 | 15,955 | 22,216 | 25,761 | ||||
| Non-EMU | Assets | 99,684 | 201,700 | 9,900 | 27,655 | 20,719 | 41,410 | 63,460 | 28,384 | 58,071 | 51,785 | 69,037 | |||
| Liabilities | 54,750 | 202,911 | 4,408 | 24,070 | 6,120 | 20,152 | 54,740 | 55,714 | 48,178 | 44,279 | 47,296 | ||||
| EU | Assets | 47,876 | 121,500 | -3,062 | 3,848 | 18,179 | 28,911 | 40,562 | 31,780 | 6,285 | 42,873 | 14,095 | |||
| Liabilities | 81,978 | 271,410 | 10,213 | 13,439 | 25,683 | 32,643 | 82,391 | 74,686 | 48,901 | 65,432 | 55,205 | ||||
| Non-EU | Assets | 68,562 | 132,189 | 10,299 | 19,605 | 14,591 | 24,067 | 38,879 | 8,312 | 58,446 | 26,552 | 66,412 | |||
| Liabilities | 6,748 | 37,595 | 4,521 | 7,080 | -3,298 | -1,555 | 10,274 | 11,026 | 15,232 | 1,063 | 17,852 | ||||
| Other Investment4 | Assets | -43,731 | 94,497 | -21,519 | -18,012 | 2,689 | -6,889 | -22,578 | 33,470 | 33,034 | 50,571 | 31,514 | |||
| Liabilities | -14,657 | 1,321 | -22,938 | -3,943 | 10,351 | 1,873 | -21,173 | -4,011 | 26,261 | 244 | 51,604 | ||||
| EMU | Assets | -11,213 | 35,191 | -5,840 | -8,336 | -5,745 | 8,708 | 5,232 | 9,471 | -3,960 | 24,448 | 16,419 | |||
| Liabilities | 7,924 | -9,214 | -6,231 | 16,403 | -5,088 | 2,840 | 404 | -5,244 | 3,805 | -8,179 | 5,931 | ||||
| Non-EMU | Assets | -32,517 | 59,305 | -15,678 | -9,676 | 8,434 | -15,597 | -27,811 | 23,999 | 36,994 | 26,123 | 15,094 | |||
| Liabilities | -22,580 | 10,535 | -16,707 | -20,346 | 15,440 | -967 | -21,577 | 1,233 | 22,456 | 8,423 | 45,672 | ||||
| EU | Assets | 47,767 | 122,297 | 6,532 | 37,225 | 8,055 | -4,045 | 29,803 | 23,528 | 24,543 | 44,423 | 34,749 | |||
| Liabilities | 39,806 | 40,803 | -2,966 | 20,080 | 6,280 | 16,412 | 18,206 | 7,035 | 8,193 | 7,369 | 33,548 | ||||
| Non-EU | Assets | -91,498 | -27,800 | -28,050 | -55,238 | -5,366 | -2,844 | -52,381 | 9,942 | 8,491 | 6,148 | -3,235 | |||
| Liabilities | -54,462 | -39,481 | -19,972 | -24,023 | 4,071 | -14,538 | -39,378 | -11,047 | 18,068 | -7,124 | 18,055 | ||||
| Reserve Assets | 1,456 | 399 | 1,095 | -224 | 379 | 206 | -101 | 163 | 235 | 102 | -22 | ||||
| Balance on Financial Account | -8,335 | 4,678 | 7,297 | -11,653 | -7,420 | 3,441 | -19,400 | -3,789 | 11,675 | 16,192 | 13,677 | ||||
| Net errors and omissions | 7,368 | 7,922 | 9,262 | -6,513 | -6,357 | 10,976 | -10,355 | 5,751 | 3,886 | 8,640 | 4,562 | ||||
| 1See footnote 1 on Table 2b. | |||||||||||||||
| 2The term ‘EMU’ means the area represented by the 19 Member States participating in Monetary Union since the enlargement of the Euro area on 1 January 2015 to include Lithuania.The term ‘EU’ relates to transactions between residents of Ireland and other residents of the EU-28 area. All data shown on this table relates to EMU-19 and EU-28. | |||||||||||||||
| 3Revised. | |||||||||||||||
| 4Includes financial derivatives; in the case of liabilities this category also includes life insurance liabilities to non-residents. Occasionally includes large capital transactions which cannot be shown in the Capital Account Balance due to confidentiality constraints. | |||||||||||||||
The balance of payments (BOP) is a statistical statement that summarises, for a specific time period, the economic transactions of the residents of an economy with the rest of the world.
The balance of payments presentation consists of three tables or accounts, the Current Account, the Capital Account and the Financial Account. The current account consists of trade in merchandise and services, as well as primary and secondary income account inflows and outflows. The capital account covers capital transfers and the acquisition and disposal of non-produced, non-financial assets. The financial account is concerned with transactions in foreign financial assets and liabilities, distinguishing the functional type of investment i.e. direct, portfolio and other investment (including transactions in financial derivatives) and reserve assets.
BOP transactions, in principle, should be recorded on an accruals basis using market valuation. In practice, the collection system (see below) is designed to adhere to this approach and, for the most part, the valuations reported are either market values or a close approximation.
For more detailed methodological information see Methodology Documents: BOP Quarterly Statistical Compilation Methodology Updated March 2018 (PDF 240KB)
 Hide Background Notes
Scan the QR code below to view this release online or go to
http://www.cso.ie/en/releasesandpublications/er/bop/balanceofinternationalpaymentsq12018/
 Show Table 1 Summary of Current, Capital, Financial Account Balances and Net Errors and Omissions
 Hide Table 1 Summary of Current, Capital, Financial Account Balances and Net Errors and Omissions