
This release has been compiled during the COVID-19 crisis. The results contained in this release reflect some of the economic aspects of the COVID-19 situation.
It is important to note that the results presented in the survey represent responding enterprises only. The CSO acknowledges that non-response may be related to whether businesses are adversely impacted by COVID-19. If this were the case, there is potential for bias in these estimates that weighting procedures would not correct for. As such, the results presented here are unweighted.
For further information see Background Notes. Business Impact of COVID-19
| Current trading status on 3 May 2020 | ||
| % of responding enterprises | ||
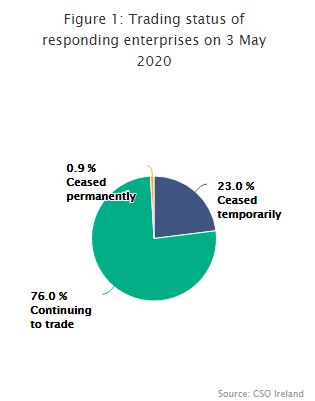
| Sector | Continuing to trade | Ceased trading, (temporarily or permanently) |
| Industry | 85.5 | 14.5 |
| Construction | 33.3 | 66.7 |
| Distribution | 77.6 | 22.4 |
| Services | 79.7 | 20.3 |
| Total | 76.0 | 23.9 |
The Business Impact of COVID-19 Survey (BICS) has been created to measure and report quickly on the impact of COVID-19 on business in Ireland. The second wave of the survey was collected in the week commencing 3 May 2020.
A total of 3,000 enterprises were surveyed online for BICS Wave Two, with 24.5% of sampled enterprises completing the survey. The survey reports:
| Please note that not all businesses may be in a position to respond to the Business Impact of COVID-19 Survey. Therefore, the results will only reflect the characteristics of those who responded. |
| For long labels below use to display on multiple lines | Continuing to trade | Ceased trading temporarily or permanently |
|---|---|---|
| Industry | 85.5 | 14.5 |
| Construction | 33.3 | 66.7 |
| Distribution | 77.6 | 22.4 |
| Services | 79.7 | 20.3 |
| Total | 76 | 23.9 |
Two-thirds of Construction enterprises ceased trading either temporarily or permanently
| For long labels below use to display on multiple lines | 20 April-3 May | 4 May-17 May |
|---|---|---|
| 75 to 100% less than normal | 32.9 | 30.5 |
| 50 to 74% less than normal | 11.2 | 14.3 |
| 25 to 49% less than normal | 14.5 | 14.7 |
| 10 to 24% less than normal | 11.8 | 13.7 |
| At or close to normal expectation | 20.7 | 20.3 |
| Higher than normal | 8.9 | 6.6 |
Seven in ten enterprises had lower turnover due to COVID-19 over the two-week period from 20 April to 3 May 2020.
| For long labels below use to display on multiple lines | Imports | Exports |
|---|---|---|
| Decrease | 50 | 53.8 |
| Increase | 2.2 | 1.8 |
| Not affected | 42.1 | 37.7 |
| Don't know | 5.7 | 6.6 |
Exports decreased for over half of responding enterprises
| For long labels below use to display on multiple lines | Purchases of materials, goods or services | Sales of materials, goods or services |
|---|---|---|
| Prices have decreased more than normal | 2.5 | 5.5 |
| Prices have increased more than normal | 9.2 | 3 |
| Prices have not changed more than normal | 58.6 | 75.5 |
| Some prices have increased; some prices have decreased | 16.7 | 8.1 |
| Don't know | 13 | 7.9 |
Prices remained unchanged for majority of enterprises
| For long labels below use to display on multiple lines | Workforce changes |
|---|---|
| Decreased working hours | 36.7 |
| Increased working hours | 5.2 |
| Staff placed on paid leave | 17.8 |
| Staff let go temporarily | 33.1 |
| Staff let go permanently | 5.9 |
| Staff hired temporarily | 4 |
| Staff hired permanently | 0.8 |
| Paused or cancelled planned recruitment | 23 |
| Other | 12.7 |
| No changes to the workforce | 21.2 |
Almost a quarter of enterprises have either paused or cancelled planned recruitment
| For long labels below use to display on multiple lines | Workplace changes |
|---|---|
| Implemented remote working | 69.2 |
| Implemented working arrangements to facilitate social distancing | 53.2 |
| Reduced business operating hours | 24.6 |
| Other | 35.4 |
| No changes implemented | 4.1 |
Social distancing in the workplace implemented by over half of respondents
| For long labels below use to display on multiple lines | Remotely | Normal working location | Other (deployed elsewhere, on leave etc.) |
|---|---|---|---|
| SMEs (<250) | 28.8 | 21.7 | 18.8 |
| Large (250+) | 38 | 31 | 17.1 |
| Total | 30.5 | 23.4 | 18.5 |
Three in ten businesses had most of their workforce working remotely
| For long labels below use to display on multiple lines | Don't know | High impact | Moderate impact | Low impact | No impact |
|---|---|---|---|---|---|
| Reduced domestic demand | 4.5 | 46.7 | 17.9 | 11.1 | 19.8 |
| Restrictions on business operations | 3.3 | 40.4 | 21.7 | 21 | 13.7 |
| Lower productivity | 4.5 | 33.7 | 18.6 | 19.8 | 23.3 |
| Cashflow difficulties | 3.7 | 27.4 | 26.1 | 15.6 | 27.1 |
| Logistics issues | 7.6 | 18.3 | 22.9 | 26.1 | 25 |
| Reduced international demand | 16 | 19.2 | 10.7 | 10 | 44 |
| Supply chain interruptions | 7.9 | 16 | 24.6 | 24.4 | 27.1 |
| Liquidity issues | 8.6 | 15.1 | 19.7 | 15.4 | 41.1 |
Reduced domestic demand had a high impact on business for nearly half of responding enterprises
| For long labels below use to display on multiple lines | Innovations |
|---|---|
| Adopted new methods of providing products and services | 31.1 |
| Adopted new methods of communication | 52 |
| Introduced new products | 8.5 |
| Repurposed production (e.g. to supply PPE, hand sanitiser, etc.) | 10.4 |
| Other | 7.9 |
New methods of providing products or services during the COVID-19 crisis adopted by nearly a third of enterprises
| For long labels below use to display on multiple lines | SMEs (<250) | Large (250+) | Total |
|---|---|---|---|
| Decreased | 5.9 | 6.2 | 5.9 |
| Increased | 4.5 | 3.1 | 4.3 |
| No change | 67.2 | 72.1 | 68.1 |
| Don't know | 22.4 | 18.6 | 21.7 |
No change in ability to access finance according to over two-thirds of responding enterprises
Almost half of responding enterprises expressed confidence in having financial resources to continue operating for longer than six months
| For long labels below use to display on multiple lines | Continue to operate |
|---|---|
| Up to 1 month | 5.5 |
| Up to 3 months | 16.8 |
| Up to 6 months | 13.9 |
| Longer than 6 months | 49 |
| Not confident | 3 |
| Don't know | 11.8 |
| For long labels below use to display on multiple lines | Not availed of Government support | Availed of Government support |
|---|---|---|
| SMEs (<250) | 46.8 | 53.2 |
| Large (250+) | 56.6 | 43.4 |
| Total | 48.6 | 51.4 |
Over half of enterprises availed of Government supports schemes
| Table 1 Estimated impact on turnover, 20 April to 17 May 2020 | ||
| % of responding enterprises | ||
| Estimated impact on turnover | 20 Apr-3 May | 4 May-17 May |
| 75-100% less than normal | 32.9 | 30.5 |
| 50-74% less than normal | 11.2 | 14.3 |
| 25-49% less than normal | 14.5 | 14.7 |
| 10-24% less than normal | 11.8 | 13.7 |
| At or close to normal expectation | 20.7 | 20.3 |
| Higher than normal | 8.9 | 6.6 |
| Total | 100.0 | 100.0 |
| Table 2 COVID-19 impact on international trade, 20 April to 3 May 2020 | ||
| % of responding enterprises | ||
| Impact on international trade | Exports | Imports |
| Decrease | 53.8 | 50.0 |
| Increase | 1.8 | 2.2 |
| Not affected | 37.7 | 42.1 |
| Don't know | 6.6 | 5.7 |
| Total | 100.0 | 100.0 |
| Table 3 COVID-19 impact on prices, 20 April to 3 May 2020 | ||
| % of responding enterprises | ||
| Impact on prices | Purchases of materials, goods or services | Sales of materials, goods or services |
| Prices have decreased more than normal | 2.5 | 5.5 |
| Prices have increased more than normal | 9.2 | 3.0 |
| Prices have not changed more than normal | 58.6 | 75.5 |
| Some prices have increased; some prices have decreased | 16.7 | 8.1 |
| Don't know | 13.0 | 7.9 |
| Total | 100.0 | 100.0 |
| Table 4 Workforce changes due to COVID-19 up to 3 May 2020 | |
| % of responding enterprises | |
| Decreased working hours | 36.7 |
| Increased working hours | 5.2 |
| Staff placed on paid leave | 17.8 |
| Staff let go temporarily | 33.1 |
| Staff let go permanently | 5.9 |
| Staff hired temporarily | 4.0 |
| Staff hired permanently | 0.8 |
| Paused or cancelled planned recruitment | 23.0 |
| Other | 12.7 |
| No changes to the workforce | 21.2 |
| Table 5 Workplace changes due to COVID-19 up to 3 May 2020 | |
| % of responding enterprises | |
| Implemented remote working | 69.2 |
| Implemented working arrangements to facilitate social distancing | 53.2 |
| Reduced business operating hours | 24.6 |
| Other | 35.4 |
| No changes implemented | 4.1 |
| Table 6 Working locations of majority of staff by size class, 20 April to 3 May 2020 | |||
| % of responding enterprises | |||
| Majority of staff working | SMEs | Large | Total |
| (<250) | (250+) | ||
| Remotely | 28.8 | 38.0 | 30.5 |
| Normal working location | 21.7 | 31.0 | 23.4 |
| Other (deployed elsewhere, on leave etc.) | 18.8 | 17.1 | 18.5 |
| Table 7 COVID-19 impact on enterprises by level of impact, 20 April to 3 May 2020 | |||||
| % of responding enterprises | |||||
| Impact on enterprises | No impact | Low impact | Moderate impact | High impact | Don't know |
| Reduced domestic demand | 19.8 | 11.1 | 17.9 | 46.7 | 4.5 |
| Restrictions on business operations | 13.7 | 21.0 | 21.7 | 40.4 | 3.3 |
| Lower productivity | 23.3 | 19.8 | 18.6 | 33.7 | 4.5 |
| Cashflow difficulties | 27.1 | 15.6 | 26.1 | 27.4 | 3.7 |
| Logistics issues | 25.0 | 26.1 | 22.9 | 18.3 | 7.6 |
| Reduced international demand | 44.0 | 10.0 | 10.7 | 19.2 | 16.0 |
| Supply chain interruptions | 27.1 | 24.4 | 24.6 | 16.0 | 7.9 |
| Liquidity issues | 41.1 | 15.4 | 19.7 | 15.1 | 8.6 |
| Table 8 Innovations adopted due to COVID-19 up to 3 May 2020 | |
| % of responding enterprises | |
| Adopted new methods of providing products and services | 31.1 |
| Adopted new methods of communication | 52.0 |
| Introduced new products | 8.5 |
| Repurposed production to supply products needed during COVID-19 crisis (e.g. PPE, hand sanitiser or other in-demand products etc.) | 10.4 |
| Other | 7.9 |
| Table 9 Change in access to finance by size class, 20 April to 3 May 2020 | |||
| % of responding enterprises | |||
| Access to finance | SMEs | Large | Total |
| (<250) | (250+) | ||
| Decreased | 5.9 | 6.2 | 5.9 |
| Increased | 4.5 | 3.1 | 4.3 |
| No change | 67.2 | 72.1 | 68.1 |
| Don't know | 22.4 | 18.6 | 21.7 |
| Total | 100.0 | 100.0 | 100.0 |
| Table 10 Confidence in financial resources to continue operating throughout the COVID-19 crisis, 20 April to 3 May 2020 | |
| % of responding enterprises | |
| Up to 1 month | 5.5 |
| Up to 3 months | 16.8 |
| Up to 6 months | 13.9 |
| Longer than 6 months | 49.0 |
| Not confident | 3.0 |
| Don't know | 11.8 |
| Total | 100.0 |
| Table 11 Availing of Government supports by size class, 20 April to 3 May 2020 | ||||
| % of responding enterprises | ||||
| SMEs | Large | Total | ||
| (<250) | (250+) | |||
| Availed of Government support* | 53.2 | 43.4 | 51.4 | |
| of which: | ||||
| Revenue Temporary COVID-19 Wage Subsidy Scheme | 51.0 | 42.6 | 49.5 | |
| COVID-19 Working Capital Loan Scheme (SBCI) | 3.3 | 0.0 | 2.7 | |
| Other | 4.8 | 3.1 | 4.5 | |
| Not availed of Government support | 46.8 | 56.6 | 48.6 | |
| Total | 100.0 | 100.0 | 100.0 | |
| * Note that some enterprises have availed of more than one type if government support. | ||||
The Business Impact of COVID-19 Survey (BICS) has been created to measure and report quickly on key features of the impact of the COVID-19 crisis on business in Ireland.
The survey is being conducted online and covers a sample of 3,000 enterprises. The first wave of the survey was collected in the week commencing 20 April 2020, with the second wave collected in the week commencing 4 May 2020. Updated waves of the survey will be collected regularly going forward, with the next wave to be issued on 2 June 2020.
The survey was collected from enterprises on a voluntary basis under Section 24 of the Statistics Act, 1993.
The information collected in the survey is confidential under the Statistics Act and will only be used by the Central Statistics Office for the compilation of aggregate statistics. The CSO has checked the statistical outputs of the survey to ensure that tables do not disclose details of any company. The raw data will not be shared with any other organisations.
The CSO would like to thank businesses that responded to the Business Impact of COVID-19 Survey.
The reporting statistical unit for the BICS is the enterprise. The sample size for the BICS is 3,000 enterprises. The enterprise is defined as the smallest combination of legal units that is an organisational unit producing goods and/or services, which benefits from a certain degree of autonomy in decision-making.
There were 736 responding enterprises to BICS Wave Two, meaning a response rate of 24.5%. It is important to note that the results of the survey apply to respondents only, and that no imputation or estimation procedures have been used in the case of non-response. The CSO acknowledges that not all businesses may be in a position to respond to the survey. Therefore, as the results of the survey are unweighted, they may only reflect the characteristics of those who have responded.
Enterprises of all size classes were surveyed. The sectors of economic activity included in the survey were determined in accordance with the NACE Rev. 2 classification scheme, which is the European Commission’s classification system for economic activity. The NACE Rev. 2 sectors included in the survey were as follows:
Sector B: Mining and quarrying
Sector C: Manufacturing
Sector D: Electricity, gas, steam and air conditioning supply
Sector E: Water supply; sewerage, waste management and remediation activities
Sector F: Construction
Sector G: Wholesale and retail trade; Repair of motor vehicles and motorcycles
Sector H: Transportation and storage
Sector I: Accommodation and food service activities
Sector J: Information and communication
Sector K: Financial and insurance activities
Sector L: Real estate activities
Sector M: Professional, scientific and technical activities
Sector N: Administrative and support service activities
Sector R: Arts, entertainment and recreation
Sector S: Other service activities
Please note that some more granular NACE Rev. 2 descriptions were also referenced in the text of this release. For further information on the NACE Rev. 2 classification scheme, please click Classifications
The survey is collected via an online questionnaire. The topics covered are about how the COVID-19 crisis has affected business and what steps have been taken as a result – e.g. in relation to the level of business, workforce and organisational changes, access to finance, and availing of Government support schemes.
The following is a link to the questionnaire for each wave of the BICS survey:Business Impact of COVID-19 Survey
Size Class
For the BICS, the size class of an enterprise is determined by the number of persons engaged associated with the enterprise as follows:
| Size Class | Number of Persons Engaged |
| Micro | 0 - 9 |
| Small | 10 - 49 |
| Medium | 50 - 249 |
| SMEs | 0 - 249 |
| Large | 250+ |
A Small or Medium Enterprise (SME) is essentially an amalgamation of the Micro, Small and Medium categories, i.e. having 0-249 persons engaged.
Sector
In the above results, there are cases where several NACE Rev. 2 categories are presented in aggregate form as follows:
| Sector | NACE Rev. 2 Category |
| Industry | B-E |
| Construction | F |
| Distribution | G |
| Services | H-N, R-S |
Other Breakdowns
Many of the breakdowns in this release are based on the enterprise’s own best estimate at a point in time. The qualitative nature of these breakdowns has been chosen to limit burden on respondents.
 Hide Background Notes
Scan the QR code below to view this release online or go to
http://www.cso.ie/en/releasesandpublications/er/bic19/businessimpactofcovid-19survey20aprilto3may2020/
 Show Table 1 Estimated impact on turnover, 20 April to 17 May 2020
 Hide Table 1 Estimated impact on turnover, 20 April to 17 May 2020