
| Energy Consumption by Energy Product 2013-2017 | |||||
| €m ex. VAT | |||||
| Energy Product | 2013 | 2014 | 2015 | 2016 | 2017 |
| Electricity | 2,744 | 2,667 | 2,578 | 2,567 | 2,586 |
| Natural Gas | 2,032 | 1,746 | 1,570 | 1,747 | 1,776 |
| Petroleum Fuels | 532 | 529 | 423 | 389 | 407 |
| Solid Fuels | 462 | 453 | 497 | 489 | 443 |
| Renewable Energy (incl. Waste) | 62 | 70 | 69 | 80 | 96 |
| Road Transport Fuels | 1,421 | 1,388 | 1,352 | 1,079 | 1,093 |
| Rail Transport Fuels | 65 | 59 | 49 | 38 | 30 |
| Aviation Transport Fuels | 1,789 | 1,671 | 1,298 | 1,175 | 1,550 |
| Total | 9,107 | 8,583 | 7,838 | 7,563 | 7,981 |
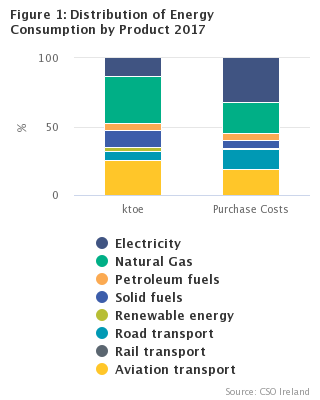
Purchases of electricity accounted for 32% of the total energy purchase costs by enterprises in 2017 (see Headline Table and Figure 1). Purchases of natural gas accounted for a further 22% followed by aviation transport fuels (19%) and road transport fuels (14%). Total energy costs rose from €7.9 billion in 2009 (the first year of this series) to €9.2 billion in 2012. They decreased to €7.6 billion in 2016 and then increased to €8 billion in 2017 (see Table 2C).
| This release is based on the National Accounts residence principle. This means that energy used abroad by enterprises resident in Ireland is included e.g. flights between other countries by an Irish resident airline. Energy used in Ireland by foreign resident enterprises is not included. See Background Notes for more information. |
The mix of energy products used by Irish enterprises in 2017 is given in Figure 1. In terms of kilotonnes of oil equivalent (ktoe), natural gas accounted for 34% of the total ktoe with aviation fuels accounting for a further 25%. Electricity comprised another 13% and solid fuels an additional 12% (see Table 2A).
In monetary terms, the proportion of total fuel purchase costs accounted for by each energy product in 2017 was quite different than the ktoe distribution (see Tables 2A and 2C). This difference is partly accounted for by electricity being used for final energy consumption whereas a substantial proportion of natural gas is used for intermediate consumption to make electricity (see Table 4A).
The Industry sector accounted for 54% of total non-domestic energy consumption in 2017 in terms of ktoe. The energy products used by industry have a lower relative cost than those used by the Services sector. Hence the proportion of purchase costs accounted for by the Industry sector was 41% in 2017 compared with 59% of fuel purchase costs being paid for by the Services sector. The total consumption by industry and services increased by 0.5% in quantity terms (ktoe) in 2017 and rose by 5.5% in cost terms (see Tables 1A and 1B).
The use of energy from renewables and from waste increased from 214 ktoe in 2009 to 378 ktoe in 2017 or by 77% over the eight years (see Table 2A).
| Manufacture of Food, Beverages and Tobacco | Manufacture of Rubber, Plastic and Non-metallic Mineral Products | Manufacture of Basic Metals and Metal Products | Electricity and Gas | Wholesale, Retail and Vehicle Repair | Transportation and Storage | Public Administration | |
| ktoe | 6 | 4 | 5 | 30 | 4 | 30 | 3 |
| Purchase Costs | 6 | 3 | 2 | 19 | 8 | 27 | 6 |
Tables 3A and 3B show the distribution of ktoe and purchase costs by NACE sector. The Electricity and Gas NACE sector (NACE 35) accounted for 30% of ktoe but for only 19% of costs. The Transport NACE sector (NACE 49-53) comprised 30% of ktoe and 27% of costs (international flights by Irish airlines accounted for a large proportion of this activity).
Tables 4A to 4I show the quantity of fuels used by each NACE sector in each year. The Electricity and Gas NACE sector (NACE 35) used 92% of Solid Fuels ktoe in 2017. The Manufacturing NACE sector (NACE 10-33) used 56% of Renewable Energy in 2017 and the Transport NACE sector (NACE 49-53) used 43% of Road Transport ktoe (see Table 4A). The corresponding data for purchase costs by each NACE sector in each year is shown in Tables 5A to 5I.
| ktoe | Purchase Costs | |
| 2009 | 46 | 29 |
| 2010 | 47 | 29 |
| 2011 | 44 | 26 |
| 2012 | 44 | 24 |
| 2013 | 45 | 26 |
| 2014 | 44 | 24 |
| 2015 | 44 | 25 |
| 2016 | 46 | 28 |
| 2017 | 44 | 27 |
Table 6A and Figure 3 shows the proportion of ktoe accounted for by the Emissions Trading Scheme sector. In 2009, 46% of ktoe was used by ETS installations. This proportion decreased to 44% in 2017. The corresponding data for purchase costs is shown in Table 6C. ETS companies accounted for 29% of total fuel costs in 2009. By 2012, ETS represented 24% of the total fuel costs. The proportion increased to 28% in 2016 and then decreased to 27% in 2017.
Table 7A shows the distribution of energy consumption by county. In 2017, Dublin consumed 65% of the total ktoe followed by Cork with 8% and Limerick with 6%. The corresponding shares of total energy costs are given in Figure 4 and Table 7B. Users should note that all activity was classified to the county that an enterprises headquarters is located in.
| Dublin | Cork | Kildare | Limerick | Meath | Galway | Tipperary | Offaly | |
| Counties | 59 | 9 | 5 | 4 | 2 | 2 | 2 | 2 |
| Table 1A Energy Consumption in ktoe by Sector 2009-2017 | |||||||||
| ktoe | |||||||||
| Sector | 2009 | 2010 | 2011 | 2012 | 2013 | 2014 | 2015 | 2016 | 2017 |
| Industry | 7,089 | 7,281 | 6,650 | 6,759 | 6,432 | 6,745 | 6,665 | 7,428 | 7,253 |
| Services | 5,518 | 5,705 | 5,779 | 5,874 | 5,532 | 5,312 | 5,691 | 6,003 | 6,243 |
| Total (ktoe) | 12,606 | 12,986 | 12,429 | 12,633 | 11,964 | 12,057 | 12,355 | 13,432 | 13,496 |
| Table 1B Energy Consumption in Thousand Euro by Sector 2009-2017 | |||||||||
| €000 | |||||||||
| Sector | 2009 | 2010 | 2011 | 2012 | 2013 | 2014 | 2015 | 2016 | 2017 |
| Industry | 3,462,069 | 3,407,621 | 3,202,552 | 3,272,356 | 3,477,110 | 3,463,096 | 3,088,652 | 3,222,372 | 3,271,045 |
| Services | 4,439,801 | 4,851,897 | 5,530,005 | 5,902,090 | 5,629,797 | 5,120,304 | 4,749,029 | 4,340,834 | 4,709,769 |
| Total (€000 excl. VAT) | 7,901,870 | 8,259,518 | 8,732,558 | 9,174,446 | 9,106,907 | 8,583,400 | 7,837,681 | 7,563,207 | 7,980,813 |
| Table 2A Energy Consumption in ktoe by Detailed Energy Product 2009-2017 | |||||||||
| ktoe | |||||||||
| Energy Product | 2009 | 2010 | 2011 | 2012 | 2013 | 2014 | 2015 | 2016 | 2017 |
| Electricity | 1,690 | 1,699 | 1,766 | 1,702 | 1,709 | 1,703 | 1,674 | 1,798 | 1,816 |
| Total Natural Gas | 4,275 | 4,635 | 4,073 | 3,888 | 3,905 | 3,869 | 3,742 | 4,473 | 4,586 |
| of which: | |||||||||
| Natural Gas (excl. CHP) | 3,400 | 3,693 | 3,363 | 3,229 | 3,286 | 3,127 | 3,068 | 3,727 | 3,847 |
| Combined Heat and Power Plants | 875 | 941 | 710 | 660 | 619 | 742 | 674 | 745 | 739 |
| Total Petroleum Fuels | 849 | 817 | 693 | 722 | 719 | 760 | 725 | 739 | 722 |
| of which: | |||||||||
| Heavy Fuel Oil | 317 | 320 | 273 | 264 | 242 | 223 | 163 | 162 | 148 |
| Diesel/Gas Oil/Marked Gas Oil | 291 | 298 | 227 | 232 | 237 | 268 | 267 | 262 | 254 |
| Kerosene | 65 | 64 | 61 | 66 | 77 | 73 | 79 | 84 | 79 |
| Liquid Petroleum Gas | 61 | 62 | 64 | 70 | 75 | 83 | 92 | 97 | 109 |
| Petroleum Coke | 115 | 73 | 68 | 91 | 88 | 113 | 124 | 133 | 132 |
| Total Solid Fuels | 1,589 | 1,622 | 1,640 | 1,995 | 1,715 | 1,732 | 1,929 | 1,881 | 1,584 |
| of which: | |||||||||
| Coal | 979 | 1,099 | 1,137 | 1,407 | 1,178 | 1,163 | 1,360 | 1,339 | 1,070 |
| Peat | 610 | 523 | 503 | 588 | 537 | 569 | 569 | 542 | 514 |
| Total Renewable Energy (incl. Waste) | 214 | 271 | 264 | 294 | 284 | 344 | 337 | 362 | 378 |
| of which: | |||||||||
| Wood Biomass | 116 | 167 | 151 | 162 | 153 | 185 | 164 | 208 | 203 |
| Biogas | 4 | 5 | 11 | 11 | 9 | 12 | 12 | 12 | 12 |
| Landfill Gas | 43 | 45 | 44 | 43 | 40 | 48 | 51 | 43 | 43 |
| Tallow | 42 | 41 | 37 | 36 | 29 | 36 | 36 | 23 | 32 |
| Wind Turbines | 0 | 0 | 1 | 1 | 0 | 1 | 1 | 2 | 3 |
| Solid Recovered Fuel | 9 | 14 | 19 | 41 | 53 | 62 | 72 | 74 | 86 |
| Total Road Transport Fuels | 1,212 | 1,162 | 1,002 | 1,001 | 1,035 | 1,050 | 1,108 | 947 | 935 |
| of which: | |||||||||
| Road Transport Petrol | 42 | 43 | 28 | 25 | 32 | 27 | 27 | 27 | 28 |
| Road Transport Diesel | 1,167 | 1,114 | 968 | 970 | 996 | 1,016 | 1,072 | 915 | 898 |
| Road Transport Biodiesel | 3 | 5 | 6 | 6 | 7 | 7 | 7 | 5 | 9 |
| Other Road Transport Fuels | 0 | 0 | 0 | 0 | 0 | 0 | 0 | 0 | 0 |
| Total Rail Transport Fuels | 46 | 44 | 44 | 43 | 42 | 39 | 39 | 41 | 42 |
| of which: | |||||||||
| Rail Transport Diesel | 42 | 40 | 40 | 39 | 39 | 36 | 36 | 37 | 38 |
| Rail Transport Electricity | 4 | 4 | 4 | 4 | 4 | 3 | 4 | 4 | 4 |
| Total Aviation Transport Fuels | 2,731 | 2,736 | 2,949 | 2,987 | 2,554 | 2,559 | 2,802 | 3,191 | 3,434 |
| of which: | |||||||||
| Jet Kerosene | 2,730 | 2,735 | 2,948 | 2,986 | 2,554 | 2,558 | 2,801 | 3,190 | 3,433 |
| Aviation Petrol | 1 | 1 | 1 | 1 | 1 | 1 | 1 | 1 | 1 |
| Total (ktoe) | 12,606 | 12,986 | 12,429 | 12,633 | 11,964 | 12,057 | 12,355 | 13,432 | 13,496 |
| Table 2B Energy Consumption in Reported Quantities by Detailed Energy Product 2009-2017 | |||||||||
| Energy Product | 2009 | 2010 | 2011 | 2012 | 2013 | 2014 | 2015 | 2016 | 2017 |
| Electricity (kWh) | 19,654,055,046 | 19,758,370,403 | 20,532,426,400 | 19,793,915,036 | 19,870,995,507 | 19,807,625,061 | 19,463,901,110 | 20,906,982,615 | 21,113,263,756 |
| Natural Gas (kWh excl. CHP) | 39,534,141,186 | 42,947,531,527 | 39,110,196,619 | 37,542,276,296 | 38,205,696,246 | 36,357,871,214 | 35,673,152,834 | 43,342,403,708 | 44,734,210,699 |
| Combined Heat and Power Plants (kWh) | 10,174,573,341 | 10,942,720,920 | 8,250,545,000 | 7,669,946,868 | 7,199,191,259 | 8,627,397,035 | 7,833,017,350 | 8,664,720,638 | 8,588,909,443 |
| Heavy Fuel Oil (litres) | 342,036,076 | 344,693,181 | 294,739,619 | 284,184,455 | 261,300,672 | 240,533,055 | 176,242,408 | 174,717,201 | 159,460,793 |
| Diesel/Gas Oil/Marked Gas Oil (litres) | 332,868,298 | 341,342,641 | 259,265,536 | 264,940,261 | 270,606,251 | 305,956,399 | 305,483,396 | 300,054,862 | 290,151,991 |
| Kerosene (litres) | 76,840,840 | 76,219,616 | 72,504,518 | 77,917,496 | 90,687,180 | 86,979,470 | 93,374,607 | 99,516,619 | 93,911,817 |
| Liquid Petroleum Gas (litres) | 103,811,452 | 105,170,192 | 108,360,967 | 119,723,319 | 127,038,388 | 140,501,955 | 156,164,818 | 164,681,040 | 185,415,426 |
| Petroleum Coke (tonnes) | 150,132 | 95,183 | 88,288 | 116,848 | 114,900 | 145,086 | 162,976 | 174,547 | 174,129 |
| Coal (tonnes) | 1,471,446 | 1,652,640 | 1,709,736 | 2,116,445 | 1,771,919 | 1,749,563 | 2,045,531 | 2,013,508 | 1,609,070 |
| Peat (tonnes) | 3,327,644 | 2,759,210 | 2,618,049 | 3,177,057 | 2,797,547 | 2,792,784 | 2,780,719 | 2,732,114 | 2,659,102 |
| Wood Biomass (tonnes) | 373,246 | 431,569 | 407,290 | 543,961 | 507,745 | 604,744 | 538,624 | 688,722 | 661,603 |
| Biogas (kWh) | 47,968,131 | 52,912,338 | 133,408,860 | 128,112,669 | 104,466,858 | 138,210,615 | 141,867,925 | 136,233,605 | 138,480,975 |
| Landfill Gas (kWh) | 496,759,121 | 522,001,332 | 513,225,724 | 505,074,025 | 468,061,446 | 562,800,703 | 594,249,817 | 504,951,910 | 497,214,303 |
| Tallow (tonnes) | 46,353 | 45,086 | 41,012 | 39,396 | 31,567 | 40,293 | 39,453 | 25,329 | 35,174 |
| Wind Turbines (kWh) | 2,829,596 | 4,631,582 | 11,383,305 | 6,928,074 | 4,908,549 | 6,570,189 | 16,012,396 | 18,205,769 | 33,172,547 |
| Solid Recovered Fuel (tonnes) | 25,627 | 45,948 | 60,742 | 126,964 | 149,742 | 173,603 | 214,105 | 226,361 | 225,719 |
| Road Transport Petrol (litres) | 52,325,301 | 53,137,941 | 35,108,812 | 30,914,416 | 39,800,855 | 33,657,304 | 33,964,325 | 33,109,938 | 35,185,672 |
| Road Transport Diesel (litres) | 1,334,349,872 | 1,274,196,064 | 1,106,848,635 | 1,109,800,789 | 1,139,027,461 | 1,162,030,837 | 1,226,106,248 | 1,046,591,920 | 1,026,971,552 |
| Road Transport Biodiesel (litres) | 3,906,672 | 6,287,732 | 6,971,416 | 7,254,246 | 8,811,606 | 9,010,205 | 8,650,210 | 6,862,333 | 10,659,515 |
| Other Road Transport Fuels (kWh) | 0 | 0 | 0 | 0 | 465,363 | 343,123 | 381,787 | 452,007 | 106,036 |
| Rail Transport Diesel (litres) | 47,959,142 | 46,090,454 | 46,114,612 | 45,090,325 | 44,309,672 | 40,637,583 | 40,750,636 | 42,060,000 | 43,212,000 |
| Rail Transport Electricity (kWh) | 48,464,501 | 48,364,501 | 46,664,501 | 46,743,022 | 43,345,867 | 40,550,129 | 42,860,884 | 45,816,790 | 47,053,503 |
| Jet Kerosene (litres) | 3,239,760,668 | 3,245,743,658 | 3,498,508,767 | 3,543,490,987 | 3,030,474,206 | 3,035,992,489 | 3,323,699,758 | 3,785,338,815 | 4,074,051,702 |
| Aviation Petrol (litres) | 1,006,306 | 728,799 | 740,003 | 955,095 | 1,082,820 | 1,151,104 | 1,297,550 | 1,481,774 | 1,448,276 |
| Table 2C Energy Consumption in Thousand Euro by Detailed Energy Product 2009-2017 | |||||||||
| €000 | |||||||||
| Energy Product | 2009 | 2010 | 2011 | 2012 | 2013 | 2014 | 2015 | 2016 | 2017 |
| Electricity | 2,465,677 | 2,437,969 | 2,558,371 | 2,588,392 | 2,743,834 | 2,666,846 | 2,578,017 | 2,566,947 | 2,586,473 |
| Total Natural Gas | 1,783,369 | 1,987,475 | 1,844,023 | 1,763,665 | 2,031,879 | 1,745,807 | 1,570,444 | 1,746,559 | 1,775,647 |
| of which: | |||||||||
| Natural Gas (excl. CHP) | 1,518,798 | 1,663,903 | 1,532,439 | 1,511,999 | 1,763,132 | 1,473,988 | 1,377,888 | 1,591,652 | 1,610,735 |
| Combined Heat and Power Plants | 264,572 | 323,572 | 311,584 | 251,666 | 268,748 | 271,820 | 192,556 | 154,907 | 164,912 |
| Total Petroleum Fuels | 441,341 | 522,955 | 480,395 | 543,815 | 531,630 | 529,306 | 423,197 | 388,529 | 406,628 |
| of which: | |||||||||
| Heavy Fuel Oil | 136,654 | 173,782 | 152,585 | 177,192 | 156,074 | 141,556 | 90,483 | 82,640 | 75,793 |
| Diesel/Gas Oil/Marked Gas Oil | 197,626 | 233,868 | 200,521 | 220,154 | 216,212 | 231,687 | 194,299 | 164,925 | 175,978 |
| Kerosene | 41,655 | 51,452 | 59,977 | 63,861 | 72,123 | 65,407 | 54,531 | 54,387 | 56,612 |
| Liquid Petroleum Gas | 46,622 | 56,289 | 60,571 | 70,848 | 74,895 | 77,538 | 70,180 | 73,846 | 83,561 |
| Petroleum Coke | 18,785 | 7,564 | 6,742 | 11,761 | 12,326 | 13,118 | 13,704 | 12,732 | 14,684 |
| Total Solid Fuels | 464,448 | 420,983 | 425,920 | 554,353 | 462,041 | 453,156 | 497,420 | 489,350 | 443,396 |
| of which: | |||||||||
| Coal | 113,150 | 123,481 | 150,050 | 211,171 | 159,816 | 150,919 | 188,576 | 185,886 | 148,066 |
| Peat | 351,299 | 297,502 | 275,870 | 343,182 | 302,225 | 302,237 | 308,844 | 303,463 | 295,330 |
| Total Renewable Energy (incl. Waste) | 36,255 | 45,818 | 50,425 | 58,038 | 62,027 | 70,383 | 69,309 | 79,720 | 95,954 |
| of which: | |||||||||
| Wood Biomass | 13,500 | 21,093 | 25,116 | 32,969 | 34,902 | 40,468 | 39,088 | 52,720 | 66,671 |
| Biogas | 1,919 | 2,115 | 2,686 | 2,582 | 1,652 | 3,096 | 1,680 | 2,995 | 2,294 |
| Landfill Gas | 19,871 | 20,880 | 20,337 | 20,202 | 23,188 | 24,131 | 24,744 | 20,198 | 19,889 |
| Tallow | 1 | 3 | 1 | 1 | 1 | 2 | 4 | 5 | 5 |
| Wind Turbines | 2 | 4 | 7 | 4 | 5 | 6 | 7 | 15 | 3,309 |
| Solid Recovered Fuel | 961 | 1,723 | 2,278 | 2,279 | 2,279 | 2,679 | 3,786 | 3,786 | 3,786 |
| Total Road Transport Fuels | 1,240,063 | 1,366,079 | 1,285,983 | 1,336,626 | 1,421,070 | 1,387,658 | 1,352,140 | 1,079,192 | 1,092,859 |
| of which: | |||||||||
| Road Transport Petrol | 45,889 | 55,205 | 41,414 | 38,787 | 52,659 | 43,869 | 40,009 | 38,014 | 40,779 |
| Road Transport Diesel | 1,190,133 | 1,304,369 | 1,237,304 | 1,290,305 | 1,359,572 | 1,334,739 | 1,301,473 | 1,033,761 | 1,041,572 |
| Road Transport Biodiesel | 4,041 | 6,505 | 7,264 | 7,533 | 8,791 | 9,012 | 9,334 | 7,362 | 10,482 |
| Other Road Transport Fuels | 0 | 0 | 0 | 0 | 48 | 37 | 41 | 54 | 25 |
| Total Rail Transport Fuels | 44,825 | 49,352 | 57,433 | 60,532 | 65,005 | 58,955 | 49,379 | 37,734 | 30,039 |
| of which: | |||||||||
| Rail Transport Diesel | 38,703 | 44,846 | 52,063 | 54,244 | 59,375 | 52,422 | 42,788 | 31,128 | 23,845 |
| Rail Transport Electricity | 6,122 | 4,506 | 5,370 | 6,288 | 5,630 | 6,533 | 6,591 | 6,606 | 6,194 |
| Total Aviation Transport Fuels | 1,425,891 | 1,428,886 | 2,030,008 | 2,269,025 | 1,789,421 | 1,671,289 | 1,297,776 | 1,175,175 | 1,549,817 |
| of which: | |||||||||
| Jet Kerosene | 1,425,015 | 1,428,129 | 2,029,136 | 2,267,822 | 1,787,981 | 1,669,795 | 1,296,245 | 1,173,457 | 1,548,137 |
| Aviation Petrol | 876 | 757 | 872 | 1,203 | 1,440 | 1,494 | 1,531 | 1,718 | 1,680 |
| Total (€000 excl. VAT) | 7,901,870 | 8,259,518 | 8,732,558 | 9,174,446 | 9,106,907 | 8,583,400 | 7,837,681 | 7,563,207 | 7,980,813 |
| Table 3A Energy Consumption in ktoe by Detailed NACE Rev.2 Sector 2009-2017 | |||||||||
| ktoe | |||||||||
| NACE Rev. 2 Sector | 2009 | 2010 | 2011 | 2012 | 2013 | 2014 | 2015 | 2016 | 2017 |
| Mining and Quarrying (05-09) | 143 | 126 | 123 | 111 | 115 | 113 | 77 | 86 | 81 |
| Manufacture of Food, Beverages and Tobacco (10-12) | 594 | 600 | 623 | 650 | 659 | 724 | 672 | 730 | 755 |
| Manufacture of Wood and Paper (16-18) | 143 | 176 | 158 | 149 | 124 | 153 | 125 | 125 | 132 |
| Manufacture of Chemicals (20) | 108 | 134 | 161 | 156 | 149 | 154 | 157 | 155 | 163 |
| Manufacture of Pharmaceuticals (21) | 210 | 177 | 150 | 149 | 149 | 147 | 145 | 175 | 180 |
| Manufacture of Rubber, Plastic and Non-metallic Mineral Products (22-23) | 404 | 324 | 327 | 353 | 347 | 472 | 463 | 491 | 507 |
| Manufacture of Basic Metals and Metal Products (24-25) | 435 | 476 | 488 | 492 | 638 | 650 | 636 | 661 | 688 |
| Manufacture of Electronic and Electrical Equipment (26-27) | 103 | 98 | 100 | 84 | 99 | 111 | 118 | 127 | 127 |
| Other Manufacturing | 146 | 132 | 166 | 156 | 181 | 237 | 202 | 230 | 230 |
| Electricity and Gas (35) | 4,485 | 4,778 | 4,192 | 4,270 | 3,802 | 3,708 | 3,817 | 4,376 | 4,116 |
| Water Supply, Sewerage, and Waste Management (36-39) | 256 | 146 | 101 | 97 | 82 | 155 | 127 | 152 | 143 |
| Construction (41-43) | 60 | 114 | 59 | 93 | 90 | 122 | 126 | 121 | 132 |
| Wholesale, Retail, and Vehicle Repair (45-47) | 499 | 523 | 493 | 473 | 519 | 506 | 553 | 524 | 531 |
| Transportation and Storage (49-53) | 3,442 | 3,567 | 3,665 | 3,696 | 3,181 | 3,173 | 3,397 | 3,761 | 3,998 |
| Accommodation and Food Services (55-56) | 239 | 180 | 224 | 224 | 229 | 218 | 231 | 228 | 224 |
| Information and Communication (58-63) | 104 | 91 | 134 | 140 | 169 | 172 | 206 | 213 | 248 |
| Financial, Insurance and Real Estate Activities (64-68) | 101 | 110 | 101 | 94 | 89 | 81 | 95 | 83 | 90 |
| Public Administration (84) | 452 | 578 | 545 | 547 | 547 | 418 | 416 | 423 | 410 |
| Education (85) | 182 | 204 | 185 | 199 | 229 | 213 | 221 | 222 | 214 |
| Health, Residential Care and Social Work Activities (86-88) | 211 | 182 | 170 | 196 | 207 | 206 | 210 | 211 | 208 |
| Other Services Sectors | 288 | 271 | 261 | 305 | 361 | 325 | 360 | 338 | 320 |
| Total (ktoe) | 12,606 | 12,986 | 12,429 | 12,633 | 11,964 | 12,057 | 12,355 | 13,432 | 13,496 |
| Table 3B Energy Consumption in Thousand Euro by Detailed NACE Rev.2 Sector 2009-2017 | |||||||||
| €000 | |||||||||
| NACE Rev. 2 Sector | 2009 | 2010 | 2011 | 2012 | 2013 | 2014 | 2015 | 2016 | 2017 |
| Mining and Quarrying (05-09) | 97,000 | 83,324 | 90,763 | 88,832 | 93,360 | 91,713 | 51,721 | 54,781 | 53,284 |
| Manufacture of Food, Beverages and Tobacco (10-12) | 303,162 | 316,086 | 375,902 | 410,852 | 430,393 | 471,476 | 401,147 | 396,004 | 446,166 |
| Manufacture of Wood and Paper (16-18) | 68,360 | 57,343 | 63,823 | 73,014 | 77,379 | 91,159 | 67,582 | 64,519 | 82,790 |
| Manufacture of Chemicals (20) | 68,476 | 75,898 | 93,933 | 99,612 | 109,408 | 105,937 | 109,095 | 98,769 | 96,362 |
| Manufacture of Pharmaceuticals (21) | 160,135 | 116,545 | 103,558 | 103,923 | 115,539 | 115,320 | 109,279 | 110,851 | 117,635 |
| Manufacture of Rubber, Plastic and Non-metallic Mineral Products (22-23) | 213,004 | 152,280 | 182,021 | 188,812 | 198,539 | 261,573 | 216,619 | 210,837 | 221,459 |
| Manufacture of Basic Metals and Metal Products (24-25) | 100,383 | 154,814 | 243,901 | 221,410 | 276,656 | 273,229 | 179,480 | 144,509 | 175,139 |
| Manufacture of Electronic and Electrical Equipment (26-27) | 121,680 | 85,935 | 107,676 | 78,137 | 99,981 | 106,584 | 109,875 | 102,967 | 103,465 |
| Other Manufacturing | 152,192 | 105,610 | 140,004 | 142,523 | 178,021 | 220,183 | 167,953 | 176,166 | 184,174 |
| Electricity and Gas (35) | 1,869,066 | 1,974,969 | 1,662,087 | 1,671,548 | 1,709,734 | 1,421,002 | 1,417,828 | 1,598,840 | 1,514,006 |
| Water Supply, Sewerage, and Waste Management (36-39) | 253,060 | 160,451 | 96,458 | 103,833 | 90,028 | 179,853 | 142,136 | 155,537 | 150,840 |
| Construction (41-43) | 55,551 | 124,367 | 42,426 | 89,860 | 98,073 | 125,067 | 115,937 | 108,590 | 125,725 |
| Wholesale, Retail, and Vehicle Repair (45-47) | 577,943 | 641,395 | 750,919 | 647,339 | 720,588 | 694,289 | 703,951 | 662,377 | 629,969 |
| Transportation and Storage (49-53) | 2,198,876 | 2,409,477 | 2,940,989 | 3,197,965 | 2,644,319 | 2,480,541 | 2,039,336 | 1,820,711 | 2,194,679 |
| Accommodation and Food Services (55-56) | 231,680 | 198,444 | 242,882 | 248,459 | 259,639 | 239,044 | 250,994 | 245,415 | 247,136 |
| Information and Communication (58-63) | 123,250 | 128,080 | 148,895 | 177,541 | 224,486 | 223,763 | 260,313 | 239,273 | 289,915 |
| Financial, Insurance and Real Estate Activities (64-68) | 116,493 | 123,661 | 114,582 | 109,477 | 109,366 | 100,978 | 116,352 | 90,448 | 86,977 |
| Public Administration (84) | 529,821 | 696,426 | 689,939 | 742,758 | 768,955 | 531,832 | 509,713 | 495,346 | 489,360 |
| Education (85) | 183,391 | 194,974 | 187,607 | 216,810 | 262,349 | 243,744 | 243,448 | 234,918 | 232,745 |
| Health, Residential Care and Social Work Activities (86-88) | 179,472 | 159,480 | 164,062 | 207,422 | 220,105 | 219,924 | 216,912 | 206,100 | 209,876 |
| Other Services Sectors | 298,877 | 299,959 | 290,130 | 354,318 | 419,990 | 386,190 | 408,011 | 346,246 | 329,111 |
| Total (€000 excl. VAT) | 7,901,870 | 8,259,518 | 8,732,558 | 9,174,446 | 9,106,907 | 8,583,400 | 7,837,681 | 7,563,207 | 7,980,813 |
| Table 4A Energy Consumption in ktoe by Summary Energy Product and Summary NACE Rev.2 Sector 2017 | |||||||||
| ktoe | |||||||||
| NACE Rev.2 Sector | Electricity | Total Natural Gas | Total Petroleum Fuels | Total Solid Fuels | Total Renewable Energy (incl. Waste) | Total Road Transport Fuels | Total Rail Transport Fuels | Total Aviation Transport Fuels | Total (ktoe) |
| Mining and Quarrying (05-09) | 21 | 14 | 24 | 19 | 0 | 4 | 0 | 0 | 81 |
| Manufacturing (10-33) | 599 | 1,439 | 361 | 102 | 212 | 68 | 0 | 0 | 2,781 |
| Electricity and Gas (35) | 9 | 2,483 | 39 | 1,462 | 115 | 7 | 0 | 0 | 4,116 |
| Water Supply, Sewerage, and Waste Management (36-39) | 58 | 13 | 12 | 0 | 24 | 36 | 0 | 0 | 143 |
| Construction (41-43) | 25 | 24 | 46 | 0 | 0 | 36 | 0 | 0 | 132 |
| Wholesale, Retail, and Vehicle Repair (45-47) | 259 | 91 | 31 | 0 | 3 | 147 | 0 | 0 | 531 |
| Transportation and Storage (49-53) | 79 | 27 | 22 | 0 | 0 | 401 | 42 | 3,426 | 3,998 |
| Accommodation and Food Services (55-56) | 100 | 58 | 28 | 1 | 1 | 35 | 0 | 0 | 224 |
| Public Administration, Education, Health and Care (84-88) | 324 | 289 | 123 | 0 | 9 | 80 | 0 | 8 | 833 |
| Other Services Sectors | 343 | 148 | 34 | 0 | 13 | 120 | 0 | 0 | 658 |
| Total (ktoe) | 1,816 | 4,586 | 722 | 1,584 | 378 | 935 | 42 | 3,434 | 13,496 |
| Table 4B Energy Consumption in ktoe by Summary Energy Product and Summary NACE Rev.2 Sector 2016 | |||||||||
| ktoe | |||||||||
| NACE Rev.2 Sector | Electricity | Total Natural Gas | Total Petroleum Fuels | Total Solid Fuels | Total Renewable Energy (incl. Waste) | Total Road Transport Fuels | Total Rail Transport Fuels | Total Aviation Transport Fuels | Total (ktoe) |
| Mining and Quarrying (05-09) | 24 | 14 | 24 | 19 | 0 | 6 | 0 | 0 | 86 |
| Manufacturing (10-33) | 580 | 1,411 | 330 | 107 | 198 | 69 | 0 | 0 | 2,694 |
| Electricity and Gas (35) | 22 | 2,396 | 78 | 1,755 | 116 | 9 | 0 | 0 | 4,376 |
| Water Supply, Sewerage, and Waste Management (36-39) | 68 | 21 | 15 | 0 | 23 | 25 | 0 | 0 | 152 |
| Construction (41-43) | 24 | 27 | 33 | 0 | 0 | 37 | 0 | 0 | 121 |
| Wholesale, Retail, and Vehicle Repair (45-47) | 262 | 81 | 35 | 0 | 1 | 144 | 0 | 0 | 524 |
| Transportation and Storage (49-53) | 72 | 24 | 22 | 0 | 0 | 421 | 41 | 3,182 | 3,761 |
| Accommodation and Food Services (55-56) | 105 | 63 | 28 | 0 | 1 | 29 | 0 | 0 | 228 |
| Public Administration, Education, Health and Care (84-88) | 326 | 299 | 134 | 0 | 8 | 79 | 0 | 9 | 856 |
| Other Services Sectors | 316 | 137 | 39 | 0 | 14 | 128 | 0 | 0 | 634 |
| Total (ktoe) | 1,798 | 4,473 | 739 | 1,881 | 362 | 947 | 41 | 3,191 | 13,432 |
| Table 4C Energy Consumption in ktoe by Summary Energy Product and Summary NACE Rev.2 Sector 2015 | |||||||||
| ktoe | |||||||||
| NACE Rev.2 Sector | Electricity | Total Natural Gas | Total Petroleum Fuels | Total Solid Fuels | Total Renewable Energy (incl. Waste) | Total Road Transport Fuels | Total Rail Transport Fuels | Total Aviation Transport Fuels | Total (ktoe) |
| Mining and Quarrying (05-09) | 20 | 15 | 22 | 14 | 0 | 5 | 0 | 0 | 77 |
| Manufacturing (10-33) | 529 | 1,270 | 322 | 106 | 212 | 80 | 0 | 0 | 2,519 |
| Electricity and Gas (35) | 22 | 1,824 | 78 | 1,808 | 68 | 16 | 0 | 0 | 3,817 |
| Water Supply, Sewerage, and Waste Management (36-39) | 48 | 13 | 7 | 0 | 23 | 35 | 0 | 0 | 127 |
| Construction (41-43) | 21 | 25 | 41 | 0 | 0 | 38 | 0 | 0 | 126 |
| Wholesale, Retail, and Vehicle Repair (45-47) | 248 | 81 | 36 | 0 | 1 | 187 | 0 | 0 | 553 |
| Transportation and Storage (49-53) | 62 | 22 | 22 | 0 | 0 | 459 | 39 | 2,792 | 3,397 |
| Accommodation and Food Services (55-56) | 92 | 69 | 30 | 0 | 2 | 38 | 0 | 0 | 231 |
| Public Administration, Education, Health and Care (84-88) | 320 | 299 | 125 | 0 | 18 | 75 | 0 | 9 | 847 |
| Other Services Sectors | 310 | 124 | 42 | 0 | 12 | 173 | 0 | 0 | 662 |
| Total (ktoe) | 1,674 | 3,742 | 725 | 1,929 | 337 | 1,108 | 39 | 2,802 | 12,355 |
| Table 4D Energy Consumption in ktoe by Summary Energy Product and Summary NACE Rev.2 Sector 2014 | |||||||||
| ktoe | |||||||||
| NACE Rev.2 Sector | Electricity | Total Natural Gas | Total Petroleum Fuels | Total Solid Fuels | Total Renewable Energy (incl. Waste) | Total Road Transport Fuels | Total Rail Transport Fuels | Total Aviation Transport Fuels | Total (ktoe) |
| Mining and Quarrying (05-09) | 34 | 19 | 31 | 20 | 0 | 10 | 0 | 0 | 113 |
| Manufacturing (10-33) | 574 | 1,284 | 380 | 107 | 205 | 96 | 0 | 0 | 2,647 |
| Electricity and Gas (35) | 4 | 1,939 | 63 | 1,605 | 87 | 9 | 0 | 0 | 3,708 |
| Water Supply, Sewerage, and Waste Management (36-39) | 62 | 22 | 14 | 0 | 20 | 38 | 0 | 0 | 155 |
| Construction (41-43) | 22 | 24 | 30 | 0 | 0 | 46 | 0 | 0 | 122 |
| Wholesale, Retail, and Vehicle Repair (45-47) | 243 | 76 | 27 | 0 | 1 | 158 | 0 | 0 | 506 |
| Transportation and Storage (49-53) | 71 | 24 | 23 | 0 | 0 | 468 | 39 | 2,547 | 3,173 |
| Accommodation and Food Services (55-56) | 90 | 73 | 28 | 0 | 3 | 23 | 0 | 0 | 218 |
| Public Administration, Education, Health and Care (84-88) | 321 | 286 | 129 | 0 | 17 | 73 | 0 | 11 | 837 |
| Other Services Sectors | 282 | 121 | 35 | 0 | 10 | 130 | 0 | 0 | 578 |
| Total (ktoe) | 1,703 | 3,869 | 760 | 1,732 | 344 | 1,050 | 39 | 2,559 | 12,057 |
| Table 4E Energy Consumption in ktoe by Summary Energy Product and Summary NACE Rev.2 Sector 2013 | |||||||||
| ktoe | |||||||||
| NACE Rev.2 Sector | Electricity | Total Natural Gas | Total Petroleum Fuels | Total Solid Fuels | Total Renewable Energy (incl. Waste) | Total Road Transport Fuels | Total Rail Transport Fuels | Total Aviation Transport Fuels | Total (ktoe) |
| Mining and Quarrying (05-09) | 36 | 19 | 27 | 24 | 0 | 8 | 0 | 0 | 115 |
| Manufacturing (10-33) | 496 | 1,160 | 375 | 82 | 158 | 73 | 0 | 0 | 2,345 |
| Electricity and Gas (35) | 2 | 2,056 | 43 | 1,608 | 85 | 7 | 0 | 0 | 3,802 |
| Water Supply, Sewerage, and Waste Management (36-39) | 21 | 8 | 5 | 0 | 21 | 26 | 0 | 0 | 82 |
| Construction (41-43) | 19 | 21 | 16 | 0 | 0 | 33 | 0 | 0 | 90 |
| Wholesale, Retail, and Vehicle Repair (45-47) | 245 | 82 | 27 | 0 | 1 | 164 | 0 | 0 | 519 |
| Transportation and Storage (49-53) | 63 | 23 | 22 | 0 | 0 | 487 | 42 | 2,543 | 3,181 |
| Accommodation and Food Services (55-56) | 98 | 74 | 32 | 0 | 4 | 20 | 0 | 0 | 229 |
| Public Administration, Education, Health and Care (84-88) | 443 | 306 | 133 | 0 | 12 | 79 | 0 | 10 | 984 |
| Other Services Sectors | 285 | 155 | 38 | 0 | 2 | 138 | 0 | 0 | 619 |
| Total (ktoe) | 1,709 | 3,905 | 719 | 1,715 | 284 | 1,035 | 42 | 2,554 | 11,964 |
| Table 4F Energy Consumption in ktoe by Summary Energy Product and Summary NACE Rev.2 Sector 2012 | |||||||||
| ktoe | |||||||||
| NACE Rev.2 Sector | Electricity | Total Natural Gas | Total Petroleum Fuels | Total Solid Fuels | Total Renewable Energy (incl. Waste) | Total Road Transport Fuels | Total Rail Transport Fuels | Total Aviation Transport Fuels | Total (ktoe) |
| Mining and Quarrying (05-09) | 38 | 21 | 22 | 21 | 0 | 9 | 0 | 0 | 111 |
| Manufacturing (10-33) | 478 | 995 | 377 | 96 | 182 | 60 | 0 | 1 | 2,188 |
| Electricity and Gas (35) | 13 | 2,244 | 52 | 1,876 | 77 | 7 | 0 | 0 | 4,270 |
| Water Supply, Sewerage, and Waste Management (36-39) | 26 | 10 | 6 | 0 | 22 | 34 | 0 | 0 | 97 |
| Construction (41-43) | 23 | 21 | 35 | 2 | 1 | 12 | 0 | 0 | 93 |
| Wholesale, Retail, and Vehicle Repair (45-47) | 252 | 67 | 29 | 0 | 1 | 123 | 0 | 0 | 473 |
| Transportation and Storage (49-53) | 70 | 25 | 21 | 0 | 0 | 559 | 43 | 2,976 | 3,696 |
| Accommodation and Food Services (55-56) | 96 | 79 | 27 | 0 | 2 | 18 | 0 | 0 | 224 |
| Public Administration, Education, Health and Care (84-88) | 441 | 296 | 110 | 0 | 8 | 78 | 0 | 9 | 942 |
| Other Services Sectors | 265 | 131 | 41 | 0 | 1 | 101 | 0 | 0 | 540 |
| Total (ktoe) | 1,702 | 3,888 | 722 | 1,995 | 294 | 1,001 | 43 | 2,987 | 12,633 |
| Table 4G Energy Consumption in ktoe by Summary Energy Product and Summary NACE Rev.2 Sector 2011 | |||||||||
| ktoe | |||||||||
| NACE Rev.2 Sector | Electricity | Total Natural Gas | Total Petroleum Fuels | Total Solid Fuels | Total Renewable Energy (incl. Waste) | Total Road Transport Fuels | Total Rail Transport Fuels | Total Aviation Transport Fuels | Total (ktoe) |
| Mining and Quarrying (05-09) | 44 | 23 | 26 | 19 | 0 | 11 | 0 | 0 | 123 |
| Manufacturing (10-33) | 534 | 933 | 357 | 107 | 163 | 82 | 0 | 1 | 2,176 |
| Electricity and Gas (35) | 6 | 2,538 | 55 | 1,514 | 72 | 7 | 0 | 0 | 4,192 |
| Water Supply, Sewerage, and Waste Management (36-39) | 33 | 11 | 6 | 0 | 19 | 32 | 0 | 0 | 101 |
| Construction (41-43) | 16 | 18 | 21 | 0 | 0 | 4 | 0 | 0 | 59 |
| Wholesale, Retail, and Vehicle Repair (45-47) | 261 | 81 | 26 | 0 | 1 | 124 | 0 | 0 | 493 |
| Transportation and Storage (49-53) | 77 | 25 | 21 | 0 | 0 | 559 | 44 | 2,938 | 3,665 |
| Accommodation and Food Services (55-56) | 103 | 68 | 29 | 0 | 3 | 22 | 0 | 0 | 224 |
| Public Administration, Education, Health and Care (84-88) | 431 | 257 | 116 | 0 | 5 | 82 | 0 | 9 | 900 |
| Other Services Sectors | 260 | 119 | 37 | 0 | 0 | 79 | 0 | 1 | 496 |
| Total (ktoe) | 1,766 | 4,073 | 693 | 1,640 | 264 | 1,002 | 44 | 2,949 | 12,429 |
| Table 4H Energy Consumption in ktoe by Summary Energy Product and Summary NACE Rev.2 Sector 2010 | |||||||||
| ktoe | |||||||||
| NACE Rev.2 Sector | Electricity | Total Natural Gas | Total Petroleum Fuels | Total Solid Fuels | Total Renewable Energy (incl. Waste) | Total Road Transport Fuels | Total Rail Transport Fuels | Total Aviation Transport Fuels | Total (ktoe) |
| Mining and Quarrying (05-09) | 41 | 24 | 27 | 26 | 0 | 8 | 0 | 0 | 126 |
| Manufacturing (10-33) | 479 | 902 | 381 | 121 | 187 | 46 | 0 | 1 | 2,117 |
| Electricity and Gas (35) | 20 | 3,111 | 96 | 1,475 | 65 | 11 | 0 | 0 | 4,778 |
| Water Supply, Sewerage, and Waste Management (36-39) | 46 | 22 | 14 | 0 | 11 | 53 | 0 | 0 | 146 |
| Construction (41-43) | 39 | 11 | 56 | 0 | 0 | 8 | 0 | 0 | 114 |
| Wholesale, Retail, and Vehicle Repair (45-47) | 251 | 79 | 25 | 0 | 0 | 168 | 0 | 0 | 523 |
| Transportation and Storage (49-53) | 98 | 39 | 35 | 0 | 0 | 625 | 44 | 2,726 | 3,567 |
| Accommodation and Food Services (55-56) | 76 | 53 | 18 | 0 | 1 | 32 | 0 | 0 | 180 |
| Public Administration, Education, Health and Care (84-88) | 434 | 301 | 128 | 0 | 4 | 87 | 0 | 8 | 963 |
| Other Services Sectors | 215 | 93 | 38 | 0 | 1 | 124 | 0 | 1 | 472 |
| Total (ktoe) | 1,699 | 4,635 | 817 | 1,622 | 271 | 1,162 | 44 | 2,736 | 12,986 |
| Table 4I Energy Consumption in ktoe by Summary Energy Product and Summary NACE Rev.2 Sector 2009 | |||||||||
| ktoe | |||||||||
| NACE Rev.2 Sector | Electricity | Total Natural Gas | Total Petroleum Fuels | Total Solid Fuels | Total Renewable Energy (incl. Waste) | Total Road Transport Fuels | Total Rail Transport Fuels | Total Aviation Transport Fuels | Total (ktoe) |
| Mining and Quarrying (05-09) | 42 | 24 | 34 | 28 | 0 | 16 | 0 | 0 | 143 |
| Manufacturing (10-33) | 534 | 866 | 409 | 109 | 143 | 83 | 0 | 1 | 2,144 |
| Electricity and Gas (35) | 24 | 2,832 | 111 | 1,452 | 58 | 7 | 0 | 0 | 4,485 |
| Water Supply, Sewerage, and Waste Management (36-39) | 73 | 32 | 24 | 0 | 7 | 120 | 0 | 0 | 256 |
| Construction (41-43) | 17 | 3 | 31 | 0 | 0 | 8 | 0 | 0 | 60 |
| Wholesale, Retail, and Vehicle Repair (45-47) | 241 | 66 | 31 | 0 | 0 | 161 | 0 | 0 | 499 |
| Transportation and Storage (49-53) | 77 | 28 | 24 | 0 | 0 | 540 | 46 | 2,726 | 3,442 |
| Accommodation and Food Services (55-56) | 93 | 66 | 28 | 0 | 3 | 49 | 0 | 0 | 239 |
| Public Administration, Education, Health and Care (84-88) | 370 | 276 | 117 | 0 | 3 | 76 | 0 | 3 | 846 |
| Other Services Sectors | 219 | 81 | 39 | 0 | 0 | 152 | 0 | 1 | 493 |
| Total (ktoe) | 1,690 | 4,275 | 849 | 1,589 | 214 | 1,212 | 46 | 2,731 | 12,606 |
| Table 5A Energy Consumption in Thousand Euro by Summary Energy Product and Summary NACE Rev.2 Sector 2017 | |||||||||
| €000 | |||||||||
| NACE Rev.2 Sector | Electricity | Total Natural Gas | Total Petroleum Fuels | Total Solid Fuels | Total Renewable Energy (incl. Waste) | Total Road Transport Fuels | Total Rail Transport Fuels | Total Aviation Transport Fuels | Total (€000 excl. VAT) |
| Mining and Quarrying (05-09) | 22,233 | 499 | 14,685 | 10,793 | 0 | 5,074 | 0 | 0 | 53,284 |
| Manufacturing (10-33) | 726,674 | 432,340 | 147,632 | 14,337 | 27,303 | 78,904 | 0 | 0 | 1,427,189 |
| Electricity and Gas (35) | 14,538 | 1,005,778 | 21,411 | 417,890 | 47,054 | 7,335 | 0 | 0 | 1,514,006 |
| Water Supply, Sewerage, and Waste Management (36-39) | 87,318 | 6,240 | 8,014 | 0 | 8,141 | 41,126 | 0 | 0 | 150,840 |
| Construction (41-43) | 33,545 | 11,295 | 35,544 | 0 | 38 | 45,304 | 0 | 0 | 125,725 |
| Wholesale, Retail, and Vehicle Repair (45-47) | 391,148 | 43,327 | 23,063 | 8 | 1,599 | 170,824 | 0 | 0 | 629,969 |
| Transportation and Storage (49-53) | 128,412 | 14,115 | 17,608 | 9 | 60 | 458,688 | 30,039 | 1,545,748 | 2,194,679 |
| Accommodation and Food Services (55-56) | 155,553 | 26,895 | 21,417 | 339 | 557 | 42,375 | 0 | 0 | 247,136 |
| Public Administration, Education, Health and Care (84-88) | 566,969 | 168,095 | 91,082 | 0 | 5,153 | 96,725 | 0 | 3,958 | 931,981 |
| Other Services Sectors | 460,084 | 67,062 | 26,172 | 20 | 6,050 | 146,504 | 0 | 111 | 706,003 |
| Total (€000 excl. VAT) | 2,586,473 | 1,775,647 | 406,628 | 443,396 | 95,954 | 1,092,859 | 30,039 | 1,549,817 | 7,980,813 |
| Table 5B Energy Consumption in Thousand Euro by Summary Energy Product and Summary NACE Rev.2 Sector 2016 | |||||||||
| €000 | |||||||||
| NACE Rev.2 Sector | Electricity | Total Natural Gas | Total Petroleum Fuels | Total Solid Fuels | Total Renewable Energy (incl. Waste) | Total Road Transport Fuels | Total Rail Transport Fuels | Total Aviation Transport Fuels | Total (€000 excl. VAT) |
| Mining and Quarrying (05-09) | 23,258 | 855 | 13,606 | 10,366 | 0 | 6,697 | 0 | 0 | 54,781 |
| Manufacturing (10-33) | 674,064 | 391,997 | 123,133 | 15,612 | 23,499 | 76,319 | 0 | 0 | 1,304,623 |
| Electricity and Gas (35) | 32,758 | 1,016,939 | 39,845 | 462,924 | 36,113 | 10,262 | 0 | 0 | 1,598,840 |
| Water Supply, Sewerage, and Waste Management (36-39) | 101,133 | 8,674 | 9,108 | 0 | 7,827 | 28,794 | 0 | 0 | 155,537 |
| Construction (41-43) | 32,500 | 8,488 | 22,485 | 0 | 4 | 45,113 | 0 | 0 | 108,590 |
| Wholesale, Retail, and Vehicle Repair (45-47) | 427,731 | 42,583 | 24,331 | 51 | 345 | 167,336 | 0 | 0 | 662,377 |
| Transportation and Storage (49-53) | 110,686 | 12,702 | 17,224 | 42 | 36 | 471,140 | 37,734 | 1,171,147 | 1,820,711 |
| Accommodation and Food Services (55-56) | 162,101 | 27,660 | 20,305 | 284 | 571 | 34,494 | 0 | 0 | 245,415 |
| Public Administration, Education, Health and Care (84-88) | 570,033 | 174,073 | 91,244 | 0 | 4,854 | 92,488 | 0 | 3,672 | 936,364 |
| Other Services Sectors | 432,684 | 62,589 | 27,249 | 70 | 6,473 | 146,547 | 0 | 356 | 675,967 |
| Total (€000 excl. VAT) | 2,566,947 | 1,746,559 | 388,529 | 489,350 | 79,720 | 1,079,192 | 37,734 | 1,175,175 | 7,563,207 |
| Table 5C Energy Consumption in Thousand Euro by Summary Energy Product and Summary NACE Rev.2 Sector 2015 | |||||||||
| €000 | |||||||||
| NACE Rev.2 Sector | Electricity | Total Natural Gas | Total Petroleum Fuels | Total Solid Fuels | Total Renewable Energy (incl. Waste) | Total Road Transport Fuels | Total Rail Transport Fuels | Total Aviation Transport Fuels | Total (€000 excl. VAT) |
| Mining and Quarrying (05-09) | 22,331 | 162 | 15,193 | 7,829 | 0 | 6,207 | 0 | 0 | 51,721 |
| Manufacturing (10-33) | 679,596 | 417,893 | 136,615 | 15,347 | 21,036 | 90,377 | 0 | 166 | 1,361,030 |
| Electricity and Gas (35) | 38,996 | 813,984 | 47,801 | 473,950 | 23,930 | 19,167 | 0 | 0 | 1,417,828 |
| Water Supply, Sewerage, and Waste Management (36-39) | 84,131 | 5,363 | 4,895 | 0 | 7,348 | 40,400 | 0 | 0 | 142,136 |
| Construction (41-43) | 28,864 | 9,709 | 30,103 | 0 | 5 | 47,256 | 0 | 0 | 115,937 |
| Wholesale, Retail, and Vehicle Repair (45-47) | 404,793 | 41,640 | 27,423 | 37 | 443 | 229,613 | 0 | 2 | 703,951 |
| Transportation and Storage (49-53) | 104,533 | 11,875 | 17,394 | 41 | 24 | 563,666 | 49,379 | 1,292,424 | 2,039,336 |
| Accommodation and Food Services (55-56) | 149,676 | 31,502 | 21,866 | 146 | 912 | 46,893 | 0 | 0 | 250,994 |
| Public Administration, Education, Health and Care (84-88) | 595,915 | 174,062 | 91,958 | 0 | 10,202 | 93,241 | 0 | 4,695 | 970,073 |
| Other Services Sectors | 469,183 | 64,254 | 29,949 | 70 | 5,409 | 215,322 | 0 | 489 | 784,676 |
| Total (€000 excl. VAT) | 2,578,017 | 1,570,444 | 423,197 | 497,420 | 69,309 | 1,352,140 | 49,379 | 1,297,776 | 7,837,681 |
| Table 5D Energy Consumption in Thousand Euro by Summary Energy Product and Summary NACE Rev.2 Sector 2014 | |||||||||
| €000 | |||||||||
| NACE Rev.2 Sector | Electricity | Total Natural Gas | Total Petroleum Fuels | Total Solid Fuels | Total Renewable Energy (incl. Waste) | Total Road Transport Fuels | Total Rail Transport Fuels | Total Aviation Transport Fuels | Total (€000 excl. VAT) |
| Mining and Quarrying (05-09) | 41,126 | 807 | 26,101 | 10,368 | 19 | 13,292 | 0 | 0 | 91,713 |
| Manufacturing (10-33) | 780,767 | 501,712 | 203,633 | 14,668 | 18,563 | 125,855 | 0 | 265 | 1,645,462 |
| Electricity and Gas (35) | 7,279 | 902,042 | 43,517 | 427,840 | 29,512 | 10,811 | 0 | 0 | 1,421,002 |
| Water Supply, Sewerage, and Waste Management (36-39) | 100,718 | 10,044 | 11,019 | 0 | 6,981 | 51,091 | 0 | 0 | 179,853 |
| Construction (41-43) | 31,121 | 9,938 | 24,590 | 0 | 5 | 59,414 | 0 | 0 | 125,067 |
| Wholesale, Retail, and Vehicle Repair (45-47) | 411,687 | 43,652 | 26,077 | 38 | 191 | 212,625 | 0 | 20 | 694,289 |
| Transportation and Storage (49-53) | 118,570 | 14,662 | 21,341 | 38 | 9 | 603,999 | 58,955 | 1,662,967 | 2,480,541 |
| Accommodation and Food Services (55-56) | 146,337 | 34,559 | 24,649 | 147 | 1,232 | 32,120 | 0 | 0 | 239,044 |
| Public Administration, Education, Health and Care (84-88) | 596,494 | 166,032 | 116,774 | 0 | 8,360 | 100,323 | 0 | 7,517 | 995,500 |
| Other Services Sectors | 432,748 | 62,361 | 31,604 | 58 | 5,512 | 178,128 | 0 | 520 | 710,931 |
| Total (€000 excl. VAT) | 2,666,846 | 1,745,807 | 529,306 | 453,156 | 70,383 | 1,387,658 | 58,955 | 1,671,289 | 8,583,400 |
| Table 5E Energy Consumption in Thousand Euro by Summary Energy Product and Summary NACE Rev.2 Sector 2013 | |||||||||
| €000 | |||||||||
| NACE Rev.2 Sector | Electricity | Total Natural Gas | Total Petroleum Fuels | Total Solid Fuels | Total Renewable Energy (incl. Waste) | Total Road Transport Fuels | Total Rail Transport Fuels | Total Aviation Transport Fuels | Total (€000 excl. VAT) |
| Mining and Quarrying (05-09) | 44,544 | 854 | 23,575 | 13,483 | 23 | 10,879 | 0 | 0 | 93,360 |
| Manufacturing (10-33) | 676,867 | 469,046 | 212,665 | 11,348 | 13,618 | 102,054 | 0 | 318 | 1,485,915 |
| Electricity and Gas (35) | 3,905 | 1,195,485 | 34,254 | 436,861 | 30,817 | 8,413 | 0 | 0 | 1,709,734 |
| Water Supply, Sewerage, and Waste Management (36-39) | 34,816 | 4,417 | 4,819 | 0 | 9,535 | 36,440 | 0 | 0 | 90,028 |
| Construction (41-43) | 28,329 | 10,110 | 15,411 | 0 | 10 | 44,214 | 0 | 0 | 98,073 |
| Wholesale, Retail, and Vehicle Repair (45-47) | 418,006 | 45,851 | 26,901 | 35 | 85 | 229,706 | 0 | 5 | 720,588 |
| Transportation and Storage (49-53) | 107,090 | 13,886 | 21,753 | 82 | 38 | 655,533 | 65,005 | 1,780,933 | 2,644,319 |
| Accommodation and Food Services (55-56) | 161,861 | 37,963 | 29,434 | 166 | 1,586 | 28,629 | 0 | 0 | 259,639 |
| Public Administration, Education, Health and Care (84-88) | 823,192 | 178,041 | 126,404 | 14 | 5,377 | 110,822 | 0 | 7,559 | 1,251,409 |
| Other Services Sectors | 445,225 | 76,226 | 36,415 | 52 | 939 | 194,380 | 0 | 606 | 753,842 |
| Total (€000 excl. VAT) | 2,743,834 | 2,031,879 | 531,630 | 462,041 | 62,027 | 1,421,070 | 65,005 | 1,789,421 | 9,106,907 |
| Table 5F Energy Consumption in Thousand Euro by Summary Energy Product and Summary NACE Rev.2 Sector 2012 | |||||||||
| €000 | |||||||||
| NACE Rev.2 Sector | Electricity | Total Natural Gas | Total Petroleum Fuels | Total Solid Fuels | Total Renewable Energy (incl. Waste) | Total Road Transport Fuels | Total Rail Transport Fuels | Total Aviation Transport Fuels | Total (€000 excl. VAT) |
| Mining and Quarrying (05-09) | 43,417 | 769 | 19,763 | 12,439 | 74 | 12,370 | 0 | 0 | 88,832 |
| Manufacturing (10-33) | 603,799 | 382,574 | 218,926 | 15,483 | 15,708 | 81,339 | 0 | 454 | 1,318,283 |
| Electricity and Gas (35) | 19,809 | 1,043,703 | 43,321 | 526,079 | 29,779 | 8,858 | 0 | 0 | 1,671,548 |
| Water Supply, Sewerage, and Waste Management (36-39) | 39,041 | 4,584 | 5,280 | 0 | 7,471 | 47,458 | 0 | 0 | 103,833 |
| Construction (41-43) | 32,105 | 9,263 | 33,432 | 30 | 205 | 14,825 | 0 | 0 | 89,860 |
| Wholesale, Retail, and Vehicle Repair (45-47) | 411,127 | 37,112 | 28,432 | 37 | 149 | 170,471 | 0 | 12 | 647,339 |
| Transportation and Storage (49-53) | 110,772 | 13,874 | 21,400 | 91 | 43 | 730,478 | 60,532 | 2,260,774 | 3,197,965 |
| Accommodation and Food Services (55-56) | 159,079 | 36,619 | 26,285 | 141 | 924 | 25,412 | 0 | 0 | 248,459 |
| Public Administration, Education, Health and Care (84-88) | 767,776 | 172,096 | 108,576 | 0 | 3,280 | 108,051 | 0 | 7,212 | 1,166,991 |
| Other Services Sectors | 401,467 | 63,070 | 38,400 | 53 | 405 | 137,366 | 0 | 574 | 641,336 |
| Total (€000 excl. VAT) | 2,588,392 | 1,763,665 | 543,815 | 554,353 | 58,038 | 1,336,626 | 60,532 | 2,269,025 | 9,174,446 |
| Table 5G Energy Consumption in Thousand Euro by Summary Energy Product and Summary NACE Rev.2 Sector 2011 | |||||||||
| €000 | |||||||||
| NACE Rev.2 Sector | Electricity | Total Natural Gas | Total Petroleum Fuels | Total Solid Fuels | Total Renewable Energy (incl. Waste) | Total Road Transport Fuels | Total Rail Transport Fuels | Total Aviation Transport Fuels | Total (€000 excl. VAT) |
| Mining and Quarrying (05-09) | 42,531 | 1,221 | 21,571 | 10,554 | 66 | 14,820 | 0 | 0 | 90,763 |
| Manufacturing (10-33) | 596,685 | 396,080 | 183,704 | 14,568 | 13,604 | 105,685 | 0 | 493 | 1,310,819 |
| Electricity and Gas (35) | 6,882 | 1,180,623 | 37,995 | 400,224 | 27,617 | 8,746 | 0 | 0 | 1,662,087 |
| Water Supply, Sewerage, and Waste Management (36-39) | 38,186 | 5,244 | 5,693 | 0 | 5,941 | 41,395 | 0 | 0 | 96,458 |
| Construction (41-43) | 16,346 | 6,792 | 14,942 | 4 | 0 | 4,343 | 0 | 0 | 42,426 |
| Wholesale, Retail, and Vehicle Repair (45-47) | 521,611 | 38,589 | 24,657 | 34 | 123 | 165,900 | 0 | 5 | 750,919 |
| Transportation and Storage (49-53) | 115,116 | 12,406 | 25,875 | 55 | 49 | 707,619 | 57,433 | 2,022,437 | 2,940,989 |
| Accommodation and Food Services (55-56) | 158,174 | 29,372 | 25,726 | 436 | 913 | 28,260 | 0 | 0 | 242,882 |
| Public Administration, Education, Health and Care (84-88) | 700,727 | 119,651 | 105,687 | 18 | 1,961 | 107,503 | 0 | 6,061 | 1,041,609 |
| Other Services Sectors | 362,113 | 54,046 | 34,547 | 27 | 151 | 101,711 | 0 | 1,012 | 553,607 |
| Total (€000 excl. VAT) | 2,558,371 | 1,844,023 | 480,395 | 425,920 | 50,425 | 1,285,983 | 57,433 | 2,030,008 | 8,732,558 |
| Table 5H Energy Consumption in Thousand Euro by Summary Energy Product and Summary NACE Rev.2 Sector 2010 | |||||||||
| €000 | |||||||||
| NACE Rev.2 Sector | Electricity | Total Natural Gas | Total Petroleum Fuels | Total Solid Fuels | Total Renewable Energy (incl. Waste) | Total Road Transport Fuels | Total Rail Transport Fuels | Total Aviation Transport Fuels | Total (€000 excl. VAT) |
| Mining and Quarrying (05-09) | 39,128 | 973 | 20,178 | 13,809 | 56 | 9,179 | 0 | 0 | 83,324 |
| Manufacturing (10-33) | 538,605 | 261,648 | 184,110 | 13,114 | 14,487 | 52,159 | 0 | 387 | 1,064,511 |
| Electricity and Gas (35) | 33,136 | 1,446,782 | 64,835 | 393,853 | 23,795 | 12,567 | 0 | 0 | 1,974,969 |
| Water Supply, Sewerage, and Waste Management (36-39) | 75,693 | 10,132 | 10,242 | 0 | 5,245 | 59,139 | 0 | 0 | 160,451 |
| Construction (41-43) | 61,422 | 5,611 | 48,551 | 9 | 0 | 8,774 | 0 | 0 | 124,367 |
| Wholesale, Retail, and Vehicle Repair (45-47) | 375,082 | 38,010 | 19,180 | 40 | 23 | 209,056 | 0 | 4 | 641,395 |
| Transportation and Storage (49-53) | 150,208 | 18,108 | 30,082 | 24 | 55 | 738,334 | 49,352 | 1,423,313 | 2,409,477 |
| Accommodation and Food Services (55-56) | 121,180 | 24,553 | 15,731 | 45 | 345 | 36,590 | 0 | 0 | 198,444 |
| Public Administration, Education, Health and Care (84-88) | 706,519 | 140,003 | 100,243 | 42 | 1,479 | 98,256 | 0 | 4,338 | 1,050,880 |
| Other Services Sectors | 336,996 | 41,654 | 29,802 | 47 | 334 | 142,023 | 0 | 844 | 551,700 |
| Total (€000 excl. VAT) | 2,437,969 | 1,987,475 | 522,955 | 420,983 | 45,818 | 1,366,079 | 49,352 | 1,428,886 | 8,259,518 |
| Table 5I Energy Consumption in Thousand Euro by Summary Energy Product and Summary NACE Rev.2 Sector 2009 | |||||||||
| €000 | |||||||||
| NACE Rev.2 Sector | Electricity | Total Natural Gas | Total Petroleum Fuels | Total Solid Fuels | Total Renewable Energy (incl. Waste) | Total Road Transport Fuels | Total Rail Transport Fuels | Total Aviation Transport Fuels | Total (€000 excl. VAT) |
| Mining and Quarrying (05-09) | 45,298 | 1,425 | 19,083 | 16,196 | 44 | 14,954 | 0 | 0 | 97,000 |
| Manufacturing (10-33) | 707,335 | 214,881 | 160,530 | 14,924 | 8,287 | 81,049 | 0 | 387 | 1,187,392 |
| Electricity and Gas (35) | 36,690 | 1,317,261 | 51,708 | 432,965 | 22,489 | 7,953 | 0 | 0 | 1,869,066 |
| Water Supply, Sewerage, and Waste Management (36-39) | 110,706 | 14,874 | 13,525 | 0 | 3,079 | 110,876 | 0 | 0 | 253,060 |
| Construction (41-43) | 26,088 | 1,656 | 19,944 | 19 | 20 | 7,824 | 0 | 0 | 55,551 |
| Wholesale, Retail, and Vehicle Repair (45-47) | 355,663 | 30,123 | 23,207 | 53 | 28 | 168,867 | 0 | 3 | 577,943 |
| Transportation and Storage (49-53) | 118,070 | 12,568 | 19,714 | 62 | 18 | 580,247 | 44,825 | 1,423,371 | 2,198,876 |
| Accommodation and Food Services (55-56) | 139,213 | 26,507 | 18,939 | 163 | 1,136 | 45,722 | 0 | 0 | 231,680 |
| Public Administration, Education, Health and Care (84-88) | 603,199 | 128,537 | 86,758 | 10 | 1,143 | 71,790 | 0 | 1,246 | 892,684 |
| Other Services Sectors | 323,416 | 35,538 | 27,935 | 54 | 12 | 150,782 | 0 | 883 | 538,619 |
| Total (€000 excl. VAT) | 2,465,677 | 1,783,369 | 441,341 | 464,448 | 36,255 | 1,240,063 | 44,825 | 1,425,891 | 7,901,870 |
| Table 6A Energy Consumption in ktoe by participation in Emissions Trading Scheme (ETS) 2009-2017 | |||||||||
| ktoe | |||||||||
| ETS | 2009 | 2010 | 2011 | 2012 | 2013 | 2014 | 2015 | 2016 | 2017 |
| Yes | 5,738 | 6,121 | 5,529 | 5,620 | 5,337 | 5,318 | 5,448 | 6,113 | 5,880 |
| No | 6,868 | 6,865 | 6,901 | 7,013 | 6,627 | 6,739 | 6,907 | 7,318 | 7,617 |
| Total (ktoe) | 12,606 | 12,986 | 12,429 | 12,633 | 11,964 | 12,057 | 12,355 | 13,432 | 13,496 |
| Table 6B Energy Consumption in ktoe by Summary Energy Product and participation in Emissions Trading Scheme (ETS) 2017 | |||
| ktoe | |||
| Energy Product | Emissions Trading Scheme | Total | |
| Yes | No | ||
| Electricity | 214 | 1,602 | 1,816 |
| Total Natural Gas | 3,599 | 986 | 4,586 |
| Total Petroleum Fuels | 211 | 511 | 722 |
| Total Solid Fuels | 1,584 | 1 | 1,584 |
| Total Renewable Energy (incl. Waste) | 267 | 111 | 378 |
| Total Road Transport Fuels | 5 | 930 | 935 |
| Total Rail Transport Fuels | 0 | 42 | 42 |
| Total Aviation Transport Fuels | 0 | 3,434 | 3,434 |
| Total (ktoe) | 5,880 | 7,617 | 13,496 |
| Table 6C Energy Consumption in Thousand Euro by participation in Emissions Trading Scheme (ETS) 2009-2017 | |||||||||
| €000 | |||||||||
| ETS | 2009 | 2010 | 2011 | 2012 | 2013 | 2014 | 2015 | 2016 | 2017 |
| Yes | 2,314,485 | 2,433,917 | 2,246,932 | 2,242,395 | 2,389,780 | 2,082,524 | 1,993,918 | 2,144,389 | 2,119,163 |
| No | 5,587,385 | 5,825,601 | 6,485,626 | 6,932,051 | 6,717,127 | 6,500,876 | 5,843,763 | 5,418,818 | 5,861,651 |
| Total (€000 excl. VAT) | 7,901,870 | 8,259,518 | 8,732,558 | 9,174,446 | 9,106,907 | 8,583,400 | 7,837,681 | 7,563,207 | 7,980,813 |
| Table 7A Energy Consumption in ktoe by County 2009-2017 | |||||||||
| ktoe | |||||||||
| County | 2009 | 2010 | 2011 | 2012 | 2013 | 2014 | 2015 | 2016 | 2017 |
| Carlow | 42 | 38 | 35 | 38 | 38 | 40 | 34 | 35 | 39 |
| Cavan | 180 | 148 | 128 | 158 | 125 | 160 | 178 | 180 | 181 |
| Clare | 74 | 80 | 77 | 71 | 75 | 100 | 92 | 100 | 91 |
| Cork | 562 | 754 | 959 | 964 | 890 | 834 | 903 | 1,066 | 1,047 |
| Donegal | 85 | 79 | 65 | 64 | 68 | 65 | 64 | 69 | 72 |
| Dublin | 8,759 | 8,925 | 8,282 | 8,497 | 7,712 | 7,581 | 7,893 | 8,704 | 8,726 |
| Galway | 200 | 199 | 169 | 181 | 175 | 184 | 171 | 164 | 144 |
| Kerry | 121 | 112 | 105 | 100 | 109 | 100 | 103 | 100 | 103 |
| Kildare | 370 | 363 | 365 | 331 | 347 | 375 | 408 | 425 | 445 |
| Kilkenny | 114 | 128 | 117 | 114 | 112 | 116 | 116 | 108 | 126 |
| Laois | 29 | 26 | 24 | 22 | 24 | 25 | 21 | 23 | 30 |
| Leitrim | 11 | 11 | 16 | 15 | 22 | 23 | 23 | 22 | 18 |
| Limerick | 592 | 652 | 625 | 653 | 806 | 829 | 822 | 874 | 846 |
| Longford | 25 | 29 | 42 | 35 | 30 | 35 | 41 | 33 | 34 |
| Louth | 259 | 215 | 186 | 217 | 221 | 266 | 283 | 293 | 291 |
| Mayo | 78 | 68 | 78 | 74 | 71 | 82 | 79 | 90 | 74 |
| Meath | 138 | 157 | 140 | 139 | 151 | 166 | 155 | 164 | 194 |
| Monaghan | 57 | 38 | 49 | 42 | 48 | 90 | 45 | 35 | 47 |
| Offaly | 240 | 223 | 230 | 224 | 223 | 244 | 222 | 247 | 248 |
| Roscommon | 31 | 33 | 34 | 26 | 28 | 29 | 28 | 29 | 27 |
| Sligo | 65 | 74 | 60 | 59 | 80 | 74 | 80 | 66 | 72 |
| Tipperary | 170 | 199 | 181 | 162 | 172 | 172 | 181 | 186 | 190 |
| Waterford | 158 | 154 | 175 | 154 | 148 | 144 | 111 | 120 | 152 |
| Westmeath | 79 | 88 | 89 | 85 | 99 | 109 | 101 | 99 | 98 |
| Wexford | 96 | 128 | 132 | 144 | 124 | 133 | 125 | 113 | 125 |
| Wicklow | 65 | 54 | 53 | 51 | 51 | 68 | 55 | 65 | 57 |
| Foreign | 8 | 12 | 17 | 13 | 13 | 13 | 21 | 22 | 21 |
| Total (ktoe) | 12,606 | 12,986 | 12,429 | 12,633 | 11,964 | 12,057 | 12,355 | 13,432 | 13,496 |
| Table 7B Energy Consumption in Thousand Euro by County 2009-2017 | |||||||||
| €000 | |||||||||
| County | 2009 | 2010 | 2011 | 2012 | 2013 | 2014 | 2015 | 2016 | 2017 |
| Carlow | 36,991 | 30,949 | 29,313 | 35,560 | 37,896 | 36,786 | 28,811 | 28,299 | 32,997 |
| Cavan | 90,945 | 77,630 | 73,922 | 92,438 | 86,315 | 95,995 | 86,708 | 96,956 | 100,771 |
| Clare | 74,651 | 82,168 | 96,037 | 87,741 | 98,803 | 107,398 | 90,168 | 83,099 | 75,533 |
| Cork | 468,821 | 591,498 | 684,990 | 735,091 | 744,064 | 638,801 | 661,322 | 695,489 | 687,558 |
| Donegal | 86,745 | 89,318 | 76,372 | 80,072 | 87,314 | 79,603 | 72,598 | 76,833 | 78,800 |
| Dublin | 4,962,297 | 5,084,969 | 5,375,001 | 5,735,320 | 5,455,221 | 5,025,680 | 4,542,232 | 4,360,844 | 4,728,664 |
| Galway | 207,900 | 223,202 | 193,967 | 225,897 | 235,662 | 213,855 | 202,904 | 188,305 | 164,085 |
| Kerry | 100,441 | 100,616 | 92,818 | 93,906 | 106,535 | 88,455 | 83,826 | 75,201 | 78,537 |
| Kildare | 348,957 | 334,728 | 353,852 | 331,083 | 354,236 | 364,885 | 381,110 | 362,133 | 402,913 |
| Kilkenny | 88,645 | 105,122 | 100,310 | 101,417 | 105,594 | 103,306 | 98,445 | 80,651 | 109,011 |
| Laois | 30,946 | 30,024 | 28,422 | 29,119 | 34,017 | 33,531 | 27,661 | 27,028 | 37,464 |
| Leitrim | 11,891 | 13,813 | 21,147 | 20,283 | 31,124 | 29,181 | 27,715 | 24,788 | 19,746 |
| Limerick | 248,381 | 324,995 | 380,077 | 369,032 | 439,198 | 442,148 | 356,912 | 337,627 | 304,204 |
| Longford | 24,597 | 30,855 | 37,745 | 37,972 | 37,998 | 42,201 | 43,295 | 33,872 | 35,172 |
| Louth | 146,507 | 122,287 | 102,718 | 115,220 | 120,821 | 123,919 | 139,563 | 130,950 | 110,338 |
| Mayo | 80,128 | 67,057 | 79,228 | 80,024 | 81,407 | 88,930 | 79,496 | 78,683 | 71,362 |
| Meath | 132,944 | 152,065 | 143,983 | 154,126 | 184,135 | 160,728 | 155,586 | 153,079 | 181,197 |
| Monaghan | 59,237 | 41,722 | 63,649 | 53,334 | 61,674 | 112,177 | 51,300 | 35,753 | 52,580 |
| Offaly | 145,608 | 139,724 | 129,942 | 140,735 | 132,430 | 140,787 | 127,553 | 127,405 | 142,731 |
| Roscommon | 29,391 | 33,727 | 35,060 | 29,083 | 30,589 | 25,245 | 22,123 | 22,754 | 22,054 |
| Sligo | 72,085 | 87,404 | 67,820 | 72,033 | 85,298 | 69,533 | 69,103 | 51,307 | 52,081 |
| Tipperary | 132,812 | 146,923 | 140,812 | 141,718 | 158,280 | 143,158 | 127,489 | 137,662 | 148,024 |
| Waterford | 89,620 | 88,874 | 142,882 | 110,440 | 110,639 | 110,341 | 94,584 | 90,277 | 104,811 |
| Westmeath | 64,957 | 66,163 | 64,190 | 59,124 | 71,945 | 71,115 | 61,423 | 60,506 | 55,790 |
| Wexford | 95,818 | 133,552 | 148,590 | 171,527 | 141,278 | 145,179 | 123,439 | 130,683 | 111,584 |
| Wicklow | 64,915 | 54,829 | 54,718 | 59,757 | 63,401 | 76,103 | 60,438 | 59,073 | 60,418 |
| Foreign | 5,642 | 5,307 | 14,992 | 12,395 | 11,034 | 14,360 | 21,878 | 13,952 | 12,388 |
| Total (€000 excl. VAT) | 7,901,870 | 8,259,518 | 8,732,558 | 9,174,446 | 9,106,907 | 8,583,400 | 7,837,681 | 7,563,207 | 7,980,813 |
Introduction
The Business Energy Use (BEU) survey was first undertaken in 2009 and it has been conducted on an annual basis since then. The primary purpose of the survey is to provide estimates of the quantities and costs of energy products used by enterprises in the Industry and Services sectors to operate their businesses. The CSO Business Statistics Division is responsible for selecting the sample, obtaining returns, and conducting initial editing. In 2013 the CSO Environment and Climate Division was assigned responsibility for the questionnaire design, detailed processing, integration of other data sources, weighting, and publication.
Legal basis
The BEU survey is a compulsory survey conducted under the Statistics (Business Energy Use Survey) Order 2018 (S.I. No. 509 of 2018) made under the Statistics Act, 1993.
Coverage
The sampling unit for the survey is an enterprise. The samples for the 2009 to 2016 surveys were selected from enterprises with 10 or more employees on the CSO Business Register. In 2017 the sample was broadened to include enterprises with 3-9 employees to give a better representation of smaller companies in the weighting. The annual sample is around 5,000 with a response rate of around 60%. A smaller sample was used in 2010 when only Industry enterprises were covered. In 2011, only Services enterprises were included in the sample.
Energy use by enterprises and family farms in NACE Divisions 01-03 (Agriculture, forestry and fishing) are not included in the results. Energy use by households is also excluded.
Both quantity and cost data are collected. Value Added Tax is excluded from the purchase cost.
National Accounts Residence Principle
This release is based on the National Accounts residence principle. This means that energy used abroad by enterprises resident in Ireland is included. Energy used in Ireland by foreign resident enterprises is not included e.g. fuel purchased by foreign hauliers in Ireland. The territory principle, which is used in Energy Balances and in the Greenhouse Gas Emission inventory, does not include energy used abroad by enterprises resident in Ireland but includes energy used in Ireland by enterprises that are not resident in Ireland e.g. road hauliers. This methodological difference is particularly important for aviation transport fuels.
Transformation fuels
The use of natural gas to produce electricity was collected as a separate item in the questionnaire. The use of other fuels such as coal and peat were recorded under their own categories and the transformation use of those fuels was not collected in the BEU questionnaire. In some cases, it can be inferred e.g. purchases of coal by enterprises producing electricity.
Weighting
The CSO’s Business Register provided the frame from which the annual BEU survey sample was selected. The register was used to weight sample data to the population by calculating factors based on the number of employees in the sample and in the register at NACE Rev.2 Division level. Some non-typical returns were assigned a weight of one to prevent them having an influence on other returns.
Questionnaire
The BEU e-Form is available on the CSO’s website at: Business Energy Use Survey Form 2019 (PDF 156KB).
The form has changed since the survey commenced in 2009. A specific question on road transport fuels was introduced in the 2013 survey.
The scope of the survey includes purchases of transformation fuels, e.g. to produce electricity, as well as final energy consumption uses.
The 2019 survey form collected data on the following categories:
Additional Data Sources
The survey returns were boosted with the inclusion of data from non-CSO administrative data sources and CSO structural business surveys. This was done to: maximise the use of existing data; to increase consistency with air emissions and energy balances data; and to increase the effective sample so that the survey could be weighted at NACE Rev.2 Division level. The additional data sources comprise a mixture of enterprise and local kind-of-activity unit. Some of the additional data sources only collect quantity data while others only collect data on fuel purchase costs. The CSO used average costs at NACE sector level to overcome these shortcomings.
To integrate the administrative data with the survey returns, the CSO matched the administrative registers with the CSO Business Register to obtain information on NACE sector and employment and to ensure that no company was included more than once from the different data sources. In some cases, a survey respondent was also included in an administrative data source. In these cases, the CSO compared and combined the responses as necessary e.g. the different data sources collected different energy product categories.
The CSO obtained access to the administrative microdata under the Statistics Act, 1993 which allows such data to be used by the CSO for statistical purposes.
- Emissions Trading Scheme
The Environmental Protection Agency collects quantity data from licenced installations on an annual basis. The data include fuel quantities only. The CSO used a mixture of monetary data from other data sources (e.g. the ETS enterprise may have made a Business Energy Use survey return) and unit prices to estimate corresponding fuel costs. There were returns for around 145 installations in 2017 and these represented around 80 enterprises after being matched with the CSO Business Register i.e. ETS installations could belong to the same enterprise. The ETS scheme comprises large industrial users and hence accounts for a very large proportion of energy consumption relative to the number of returns. Some energy products, such as electricity, were not collected as part of the ETS return but it was extracted in some cases by the CSO from EPA Annual Environmental Reports or from other data sources.
Users requiring definitive ETS figures should contact the EPA.
- Large Industry Energy Network
The Sustainable Energy Authority of Ireland administers the LIEN scheme. In 2017 there were around 155 LIEN returns. These returns typically relate to large energy users. Both quantity and cost data are collected. While the CSO examined all LIEN data, in some cases we used the return from the BEU if the enterprise was included in both data sources.
Users requiring definitive LIEN figures should contact the SEAI.
- Public Sector Energy Programme
The Sustainable Energy Authority of Ireland administers the energy monitoring and reporting scheme (M&R) under the PSEP. The returns comprise a mixture of utility meter data and directly collected data. The coverage of the scheme has broadened considerably in recent years to include more schools. PSEP returns were only included by the CSO if the public sector body had validated their meter numbers and submitted a return to SEAI for non-metered fuels. This large number of returns has resulted in a very high coverage of public sector energy use in the survey. Only quantity data were collected. The CSO used unit prices to estimate costs.
Users requiring definitive M&R figures should contact the SEAI.
- Annual Services Inquiry
The ASI is an annual multi-purpose CSO survey of the services sector with 2 or more employees. The ASI was a precursor to the Business Energy Use survey. Detailed fuel purchase costs were collected in occasional years prior to 2009. Since then only the total cost of fuel purchases was collected each year. The CSO used pre-2009 enterprise-level profiles to distribute the total fuel purchase costs across energy products at enterprise level and then used unit costs to estimate quantities. More generalised profiles were used for enterprises that could not be matched with pre-2009 ASI returns. Adjustments were made for some known fuel use trends that occurred after 2008 e.g. increased proportion of diesel vehicles.
ASI data was not used in cases where the enterprise was a respondent in the BEU survey or was included in the administrative data. The main purpose of using the ASI data was to get coverage across all services NACE Divisions especially medium and smaller sized enterprises. The ASI was particularly useful in 2010 when the services sector was not included in the BEU sample.
- Census of Industrial Production
The Census of Industrial Production is an annual multi-purpose CSO survey of enterprises with 10 or more employees. The CIP was a precursor to the Business Energy Use survey in so far as detailed fuel purchase costs were collected in occasional years prior to 2009. Since then only the total cost of fuel purchases was collected. The CSO used pre-2009 profiles to distribute the total fuel purchase costs across energy products at enterprise level and then used BEU unit costs to estimate quantities. More generalised profiles were used for enterprises that could not be matched with pre-2009 CIP returns.
CIP data were not used in cases where the enterprise was a respondent in the BEU survey or in the administrative data. The main purpose of using the CIP data was to get coverage across all industry NACE Divisions. The CIP was particularly useful in 2011 when the industry sector was not included in the BEU sample.
- Overview of Returns by Data Source at Enterprise Level
The following table indicates the number of enterprise returns used to compile the Business Energy Use survey results. To distinguish the ETS and non-ETS sectors, we classified all ETS returns as ETS. In contrast, in some cases where there was both LIEN and BEU data for an enterprise and if the BEU return was used, then the source was described as BEU. The table shows how the inclusion of other data sources has greatly increased the effective sample to allow weighting to be done at NACE Rev. 2 Division level rather than at a more aggregated level. This more detailed level allows for more flexibility in aggregating the data e.g. energy industries.
|
Source |
2009 |
2010 |
2011 |
2012 |
2013 |
2014 |
2015 |
2016 |
2017 |
|
Business Energy Use survey |
2,421 |
1,848 |
3,273 |
3,134 |
3,164 |
3,175 |
3,097 |
2,843 |
2,888 |
|
Emissions Trading Scheme |
78 |
76 |
75 |
73 |
72 |
72 |
74 |
76 |
78 |
|
Large Industry Energy Network |
30 |
39 |
70 |
28 |
31 |
44 |
46 |
62 |
57 |
|
Public Sector Energy Programme |
192 |
229 |
221 |
251 |
1,989 |
2,094 |
2,095 |
2,046 |
1,822 |
|
Annual Services Inquiry |
9,680 |
5,937 |
4,900 |
5,091 |
4,861 |
5,541 |
5,862 |
5,500 |
5,387 |
|
Census of Industrial Production |
4,204 |
3,449 |
4,681 |
3,816 |
3,939 |
1,408 |
1,332 |
1,349 |
1,237 |
|
CSO imputed return |
24 |
51 |
42 |
31 |
22 |
25 |
30 |
24 |
26 |
|
Total |
16,629 |
11,629 |
13,262 |
12,424 |
14,078 |
12,359 |
12,536 |
11,900 |
11,495 |
Imputation
While the survey is enterprise focused, in some cases a fuel approach was needed to ensure that niche fuels were accurately included in the survey results e.g. wood waste. The CSO added a small number of imputed returns in cases where an annual survey return was not available for a company with very specialised energy use.
Some of the data sources had only quantity or monetary data and the CSO imputed the missing data using actual returns from other enterprises.
The fuels collected varied across each data source and in some cases the CSO imputed some data at fuel level as necessary to fill these gaps.
The breakdown of the ASI and CIP data by energy product was imputed using pre-2009 ASI and CIP data and BEU unit costs. Some adjustments were made to reflect trends in the use of energy products since 2009.
Explicit questions were not included in the survey for road transport fuels for 2009-2012 and for other transport fuels for 2009-2017. The CSO used a variety of data sources to produce estimates for these fuels for those years.
The BEU sample excludes NACE sectors O (Public Administration), P (Education), and Q (Health and Residential Care). Hence data for these NACE sectors come from the Public Sector Energy Programme which has fuel quantities only. The CSO used BEU unit prices to estimate purchase costs for the PSEP returns.
Consumption units
A kilotonne of oil equivalent (ktoe) is a common unit of measurement which enables quantities of different fuels to be compared and aggregated. The following conversion factors were used for 2009-2017:
| Energy Product | ktoe (2009-2017) |
|---|---|
| 1 kilowatt hour of electricity | 0.000000086 |
| 1 kilowatt hour of natural gas | 0.000000086 |
| 1 litre of heavy fuel oil | 0.0009849 / 1062 |
| 1 litre of diesel | 0.0010344 / 1183 |
| 1 litre of kerosene | 0.0010556 / 1250 |
| 1 litre of liquid petroleum gas | 0.0011263 / 1915 |
| 1 tonne of coal | 0.000665 |
| 1 tonne of woodchip | 0.0003181 |
| 1 tonne of woodpellets | 0.0004127 |
| 1 litre of petrol | 0.0010650 / 1325 |
| 1 litre of autodiesel | 0.0010344 / 1183 |
| 1 litre of biodiesel | 0.0000008 |
| 1 kilowatt hour of biogas | 0.000000086 |
| 1 kilowatt hour of landfill gas | 0.000000086 |
| 1 tonne of tallow | 0.0009052 |
| 1 litre of jet kerosene | 0.0010533 / 1250 |
| 1 litre of aviation petrol | 0.0010650 / 1325 |
| ktoe |
1 tonne of peat |
1 tonne of petroleum |
1 tonne of solid recovered fuel |
1 tonne of wood waste |
|---|---|---|---|---|
| 2009 | 0.0001834 | 0.0007663 | 0.0003517 | 0.0003043 |
| 2010 | 0.0001895 | 0.0007663 | 0.0003060 | 0.0004115 |
| 2011 | 0.0001920 | 0.0007663 | 0.0003142 | 0.0003914 |
| 2012 | 0.0001850 | 0.0007767 | 0.0003250 | 0.0002749 |
| 2013 | 0.0001918 | 0.0007697 | 0.0003544 | 0.0002707 |
| 2014 | 0.0002037 | 0.0007797 | 0.0003565 | 0.0002765 |
| 2015 | 0.0002045 | 0.0007613 | 0.0003356 | 0.0002805 |
| 2016 | 0.0001985 | 0.0007642 | 0.0003279 | 0.0002711 |
| 2017 | 0.0001934 | 0.0007555 | 0.0003815 | 0.0002657 |
NACE Rev. 2
The Statistical classification of economic activities in the European Community is NACE. The NACE classification is a way of categorising economic activities into a common structure. The survey data were weighted at NACE division level as this allows more flexibility in combining different NACE divisions and is more useful for compiling energy accounts and using the results in National Accounts Supply and Use tables.
In energy and emission inventory statistics, Transport is used to represent transport fuels rather than the NACE meaning of the transport sector. In the BEU results, transport fuels used by other NACE sectors were assigned to the NACE sector of the reporting enterprise. For example, road transport fuels used by waste collection vehicles were attributed to the NACE Rev.2 classification for the waste industry.
Revisions
Some figures that were published in the Business Energy Use 2016 release have been revised in this release.
Some 2009-2017 data may be revised when the 2018 results are published. Aviation, marine, and rail fuels were not asked as explicit questions in the 2009-2017 surveys. These fuels will be collected in explicit questions in a pilot 2018 survey. If possible a time series for marine fuels will be compiled for a future release.
Renewable Fuels
Road diesel is pre-blended with biodiesel before being sold on forecourts. Hence purchases at forecourts include some amount of renewable fuels (around 5%). The CSO has not made an adjustment to the autodiesel figures to account for this mixing hence our estimate for biodiesel is lower than the actual levels and our estimate of road diesel is correspondingly higher.
The range of renewable fuels being used has broadened considerably in recent years. Amendments were made to the questionnaire to reflect this trend e.g. taking some fuels out of drop-down menus to ask them as individual questions.
In the Business Energy Use 2015 release, we published separate data for wood chips, wood pellets and wood waste. In subsequent releases we have combined wood chips, wood pellets, wood waste and wood logs as there were inconsistencies in the reporting of them across enterprises and across years.
Road Transport Fuels
These were not explicitly collected in the 2009-2012 BEU surveys hence the results presented for those years should be treated with caution as they were mainly compiled from the other data sources. In some cases, a BEU respondent provided data for road fuel in the 2009-2012 surveys e.g. under diesel. The CSO reassigned such fuel to autodiesel if it was possible to identify it or if the respondent had submitted a comment to that affect with the survey return e.g. a return from a road haulier which contained a large quantity under diesel.
Rail Transport Fuels
There were no explicit questions on rail fuels in the 2009-2017 questionnaires however some enterprises submitted data under items such as diesel. The results are derived from a mixture of the survey data and other administrative data including company reports.
Aviation Transport Fuels
There were no explicit questions on aviation fuels in the 2009-2017 questionnaires however some enterprises submitted data under items such as kerosene. The CSO examined returns from airline companies and used additional data on flights by Irish airlines to estimate the quantity and cost of these fuels.
The estimates are based on the National Accounts residence principle. Hence fuel consumption relating to flights by Irish airlines between other foreign countries are included. This methodological difference has resulted in a substantial difference with the Energy Balance estimates for these fuels.
We used the Revenue Return of Oil Movements data to construct estimates for some companies that were not in the survey returns e.g. aviation petrol users.
Marine Transport Fuels
There were no explicit questions on marine fuels in the 2009-2017 questionnaire and there were limited data available from other sources. There are no figures for marine fuels included in this release.
County
Tables 7A and 7B classify activity by the county that the headquarters of an enterprise is located in. All activity of an enterprise is located to the same county even if there are local units in other counties. A small number of enterprises used addresses abroad.
Energy Balances
The CSO compared the results with the SEAI energy balances. There are methodological differences between both series e.g. definition of the Transport sector and the residence versus territorial principle. There is good alignment for some fuels and differences for other fuels between both series. The resolution of these differences could result in future revisions to the CSO figures. In general, the energy balances use a top-down approach to distribute fuel use across NACE sectors whereas a bottom-up approach is used in the Business Energy Use survey with the CSO business register used to calculate weights for the survey and administrative data.
 Hide Background Notes
Scan the QR code below to view this release online or go to
http://www.cso.ie/en/releasesandpublications/er/beu/businessenergyuse2017/
 Show Table 1A Energy Consumption in ktoe by Sector 2009-2017
 Hide Table 1A Energy Consumption in ktoe by Sector 2009-2017