
| Building and Construction Inquiry (BCI) 2008-2014 | |||||||||
| % change | |||||||||
| 2008 | 2009 | 2010 | 2011 | 2012 | 2013 | 2014 | 2008 - 2014 | 2013 - 2014 | |
| Gross Value Added (€ million) | 10,995 | 4,095 | 1,830 | 1,870 | 3,251 | 4,214 | 5,620 | -48.9 | 33.4 |
| Turnover (€ million) | 38,091 | 24,070 | 17,713 | 15,577 | 8,797 | 9,997 | 14,208 | -62.7 | 42.1 |
| Enterprises (number) | 61,905 | 57,472 | 52,607 | 50,256 | 49,530 | 48,502 | 47,349 | -23.5 | -2.4 |
| Persons engaged (number) | 190,069 | 134,313 | 104,545 | 94,640 | 89,351 | 91,122 | 99,860 | -47.5 | 9.6 |
This release provides data on the Construction sector in Ireland for the period 2008 - 2014. Revised figures for 2008 - 2011 are included, along with newly published figures for 2012 - 2014. The detailed tables present a breakdown of the numbers of active Construction enterprises, number of persons engaged in such enterprises as well as a range of financial information classified by economic activity and employment size.
The Construction series 2008 - 2011 has been revised due to a number of factors:
(i)There are now more active enterprises on the CSO Business Register.
There are now more enterprises considered active in the Construction sector per the CSO Business Register. These enterprises need to be measured. What is considered an active enterprise per the register of active enterprises in Ireland will determine its inclusion in the Construction series. Size class thresholds will no longer be applied. For example, the Building and Construction Inquiry previously didn't estimate for enterprises with zero persons engaged.
(ii) Non-response treatment & the greater use of administrative data. As part of the methodological review we have examined our methodology for non-respondents. We have aligned our non-response methodology more closely to the use of available administrative (tax) data and changed how we estimate for non-response. These new estimates for non-response are now incorporated into the Construction series, replacing the previous grossing/imputation methodology.
(iii) Other adjustments. During the review, the opportunity was taken to update the series for some sectoral NACE adjustments (enterprises being reclassified from one particular NACE sector to another).
As well documented, the Construction sector in Ireland has experienced significant adjustment since 2008. This has also contributed to data collection and estimation challenges for this sector, particularly around stock valuations and the timing of recording the associated losses. Care should therefore be taken in interpreting year on year changes. The overall trend for 2008 - 2014 provides a clearer insight into the Construction sector.
| Original Series | Revised Series | |
| 2008 | 47518 | 61905 |
| 2009 | 38014 | 57472 |
| 2010 | 32288 | 52607 |
| 2011 | 28080 | 50256 |
| 2012 | 49530 | |
| 2013 | 48502 | |
| 2014 | 47349 |
Main differences following revisions
Impact on number of enterprises & employment
As a result of incorporating the above revisions, more enterprises are now being measured for the Construction sector in Ireland. The original series measured around 36,000 enterprises. The revised series measures approximately 53,000 enterprises. This increase is mainly due to the removal of the size class thresholds. See Figure 2.
| Original Series | Revised Series | |
| 2008 | 151906 | 190069 |
| 2009 | 93321 | 134313 |
| 2010 | 91824 | 104545 |
| 2011 | 90109 | 94640 |
| 2012 | 89351 | |
| 2013 | 91122 | |
| 2014 | 99860 |
The new estimates for Construction employment levels are higher than the original series ranging from 5% to 44%. See Figure 3.
| Original Series | Revised Series | |
| 2008 | 10.623 | 10.995437927 |
| 2009 | 5.931 | 4.095361895 |
| 2010 | 3.508 | 1.829894787 |
| 2011 | 3.859 | 1.869989101 |
| 2012 | 3.251297058 | |
| 2013 | 4.214135956 | |
| 2014 | 5.619773938 |
Impact on Construction sector Gross Value Added
Updating the Construction series for the methodological improvements referenced above, results in lower estimates for GVA (except for 2008) – a decrease in the range of 31-52% depending on the year. The reason for a decrease when additional enterprises are added is due to the improved estimates of enterprise financial loss. Using Administrative tax data has enabled the survey to now include these losses. The period 2008 - 2011 in particular would have seen significant construction losses. See Figure 4.
Construction sector in Ireland 2008-2014 – main trends
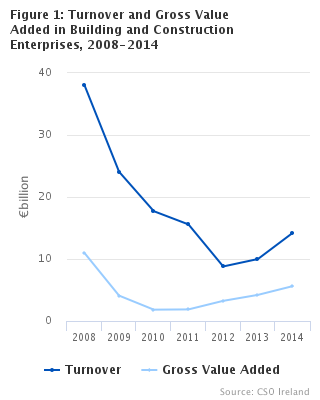
GVA for Construction enterprises decreased by 48.9% from €11bn in 2008 to €5.6bn in 2014. Over the same period, turnover went from €38.1bn to €14.2bn, a decrease of 62.7%. The number of Construction enterprises decreased by 23.5% from 61,905 in 2008 to 47,349 in 2014. The number of persons engaged in these Construction enterprises also declined by 47.5% from 190,069 to 99,860. See Headline Table and Figure 4.
Construction sector in Ireland, year on year changes 2013-2014
In 2014, there was an annual increase in GVA of 33.4% from €4.2bn in 2013 to €5.6bn. The year on year change in Construction turnover was higher at 42.1% up from €10bn in 2013 to €14.2bn in 2014. The number of Construction enterprises was down from 48,502 in 2013 to 47,349 in 2014, the number of persons engaged in these Construction enterprises was up 9.6% from 91,122 to 99,860. See Headline Table and Figure 4.
| Small and medium enterprises | Large enterprises | |
| 2008 | 9.848863798 | 1.146574128 |
| 2009 | 3.478761033 | 0.616600862 |
| 2010 | 1.436791934 | 0.393102852 |
| 2011 | 1.785483505 | 0.084505596 |
| 2012 | 3.043485879 | 0.207811179 |
| 2013 | 4.052570419 | 0.161565536 |
| 2014 | 5.141224916 | 0.478549022 |
GVA by enterprise size class
| Small and medium enterprises | Large enterprises | |
| 2008 | 177310 | 12759 |
| 2009 | 126642 | 7671 |
| 2010 | 99911 | 4634 |
| 2011 | 90793 | 3847 |
| 2012 | 85667 | 3684 |
| 2013 | 86494 | 4628 |
| 2014 | 92289 | 7571 |
Persons engaged by size class
Please note: Additional analysis for Building and Constructions sectors in Ireland, including International comparisons, will be available in the Business In Ireland 2014 publication.
Background Notes to Building & Construction Inquiry
Scope and Coverage
The Building and Construction Inquiry (BCI) introduced in 2009 for reference year 2008 onwards, replaces the Census of Building and Construction (CBC). BCI covers private firms with 10 or more persons engaged, and also covers a sample of private firms with less than 10 persons engaged.
Administrative data (tax) is used to estimate the financial variables of non-respondent and non-sampled enterprises..
Introduction of NACE Rev. 2
All Firms classified according to NACE Rev. 2. Prior to 2008, CBC results were classified according to NACE Rev. 1.1. For further information on the NACE Rev. 2 classification of industrial activity visit the CSO website: Classification of Industrial Activity.
History
The Census of Building and Construction first appeared as a separate census in 1966. Prior to that, data on the building and construction sector was collected and published in the Irish Statistical Bulletin/ Irish Trade Journal as part of the Census of Industrial Production (first inclusion in the 1926 Census). It was first published as a separate release document in 1981. Data since 1981 is available electronically on our website www.cso.ie via CSO Statistical Databases/Statbank.
Section F of NACE Rev. 2 - All building and construction comprising: NACE Activity Classifications
Nace 41.1 Development of building projects
Nace 41.2 Construction of residential and non-residential buildings
Nace 42.1 Construction of roads and railways
Nace 42.2 Construction of utility projects
Nace 42.9 Construction of other civil engineering projects
Nace 43.1 Demolition and site preparation
Nace 43.2 Electrical, plumbing and other construction installation activities
Nace 43.3 Building completion and finishing
Nace 43.9 Other specialised construction activities
Definition of Variables
Employees are persons who are paid a fixed wage or salary. Persons at work or temporarily absent because of illness, holidays, strike etc. are included. Persons working on a labour-only subcontract basis are excluded.
Wages and salaries is the gross amount paid to employees before deduction of income tax, employees' social security contributions etc. plus payments to labour-only subcontractors. Overtime pay, bonuses, holiday pay and sick pay are included.
Production value represents the net selling value of work done during the year, whether sold or not. It is valued exclusive of VAT. It incorporates an element of double counting arising from the fact that work done on a subcontract basis by firms in a particular sector for other firms in the same sector is included in the turnover figures provided by both firms. However, in the calculation of Gross Value Added and variable 43 (value of work done by own staff) this double counting is eliminated.
Intermediate consumption represents the value of building materials, fuel, industrial services and other goods and services used in production. The definition of this variable has been changed from that given in the 1981 results (Statistical Bulletin, March 1985) to include payments to subcontractors as part of the cost of industrial services, thereby eliminating double counting from the Gross Value Added figures.
Gross Value Added is the difference between production value and intermediate consumption and represents the value added by the firm. Because work done by subcontractors is treated as part of intermediate consumption, there is no double counting in this variable.
 Hide Background Notes
Scan the QR code below to view this release online or go to
http://www.cso.ie/en/releasesandpublications/er/bci/buildingandconstructioninquiry2014/
 Show Background Notes
 Hide Background Notes