
| Cereal and Potato Production 2020 | |||||
| '000 tonnes | |||||
| Wheat | Oats | Barley | Total Cereals | Potatoes | |
| 2019 | 636 | 203 | 1,558 | 2,396 | 382 |
| 2020 | 393 | 190 | 1,430 | 2,013 | 300 |
| % change | -38.2 | -6.3 | -8.2 | -16.0 | -21.5 |
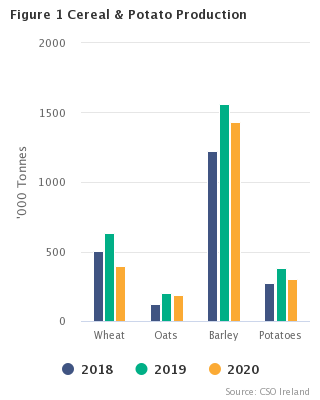
Overall production of the three main cereals (wheat, oats and barley) decreased from 2,396,000 tonnes in 2019 to 2,013,000 tonnes in 2020 (-16%). This was due to a combined drop in the production of all three main winter cereals (-47.7%), despite a combined rise in the production of all three main spring cereals (+40.3%). See Table 3.
The production of potatoes decreased from 382,000 tonnes in 2019 to 300,000 tonnes in 2020 (-21.5%). The yield of potatoes decreased from 44.1 tonnes per hectare to 33.8 tonnes per hectare (-23.4%). See Tables 2-3.
Further comparisons with the 2019 results show that:
| Winter Wheat | Spring Wheat | Winter Oats | Spring Oats | Winter Barley | Spring Barley | Beans and Peas | Oilseed Rape | Potatoes | |
| 2010 | 532 | 137 | 80 | 68 | 245 | 978 | 25 | 28 | 420 |
| 2011 | 793 | 136 | 71 | 98 | 326 | 1086 | 16 | 56 | 356 |
| 2012 | 626 | 82 | 68 | 88 | 320 | 941 | 20 | 59 | 232 |
| 2013 | 422 | 123 | 43 | 149 | 342 | 1321 | 23 | 49 | 410 |
| 2014 | 663 | 54 | 88 | 62 | 559 | 1172 | 20 | 34 | 383 |
| 2015 | 610 | 86 | 105 | 93 | 712 | 1027 | 69 | 40 | 360 |
| 2016 | 587 | 60 | 110 | 73 | 644 | 836 | 71 | 34 | 352 |
| 2017 | 627 | 55 | 129 | 76 | 592 | 914 | 90 | 42 | 412 |
| 2018 | 485 | 22 | 80 | 42 | 509 | 716 | 23 | 41 | 273 |
| 2019 | 605 | 31 | 147 | 55 | 781 | 777 | 44 | 38 | 382 |
| 2020 | 308 | 85 | 68 | 122 | 426 | 1004 | 66 | 45 | 300 |
| Table 1 Area under Crops | |||||
| Description | June 2018 | June 2019 | June 2020 | Change 2019 - 2020 | |
| ' 000 hectares | ' 000 hectares | % | |||
| Wheat - total | 58.0 | 63.5 | 47.0 | -16.5 | -26.0 |
| Winter wheat | 54.4 | 59.7 | 35.4 | -24.2 | -40.6 |
| Spring wheat | 3.6 | 3.8 | 11.5 | 7.7 | 203.4 |
| Oats - total | 17.8 | 23.8 | 25.4 | 1.6 | 6.8 |
| Winter oats | 10.2 | 16.6 | 8.3 | -8.3 | -50.2 |
| Spring oats | 7.6 | 7.2 | 17.2 | 10.0 | 138.1 |
| Barley - total | 185.2 | 179.4 | 193.2 | 13.8 | 7.7 |
| Winter barley | 57.9 | 82.8 | 51.5 | -31.4 | -37.9 |
| Spring barley | 127.4 | 96.5 | 141.7 | 45.2 | 46.8 |
| Wheat, oats, barley - total | 261.0 | 266.7 | 265.6 | -1.1 | -0.4 |
| Beans and peas | 8.5 | 8.1 | 13.7 | 5.6 | 69.0 |
| Oilseed rape | 10.6 | 9.2 | 10.3 | 1.1 | 12.0 |
| Potatoes | 8.2 | 8.7 | 8.9 | 0.2 | 2.5 |
| Table 2 Yield of Crops | |||||
| Description | 2018 | 2019 | 2020 | Change 2019 - 2020 | |
| tonnes per hectare | tonnes per hectare | % | |||
| Wheat - total | 8.7 | 10.0 | 8.4 | -1.7 | -16.5 |
| Winter wheat | 8.9 | 10.1 | 8.7 | -1.5 | -14.3 |
| Spring wheat | 6.2 | 8.3 | 7.4 | -0.9 | -10.4 |
| Oats - total | 6.9 | 8.5 | 7.5 | -1.0 | -12.2 |
| Winter oats | 7.9 | 8.9 | 8.2 | -0.7 | -7.8 |
| Spring oats | 5.6 | 7.7 | 7.1 | -0.6 | -7.4 |
| Barley - total | 6.6 | 8.7 | 7.4 | -1.3 | -14.7 |
| Winter barley | 8.8 | 9.4 | 8.3 | -1.1 | -12.1 |
| Spring barley | 5.6 | 8.0 | 7.1 | -1.0 | -12.0 |
| Wheat, oats, barley - total | 7.1 | 9.0 | 7.6 | -1.4 | -15.7 |
| Beans and peas | 2.7 | 5.4 | 4.8 | -0.6 | -11.7 |
| Oilseed rape | 3.9 | 4.2 | 4.4 | 0.2 | 5.0 |
| Potatoes | 33.2 | 44.1 | 33.8 | -10.3 | -23.4 |
| Table 3 Production of Crops | |||||
| Description | 2018 | 2019 | 2020 | Change 2019 - 2020 | |
| ' 000 tonnes | ' 000 tonnes | % | |||
| Wheat - total | 507 | 636 | 393 | -243 | -38.2 |
| Winter wheat | 485 | 605 | 308 | -297 | -49.1 |
| Spring wheat | 22 | 31 | 85 | 54 | 172.0 |
| Oats - total | 122 | 203 | 190 | -13 | -6.3 |
| Winter oats | 80 | 147 | 68 | -80 | -54.1 |
| Spring oats | 42 | 55 | 122 | 67 | 120.4 |
| Barley - total | 1,225 | 1,558 | 1,430 | -127 | -8.2 |
| Winter barley | 509 | 781 | 426 | -354 | -45.4 |
| Spring barley | 716 | 777 | 1,004 | 227 | 29.3 |
| Wheat, oats, barley - total | 1,854 | 2,396 | 2,013 | -383 | -16.0 |
| Beans and peas | 23 | 44 | 66 | 22 | 49.3 |
| Oilseed rape | 41 | 38 | 45 | 7 | 17.6 |
| Potatoes | 273 | 382 | 300 | -82 | -21.5 |
This release presents final estimates of the area, yield and production of the main arable crops in 2020 together with the comparable estimates for 2018 and 2019. The June 2018 – June 2020 estimates for the area under crops shown in Table 1 have been obtained from the Department of Agriculture, Food and the Marine (DAFM) Basic Payment Scheme.
The yield estimates are obtained from a joint survey conducted by Teagasc and the CSO.
The yield figures are given on a “green” (as harvested) basis. The winter wheat yield refers to feed wheat. Similarly, the spring barley yield refers to feed barley. The oilseed rape yield is a weighted average of the winter and spring yield.
The bean and pea yield is the weighted average of bean yield and pea yield.
For potatoes, the early crop yield was applied to a proportion of the area under potatoes based on an estimate of the area sown under early potato varieties in each county. The main crop yield was applied to the remaining area.
The State production figure is calculated by multiplying the county area figures by the average county yield figures to produce county production figures that are aggregated to State production figures. The State yield figure is then calculated by dividing the State production figure by the State area figure, as per the Basic Payment areas from DAFM.
As a result of rounding there may be slight discrepancies between the sum (or difference) of the constituent items and the total shown. Percentage changes have been calculated on actual figures.
 Hide Background Notes
Scan the QR code below to view this release online or go to
http://www.cso.ie/en/releasesandpublications/er/aypc/areayieldandproductionofcrops2020/
 Show Table 1 Area under Crops
 Hide Table 1 Area under Crops