
| Annual Services Inquiry (ASI) 2008 - 2011 | |||||||
| Percentage change | |||||||
| 2008 | 2009 | 2010 | 2011 | 2008 - 2011 | 2010 - 2011 | ||
| Turnover (€ million) | 212,181 | 187,874 | 190,430 | 204,512 | -3.6 | + 7.4 | |
| Gross Value Added (€ million) | 51,595 | 45,838 | 46,532 | 48,990 | -5.0 | + 5.3 | |
| Persons engaged (number) | 995,777 | 918,547 | 891,190 | 893,300 | -10.3 | + 0.2 | |
Turnover in the Services and Distribution sector for 2011 was almost €205bn while Gross Value Added (GVA) was close to €49bn. This represents an annual increase of 7.4% in turnover and 5.3% in GVA since 2010. Over the reference period 2008 to 2011 turnover had decreased by 3.6% and GVA had dropped by 5%.
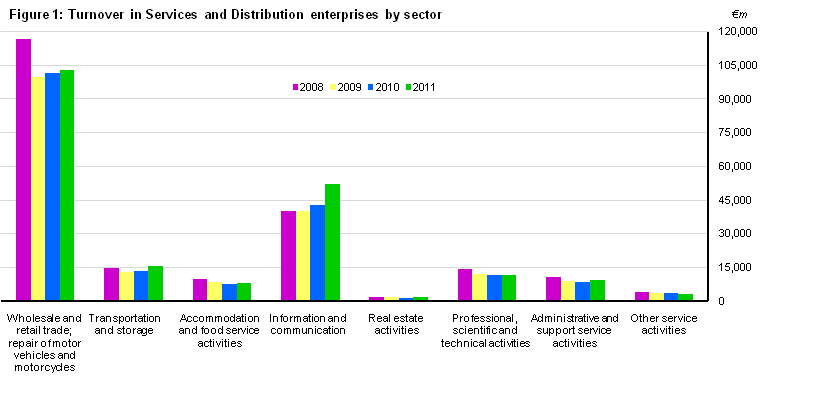
The most notable year on year changes in turnover for 2011 were increases in Information and communication, which grew by 22.8% and the Transportation and storage sector which reported an increase of 16.8%.
Of the increase of €14.1bn in total turnover, Information and communication accounted for €9.7bn and the Transportation and storage sector contributed a further €2.3 bn.
Accommodation and food service activities, which has seen year on year decreases since 2008, reversed this trend by showing an increase of 1.3% between 2010 and 2011.
The value of Professional, scientific and technical activities has seen year on year decreases since 2008, with a drop of 1.5% between 2010 and 2011. See Figure 1.

Annual Changes 2010 to 2011
The most significant annual changes in GVA were increases in Information and communication of 14.6% and Transportation and storage at 11.5%.
Of the increase of €2.5 bn in GVA, Information and communication accounted for €1.6 bn and the Transportation and storage sector accounted for €0.6 bn. See Figure 2.

There has been an annual increase of 0.2% in the number of persons engaged in the Services and Distribution sector in 2011, bringing total employment in the sector to 893,300.
Many individual sectors showed a small increase in employment in 2011 since the previous year. While the Information and communication sector, along with Administrative and support services sector experienced a decrease in employment between 2008 and 2010, they showed an increase of 2% and 2.2% respectively in 2011.
Overall, the number of people engaged in Services and Distribution enterprises dropped by 10.3% between 2008 and 2011.
Wholesale and Retail enterprises, the biggest employer in the Services and Distribution sector, experienced a reduction of 11.5% in employment, or 42,419 persons, between 2008 and 2011, of which a 1.2% decrease, or 3,962 persons, was experienced in 2011. See Figure 3.
Enterprises by size class
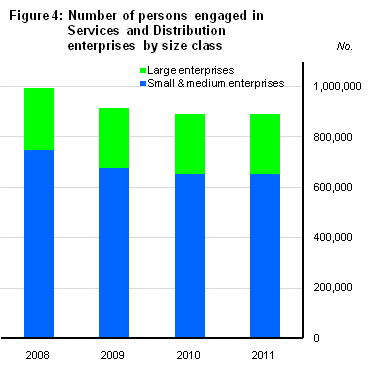
Over the period 2008-2011 the share of total Services and Distribution employment attributed to SMEs (Small and Medium sized Enterprises employing less than 250 persons) and large enterprises (250+ persons employed) has showed little change, with SMEs consistently accounting for 74% of employment and large enterprises the remaining 26%.
Both SMEs and large enterprises recorded marginal increases in employment between 2010 and 2011, up 0.3% and 0.2% respectively. See Figure 4.

Large enterprises increased turnover by €8.8bn in 2011 from 2010 levels, while SMEs showed an increase of €5.3bn. Large enterprises saw an increase in turnover of 16.8% between 2008 and 2011. Meanwhile SMEs experienced a decrease of 14.1% over the same period. See Figure 5.
Enterprises by nationality of ownership
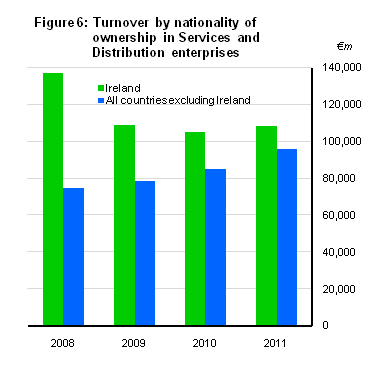
In 2011 Irish owned Services and Distribution enterprises accounted for almost 53% or €108bn of total Services and Distribution turnover, the remaining 47% or €96bn is accounted for by foreign owned enterprises. Since 2008 the share of total turnover attributed to foreign owned Service and Distribution enterprises has increased steadily from 35% in 2008 to 47% in 2011. There has been a corresponding decrease in the share of total Service and Distribution turnover from Irish owned enterprises, from 65% in 2008 to 53% in 2011. See Figure 6.

Total employment in Services and Distribution enterprises fell 10% between 2008 and 2011. This decline can largely be attributed to a fall in employment in Irish owned Service and Distribution enterprises. Employment in foreign owned enterprises fell by 3.3% or 5,781 persons between 2008 and 2011. Employment in Irish owned enterprises in this sector fell by 11.6% or 96,696 persons. By 2011, employment in foreign owned enterprises accounted for almost 19% of total Services and Distribution employment. See Figure 7.
Services and Distribution in EU27, 2010
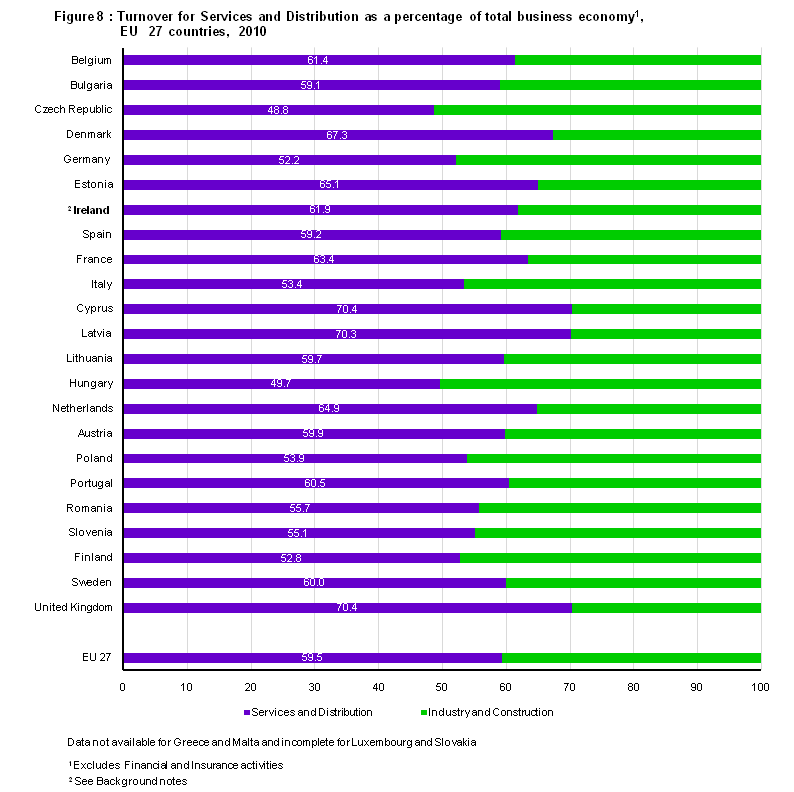
In 2010 the Services and Distribution Sectors account for 59.5% of turnover in the total business economy (excluding Financial Services) for the EU27 countries. Ireland is close to the average for the EU at 61.9%. The highest is the United Kingdom at 70.4 % followed by Cyprus and Latvia at 70.4% and 70.3% respectively. The lowest recorded is the Czech Republic at 48.8% with both Germany and Finland featuring below the average at 52.2% and 52.8% respectively. See Figure 8.
Please use the following links to access Services and Distribution annual data:
Statbank link - http://www.cso.ie/shorturl.aspx/177
Eurostat link - http://www.cso.ie/shorturl.aspx/176
The Annual Services Inquiry (ASI) has been conducted on annual basis since 1991. The purpose of the survey is to provide grossed estimates of the principal trading aggregates for all enterprises in the retail, wholesale, transportation and storage, accommodation and food, information and communication, real estate, professional, scientific, technical, administrative and other selected services sectors.
Legislation
Annual Services Inquiry is a compulsory survey conducted under the Statistics (Structural Business Inquiries) Order 2010 (S.I. No. 91 of 2010), made under the Statistics Act 1993 and Regulation (EC) No. 295 of 2008 of the European Parliament and of the Council concerning structural business statistics.
Central Business Register
The CSO’s Central Business Register provides the sampling frame from which the Annual Services Inquiry sample is selected each year. The Central Business Register is also used as the basis for the sampling frame used to gross sample data to the population The Business Register is updated continuously throughout the year.
Sample Design
The ASI is designed to provide grossed estimates of the principal trading aggregates for all enterprises in the relevant sectors. The ‘enterprise’ is the unit used for survey purposes i.e. one return is sought in respect of each enterprise covering all constituent branches, local units or subsidiaries. The sample is selected based on number of persons engaged in the enterprise i.e. number of proprietors plus number of full-time and part-time staff. A census of enterprises with 20 or more persons engaged is selected. In addition a stratified random sample is selected for the enterprises with less than 20 persons engaged, with decreasing sampling proportions taken in the lower persons engaged ranges.
All enterprises with 1 or more persons engaged are included in the survey frame. However, the units with 1 person engaged are not surveyed; the data for those are imputed directly from administrative data sources.
Grossing
Collected and edited data for companies with 2 or more persons engaged is aggregated using ratio estimators (a general estimator for the population total). Number of Persons Engaged is known for all members of the population and used as an auxiliary parameter for all monetary and employment variables.
Horvitz-Thomson estimator is used for number of enterprises and number of local units.
This process results in assigning every company on the final dataset two grossing factors (weights) dependent on the NACE code and employment size class . The underlying assumption in the ratio estimator strategy is that a variable of interest (e.g. turnover) and the auxiliary parameter (employment) are linearly connected. Units, for which this assumption is strongly violated (outliers), are identified and adjusted if necessary.
The data for units with 1 person engaged is imputed from administrative data sources directly, where possible. Variables that are not available, such as capital acquisitions and disposals, are modelled using linear regressions from respondents with 2 to 9 persons engaged. Horvitz-Thomson estimator is used to gross the data to account for units which have no administrative data available.
Number of Persons Engaged includes all full time and part-time employees. It also includes proprietors, partners and family members who work for an enterprise. It excludes agency workers.
Service and Distribution in EU27 2 Ireland includes NACE groups G-N (excl K) and R92, R93, S95 and S96. The other EU Countries include NACE groups G-N (excl K) and S95.
 Hide Background Notes
Scan the QR code below to view this release online or go to
http://www.cso.ie/en/releasesandpublications/er/asi/annualservicesinquiry2011/
 Show Background Notes
 Hide Background Notes