
| Output | Input | Terms of Trade | |
| Base year 2015=100 | |||
| 2017 | 106.5 | 98.2 | 108.4 |
| 2018 | 103.9 | 101.8 | 102.1 |
| % change | -2.4% | 3.6% | -5.8% |
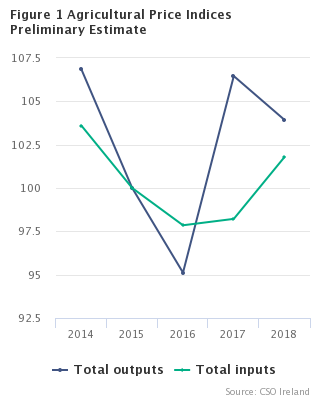
Preliminary estimates of the agricultural price indices for 2018 show a 3.6% increase in input prices from 2017 levels while output prices are estimated to decrease by 2.4%. See Tables 1, 2 and graph.
The projected increase in the input price index of 3.6% is due mainly to an increase in energy (9.0%), fertilisers (5.6%) and feeding stuffs (5.4%). See Table 2.
The projected decrease in the output price index of 2.4% is due mainly to decreases in pigs (-12.8%) and milk (-7.1%). See Table 1.
| Percentage Change | |
| Milk | -7.1 |
| Pigs | -12.8 |
| Cereals | 18.3 |
| Table 1 Agricultural Output Price Index 2018- Preliminary estimates (excl VAT) | |||||||
| Base Year 2015 = 100 | |||||||
| Category | 2014 | 2015 | 2016 | 2017 | 2018 | 2018/2017 | |
| Agricultural Output Price Index | 106.8 | 100.0 | 95.1 | 106.5 | 103.9 | -2.4% | |
| Animals | 94.5 | 100.0 | 95.4 | 97.8 | 95.4 | -2.5% | |
| Cattle | 90.4 | 100.0 | 93.0 | 94.7 | 93.9 | -0.9% | |
| Sheep | 98.8 | 100.0 | 99.9 | 99.7 | 104.8 | 5.2% | |
| Pigs | 109.4 | 100.0 | 102.6 | 110.4 | 96.2 | -12.8% | |
| Poultry | 101.2 | 100.0 | 99.5 | 99.2 | 99.0 | -0.2% | |
| Milk | 128.6 | 100.0 | 91.0 | 121.3 | 112.7 | -7.1% | |
| Crop Output | 100.0 | 100.0 | 106.1 | 104.1 | 118.6 | 13.9% | |
| Cereals (including seeds) | 105.8 | 100.0 | 101.3 | 101.9 | 120.5 | 18.3% | |
| Potatoes (including seeds) | 87.5 | 100.0 | 128.5 | 117.2 | 142.8 | 21.8% | |
| Fruit and Vegetables | 99.4 | 100.0 | 101.5 | 100.9 | 106.9 | 5.9% | |
| Percentage Change | |
| Feeding stuffs | 5.4 |
| Energy | 9.0 |
| Fertilisers | 5.6 |
| Table 2 Agricultural Input Price Index 2018 - Preliminary estimates (excl VAT) | ||||||
| Base Year 2015 = 100 | ||||||
| Category | 2014 | 2015 | 2016 | 2017 | 2018 | 2018/2017 |
| Agricultural Input Price Index | 103.6 | 100.0 | 97.9 | 98.2 | 101.8 | 3.6% |
| Feeding Stuffs | 107.7 | 100.0 | 100.0 | 100.6 | 106.0 | 5.4% |
| Fertilisers | 99.4 | 100.0 | 86.2 | 81.5 | 86.0 | 5.6% |
| Seeds | 104.2 | 100.0 | 98.5 | 98.5 | 97.7 | -0.9% |
| Energy | 112.7 | 100.0 | 91.9 | 97.8 | 106.6 | 9.0% |
| Plant Protection Products | 100.0 | 100.0 | 102.3 | 103.1 | 103.9 | 0.8% |
| Veterinary Expenses | 99.2 | 100.0 | 101.9 | 102.1 | 105.3 | 3.1% |
Introduction
This release presents preliminary estimates of agricultural price indices. The indices monitor trends in prices paid to farmers for their produce and in prices paid by farmers for purchases of goods and services. An EU harmonised methodology is used to compile these price indices.
The estimates are also sent to Eurostat, the Statistical Office of the European Union, who provide the Directorate-General for Agriculture in Brussels with forecasts of the annual EU agricultural price indices for the current year.
Methodology
The preliminary annual indices are compiled by using the published monthly indices from January to August, and forecast estimates for September to December. In line with EU recommendations, the annual input sub-indices are calculated as simple arithmetic averages of the monthly indices. The annual output sub-indices are calculated as the weighted averages of the monthly indices. The weights used to combine the changes in prices of the individual commodities are based on the annual value of sales off farms and the expenditure by farmers on input purchases for the base year for the output and input indices respectively. The Laspeyres index formula, involving the use of fixed base year weights, has been used in the compilation of the overall index numbers.
The agricultural terms of trade index is the output price index expressed as a percentage of the input price index.
Data Sources
The indices are compiled from a wide variety of sources, including direct CSO surveys and administrative data from the Department of Agriculture, Food and the Marine.
References
Agricultural Price Indices, monthly CSO release.
 Hide Background Notes
Scan the QR code below to view this release online or go to
http://www.cso.ie/en/releasesandpublications/er/apipe/agriculturalpriceindices2018-preliminaryestimates/
 Show Table 1 Agricultural Output Price Index 2018 - Preliminary estimates
 Hide Table 1 Agricultural Output Price Index 2018 - Preliminary estimates