
| Output | Input | Terms of Trade | |
| Base year 2015=100 | |||
| September 2020 | 105.3 | 101.4 | 103.8 |
| August 2021 | 114.6 | 112.0 | 102.3 |
| September 2021 | 117.6 | 113.5 | 103.6 |
| Monthly % Change | 2.6% | 1.4% | 1.2% |
| Annual % Change | 11.6% | 11.9% | -0.2% |
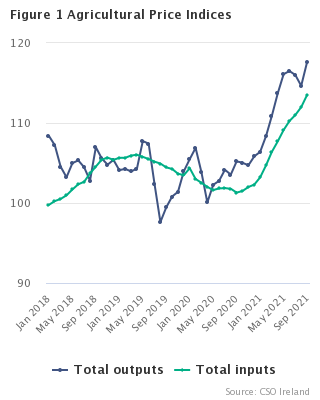
The agricultural output price index increased by 2.6% in September 2021 compared with August 2021. The agricultural input price index increased by 1.4% over the same period. Thus, the resulting terms of trade index was up 1.2% in this period. See Tables 1, 2 and graph.
On an annual basis, the agricultural input price index increased by 11.9% in September 2021 compared with September 2020. The agricultural output price index increased by 11.6% in September 2021 compared with September 2020. See Tables 1 and 2.
A further comparison of the September 2021 output sub-indices with the September 2020 sub-indices shows that cattle and milk increased by 16% and 15.8% respectively.
On the input side, the September 2021 sub-indices show that fertilisers and motor fuels were up 31.3% and 23.5% respectively on September 2020 prices.
| Table 1 Agricultural Output Price Index (excluding VAT) | |||||||||||||||
| Base Year 2015 = 100 | |||||||||||||||
| Category | Index | Monthly Change | Annual Change | ||||||||||||
| Sep-20 | Oct-20 | Nov-20 | Dec-20 | Jan-21 | Feb-21 | Mar-21 | Apr-21 | May-21 | Jun-21 | Jul-21 | Aug-21 | Sep-21 | Sep-21 / Aug-21 | Sep-21 / Sep-20 | |
| Agricultural Output Price Index | 105.3 | 105.1 | 104.8 | 105.9 | 106.4 | 108.3 | 111.0 | 113.7 | 116.1 | 116.5 | 116.0 | 114.6 | 117.6 | 2.6% | 11.6% |
| Crop Output | 123.2 | 117.9 | 114.9 | 110.8 | 111.3 | 111.3 | 111.0 | 112.9 | 113.9 | 114.5 | 112.3 | 107.8 | 124.7 | 15.7% | 1.2% |
| Cereals (including seeds) | 115.3 | 115.3 | 115.3 | 115.3 | 115.3 | 115.3 | 115.3 | 115.3 | 115.3 | 115.3 | 115.3 | 115.3 | 115.3 | 0.0% | 0.0% |
| Vegetables | 107.5 | 108.9 | 108.2 | 102.0 | 102.0 | 101.9 | 101.2 | 105.3 | 108.6 | 108.3 | 108.1 | 109.0 | 108.9 | .. | 1.3% |
| Potatoes (including seeds) | 180.3 | 145.8 | 130.1 | 121.9 | 124.6 | 124.6 | 124.6 | 125.9 | 123.4 | 127.9 | 115.4 | 87.3 | 185.4 | .. | 2.8% |
| Animal Output | 102.9 | 103.4 | 103.5 | 105.3 | 105.7 | 108.0 | 111.0 | 113.8 | 116.4 | 116.7 | 116.5 | 115.5 | 116.6 | 1.0% | 13.3% |
| Animals | 97.2 | 96.8 | 96.5 | 99.4 | 100.5 | 99.5 | 102.5 | 107.5 | 110.2 | 110.9 | 110.7 | 108.5 | 108.4 | -0.0% | 11.6% |
| Cattle | 92.9 | 92.5 | 92.0 | 95.9 | 98.0 | 96.6 | 98.5 | 103.1 | 105.3 | 107.0 | 109.2 | 107.1 | 107.8 | 0.6% | 16.0% |
| Cattle excluding calves | 92.6 | 92.2 | 91.8 | 95.7 | 97.8 | 96.8 | 98.7 | 103.2 | 105.4 | 107.0 | 109.2 | 107.0 | 107.5 | 0.5% | 16.1% |
| Calves | 138.1 | 137.6 | 128.2 | 125.7 | 124.0 | 64.7 | 67.4 | 89.6 | 86.6 | 101.6 | 109.5 | 122.6 | 145.5 | .. | 5.4% |
| Pigs | 109.8 | 109.9 | 108.6 | 107.2 | 106.2 | 104.5 | 106.6 | 111.9 | 114.3 | 115.8 | 111.9 | 108.1 | 104.8 | -3.1% | -4.6% |
| Sheep | 109.7 | 107.8 | 111.7 | 115.7 | 112.1 | 115.5 | 131.2 | 141.8 | 151.8 | 142.8 | 129.3 | 126.4 | 126.5 | .. | 15.3% |
| Poultry | 99.0 | 100.3 | 99.4 | 100.1 | 100.6 | 100.5 | 100.5 | 100.6 | 100.8 | 100.3 | 99.2 | 101.0 | 100.3 | -0.7% | 1.3% |
| Animal Products | 111.6 | 113.5 | 113.9 | 114.1 | 113.6 | 120.7 | 123.8 | 123.5 | 125.8 | 125.6 | 125.1 | 126.1 | 129.0 | 2.3% | 15.5% |
| Milk | 112.5 | 114.3 | 114.8 | 115.0 | 114.5 | 121.8 | 125.0 | 124.6 | 126.9 | 126.7 | 126.2 | 127.2 | 130.2 | 2.3% | 15.8% |
| Eggs | 99.3 | 99.3 | 99.3 | 99.9 | 99.9 | 100.1 | 100.1 | 101.0 | 103.7 | 104.4 | 104.6 | 104.6 | 104.6 | 0.0% | 5.4% |
| Wool | 11.9 | 11.9 | 11.9 | 11.9 | 11.9 | 11.9 | 11.9 | 11.9 | 13.6 | 13.6 | 13.6 | 13.6 | 13.6 | -0.0% | 13.7% |
| .. Comparison not valid as different basket of products are included each month. | |||||||||||||||
| ¹ Revised | |||||||||||||||
| Table 2 Agricultural Input Price Index (excluding VAT) | |||||||||||||||
| Base Year 2015 = 100 | |||||||||||||||
| Category | Index | Monthly Change | Annual Change | ||||||||||||
| Sep-20 | Oct-20 | Nov-20 | Dec-20 | Jan-21 | Feb-21 | Mar-21 | Apr-21 | May-21 | Jun-21 | Jul-21 | Aug-21 | Sep-21 | Sep-21 / Aug-21 | Sep-21 / Sep-20 | |
| Agricultural Input Price Index | 101.4 | 101.7 | 102.2 | 102.4 | 103.4 | 104.8 | 106.4 | 107.7 | 109.1 | 110.2 | 111.2 | 112.0 | 113.5 | 1.4% | 11.9% |
| Seeds | 101.0 | 100.9 | 100.9 | 100.9 | 100.9 | 100.9 | 110.5 | 110.5 | 110.5 | 110.5 | 110.5 | 110.5 | 110.5 | 0.0% | 9.4% |
| Energy | 95.3 | 96.3 | 96.5 | 95.3 | 97.7 | 100.5 | 105.4 | 106.7 | 108.7 | 109.9 | 113.2 | 115.1 | 116.5 | 1.3% | 22.2% |
| Electricity | 103.4 | 110.1 | 110.1 | 110.1 | 110.1 | 110.1 | 110.1 | 113.3 | 113.3 | 113.3 | 115.1 | 122.9 | 124.6 | 1.4% | 20.5% |
| Motor Fuels | 92.4 | 91.6 | 91.9 | 90.2 | 93.5 | 97.4 | 103.9 | 104.5 | 107.3 | 108.9 | 112.7 | 112.7 | 114.1 | 1.2% | 23.5% |
| Lubricants | 103.1 | 104.0 | 103.2 | 103.5 | 104.2 | 103.4 | 106.3 | 107.6 | 108.3 | 108.7 | 110.2 | 111.0 | 112.6 | 1.5% | 9.3% |
| Fertilisers | 79.2 | 79.3 | 79.2 | 79.0 | 79.2 | 82.5 | 86.8 | 90.3 | 94.2 | 95.1 | 96.9 | 100.2 | 104.0 | 3.8% | 31.3% |
| Straight Fertilisers | 74.6 | 74.6 | 74.5 | 74.2 | 74.2 | 78.2 | 84.6 | 89.5 | 94.0 | 95.1 | 97.0 | 100.0 | 102.7 | 2.7% | 37.6% |
| Compound Fertilisers | 80.2 | 80.3 | 80.2 | 80.2 | 80.4 | 83.5 | 86.9 | 89.8 | 93.5 | 94.5 | 96.2 | 100.0 | 104.7 | 4.7% | 30.5% |
| PK Fertilisers | 89.2 | 89.2 | 89.0 | 88.8 | 88.8 | 90.0 | 92.4 | 94.0 | 95.1 | 96.9 | 97.5 | 104.1 | 108.8 | 4.6% | 22.0% |
| NPK Fertilisers | 80.0 | 80.1 | 80.0 | 79.9 | 80.2 | 83.4 | 86.7 | 89.6 | 93.5 | 94.5 | 96.2 | 99.9 | 104.6 | 4.7% | 30.7% |
| Other Fertilisers | 105.7 | 105.7 | 105.7 | 105.7 | 105.7 | 105.7 | 105.7 | 105.7 | 105.7 | 105.7 | 105.7 | 105.7 | 105.7 | 0.0% | 0.0% |
| Plant Protection Products | 104.1 | 104.1 | 104.1 | 104.1 | 104.1 | 104.1 | 104.4 | 104.8 | 105.1 | 105.1 | 105.3 | 105.3 | 105.3 | 0.0% | 1.1% |
| Veterinary Expenses | 109.0 | 109.0 | 109.0 | 109.0 | 110.3 | 110.3 | 110.3 | 110.3 | 110.3 | 110.3 | 110.3 | 110.3 | 110.3 | 0.0% | 1.2% |
| Feeding Stuffs | 108.1 | 108.5 | 109.6 | 110.8 | 112.3 | 113.7 | 114.1 | 115.7 | 117.3 | 119.3 | 120.2 | 120.3 | 122.4 | 1.8% | 13.3% |
| Straight Feeding Stuffs | 109.8 | 112.3 | 115.8 | 117.7 | 120.6 | 123.3 | 122.1 | 123.0 | 124.6 | 126.5 | 127.0 | 127.4 | 129.9 | 2.0% | 18.3% |
| Compound Feeding Stuffs | 108.0 | 108.3 | 109.3 | 110.4 | 111.8 | 113.2 | 113.7 | 115.3 | 116.9 | 118.9 | 119.8 | 119.9 | 122.0 | 1.7% | 13.0% |
| Feeding Stuffs for Calves | 108.4 | 109.7 | 110.7 | 112.5 | 113.7 | 114.4 | 115.5 | 116.3 | 117.7 | 117.5 | 120.7 | 120.8 | 122.7 | 1.6% | 13.2% |
| Feeding Stuffs for Cattle excl. Calves | 106.7 | 107.2 | 108.4 | 110.1 | 111.9 | 113.1 | 114.5 | 116.2 | 117.9 | 118.9 | 119.9 | 120.0 | 122.8 | 2.3% | 15.1% |
| Feeding Stuffs for Pigs | 114.2 | 114.2 | 115.5 | 115.7 | 116.9 | 119.8 | 116.4 | 118.7 | 120.1 | 125.6 | 126.6 | 126.6 | 129.2 | 2.1% | 13.1% |
| Feeding Stuffs for Poultry | 105.5 | 105.2 | 105.5 | 105.8 | 106.2 | 106.5 | 107.9 | 108.9 | 110.9 | 113.0 | 113.0 | 113.1 | 112.5 | -0.5% | 6.7% |
| Other Compound Feeding Stuffs | 106.5 | 106.7 | 106.9 | 108.7 | 110.3 | 112.0 | 113.3 | 114.7 | 116.1 | 116.9 | 117.8 | 117.8 | 121.0 | 2.7% | 13.6% |
| Maintenance of Materials and Buildings | 105.3 | 105.3 | 105.7 | 105.8 | 105.7 | 106.5 | 106.6 | 106.6 | 106.7 | 107.1 | 107.1 | 107.6 | 107.9 | 0.3% | 2.4% |
| Other Goods and Services | 105.3 | 105.4 | 105.3 | 105.1 | 105.5 | 105.5 | 105.7 | 106.2 | 106.0 | 106.5 | 106.4 | 106.2 | 106.2 | -0.1% | 0.8% |
| ¹ Revised | |||||||||||||||
This release presents estimates of Agricultural Output and Input Price Indices. The indices monitor trends in prices paid to farmers for their produce and in prices paid by farmers for purchases of goods and services. An EU harmonised methodology is used to compile these price indices. The estimates are also sent to Eurostat, the Statistical Office of the European Union.
The agricultural output price indices are intended to measure trends in the price of agricultural produce sold by farmers. The agricultural input price indices are designed to measure trends in the price of farm inputs purchased for current consumption (i.e. non-capital materials and services). Both indices are compiled on the average farm concept. The average farm concept includes both sales to other economic sectors as well as sales/purchases of agricultural output between agricultural units for intermediate consumption purposes, excluding trade in animals between agricultural units. The weights used to combine the changes in prices of the individual commodities are based on the value of sales off farms and the expenditure by farmers on input purchases for the base year for the output and input indices respectively. The Laspeyres index formula, involving the use of fixed base year weights, has been used in the compilation of the monthly index numbers for all commodity groupings except vegetables, potatoes and sheep. Because of the highly seasonal nature of vegetables, potatoes and sheep, variable monthly baskets of products are priced for these commodities.
Monthly price series are used except for seasonal products where prices are only available at certain times during the year. In these cases, the monthly prices returned during the last selling period are continued unchanged until the product can be priced again. The monthly sub-indices are weighted by the base year value of sales and the expenditure on farm inputs to derive overall monthly total output and total input indices respectively. In line with EU recommendations, the annual input indices are calculated as simple arithmetic averages of the monthly indices. The annual output indices are calculated as the weighted averages of the monthly indices.
The agricultural terms of trade index is the output price index expressed as a percentage of the input price index. All percentage changes have been calculated on actual figures before the index is rounded to one decimal place.
The actual prices used for the index series are based on the market price without the deduction of bonuses, taxes or levies with the exception of deductible value added tax and third party levies. Standardised prices are used for milk and cereals to ensure that products of identical quality are priced in successive periods. In the case of milk for manufacturing, this means pricing at a fixed fat and protein content. Standardised cereal prices are based on the harvest price at 20% moisture content.
The indices are compiled from a wide variety of sources, including direct CSO surveys and administrative data from the Department of Agriculture, Food and the Marine. The actual sources are described more fully at: https://www.cso.ie/en/statistics/agriculture/agriculturalpriceindices/Agricultural Price Indices
 Hide Background Notes
Scan the QR code below to view this release online or go to
http://www.cso.ie/en/releasesandpublications/er/api/agriculturalpriceindicesseptember2021/
 Show Table 1 Agricultural Output Price Index (excluding VAT)
 Hide Table 1 Agricultural Output Price Index (excluding VAT)