
| € billion | ||
| Assets | 2008 | 2015 |
| Central Bank (S.121) | 121 | 78 |
| Monetary Financial Institutions (S.122 + S.123) | 1,743 | 1,092 |
| Investment Funds (S.124) | 342 | 1,778 |
| Other Financial Corporations (S.125 + S.126 + S.127) | 883 | 1,274 |
| Insurance Corporations and Pension Funds (S.128 + S.129) | 243 | 376 |
| Total Financial Sector (S.12) | 3,333 | 4,597 |
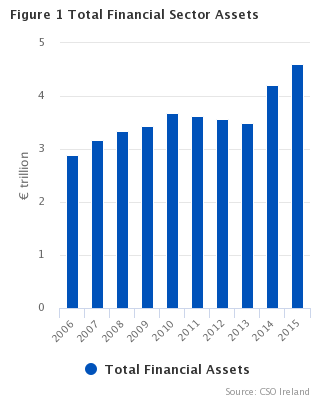
The balance sheet of financial corporations (S.12) grew markedly since 2013, reversing the trend in the period 2011-2013 of balance sheet contraction in the sector. The growth during the period 2014-2015 was driven primarily by activity in the Investment Funds (S.124) and Other Financial Corporations (S.125 + S.126 + S.127) sectors. The financial assets of sector S.12 increased by €394bn in 2015, while its liabilities grew from €4,245bn to €4,650bn during the same period. The evolution of the financial assets of S.12 from 2006 to 2015 is shown in Figures 1 and 2.
| Central Bank (S.121) | Monetary Financial Institutions (S.122+S.123) | Non-Money Market Investment Funds (S.124) | Other Financial Intermediaries (S.125 + S.126 + S.127) | Insurance Corporations and Pension Funds (S.128 + S.129) | |
| 2006 | 40.591038 | 1454.1215 | 447.61998600334 | 702.670119311054 | 250.522106144638 |
| 2007 | 53.706 | 1658.239 | 473.9771259391 | 728.096830972769 | 260.32070793476 |
| 2008 | 121.079 | 1743.4485 | 342.00704864 | 883.059966427234 | 243.27927511097 |
| 2009 | 124.734 | 1631.148 | 460.052942 | 952.178955600913 | 272.30176591083 |
| 2010 | 202.347 | 1499.922 | 645.503082 | 1036.9490191859 | 298.84338212025 |
| 2011 | 172.976 | 1241.2287 | 818.647995 | 1110.55554890945 | 284.114227494 |
| 2012 | 136.218 | 1115.791 | 1017.96992005701 | 1001.98324564349 | 296.716526195 |
| 2013 | 104.022 | 1000.968 | 1180.33169949584 | 899.554027290452 | 306.508616149 |
| 2014 | 82.55875421506 | 1061.70940788601 | 1627.49892597799 | 1082.58450180581 | 349.387732553 |
| 2015 | 78.395 | 1091.95020668559 | 1777.53764704774 | 1273.79204295147 | 375.745639452 |
Get the data: StatBank
Significant changes have taken place in the balance sheets of financial corporations in the wake of the global financial crisis over the 2008-2015 period. Some of these changes are apparent in the accounts but some are less evident due to offsetting shifts within the sector.
Central Bank (S.121)
The Central Bank (S.121) sector has seen a dramatic decrease in Currency and Deposits (AF.2) since 2010 and a large increase in Debt Securities (AF.3) in 2013, but with an overall downward trend in assets. In 2015, 81% of total financial assets came from Debt Securities (Figure 3) while 81% of total liabilities are Currency and Deposits (AF.2) with the remainder of liabilities mostly coming from Equity (AF.5). The assets of the Central Bank increased from €54bn in 2007 to €202bn in 2010 mainly as a result of the increased emergency liquidity assistance (ELA) provided to the Irish banking system.
In 2013 the conversion of assets from Currency and Deposits (AF.2) to Debt Securities (AF.3) was a result of securities acquired by the Central Bank following the liquidation of the Irish Bank Resolution Corporation (IBRC). The portfolio of securities was comprised of eight non-amortising Irish Government Floating Rate Notes (FRNs) (€28bn), non-amortising NAMA Bonds (€13bn) and the 5.4% Irish 2025 Government bond acquired by the Bank following the termination of the IBRC’s market repo in February 2013 (€4bn). For further details see Note 16 in the Central Bank Annual Report 2013 (page 122).
| Monetary Gold and Special Drawing Rights (SDRs) (AF.1) | Currency and Deposits (AF.2) | Debt Securities (AF.3) | Loans (AF.4) | Equity and Investment Fund Shares/Units (AF.5) | Other Accounts Receivable (AF.8) | |
| 2006 | 0.164 | 31.743 | 7.753 | 0.855 | 0.072 | 0.004 |
| 2007 | 0.187 | 41.714 | 7.188 | 4.544 | 0.073 | 0 |
| 2008 | 0.197 | 104.317 | 14.137 | 2.355 | 0.073 | 0 |
| 2009 | 0.967 | 105.695 | 14.391 | 3.608 | 0.073 | 0 |
| 2010 | 1.034 | 183.018 | 18.222 | 0 | 0.073 | 0 |
| 2011 | 0.989 | 152.501 | 19.486 | 0 | 0 | 0 |
| 2012 | 0.992 | 113.892 | 21.334 | 0 | 0 | 0 |
| 2013 | 0.886 | 39.293 | 63.843 | 0 | 0 | 0 |
| 2014 | 0.956 | 26.695 | 54.908 | 0 | 0 | 0 |
| 2015 | 1.018 | 13.803 | 63.501 | 0 | 0.073 | 0 |
Get the data: StatBank
Monetary Financial Institutions (S.122 + S.123)
The Monetary Financial Institutions sector is made up of deposit-taking corporations such as retail banks, building societies and credit unions (S.122) and Money Market Funds (S.123) but excludes the Central Bank (S.121). The balance sheet of the Monetary Financial Institutions sector contracted during the period 2009-2013, where its assets fell by €742bn and its liabilities by €753bn, as shown in Figures 4 and 5. During 2015 this trend was reversed as financial assets grew by 9.1% and liabilities by 3.1% over their 2013 values. This growth was driven by increased Debt Securities (AF.3) on the assets side and increased investment through Equity (AF.5) on the liabilities side.
The assets and liabilities, which peaked in 2008 at €1,743bn and €1,754bn, have declined to €1,092bn and €1,032bn respectively in 2015 – a reduction of approximately 40% in this period. Part of the decreasing trend over recent years is due to the reclassification of Money Market Funds (S.123). This led to some assets being redefined as Investment Funds (S.124).
| Currency and Deposits (AF.2) | Debt Securities (AF.3) | Loans (AF.4) | Equity and Investment Fund Shares/Units (AF.5) | Financial Derivatives and Employee Stock Options (AF.7) | Other Accounts Receivable (AF.8) | |
| 2006 | 390.038 | 574.203 | 410.915 | 18.712 | 49.314 | 10.94 |
| 2007 | 420.135 | 636.643 | 488.045 | 16.997 | 82.5 | 13.919 |
| 2008 | 479.247 | 676.083 | 499.426 | 19.354 | 57.721 | 11.618 |
| 2009 | 450.044 | 656.212 | 452.45 | 18.525 | 34.72 | 19.197 |
| 2010 | 440.678 | 578.599 | 421.596 | 20.337 | 31.262 | 7.45 |
| 2011 | 376.536 | 457.955 | 334.417 | 19.024 | 36.654 | 16.643 |
| 2012 | 294.517 | 464.668 | 297.711 | 17.452 | 28.278 | 13.165 |
| 2013 | 257.885 | 420.951 | 269.621 | 18.739 | 20.752 | 13.02 |
| 2014 | 276.743 | 494.546 | 237.432 | 16.096 | 27.376 | 9.517 |
| 2015 | 276.111 | 528.999 | 221.355 | 26.896 | 26.539 | 12.05 |
Get the data: StatBank
| Currency and Deposits (AF.2) | Debt Securities (AF.3) | Equity and Investment Fund Shares/Units (AF.5) | Financial Derivatives and Employee Stock Options (AF.7) | Other Accounts Receivable (AF.8) | |
| 2006 | 815.791 | 246.801 | 369.748 | 54.777 | 17.74 |
| 2007 | 916.16 | 257.985 | 412.874 | 90.97 | 16.857 |
| 2008 | 1097.71 | 188.843 | 381.897 | 60.593 | 24.635 |
| 2009 | 997.98 | 184.945 | 393.563 | 40.839 | 18.988 |
| 2010 | 881.857 | 130.675 | 446.515 | 35.478 | 14.474 |
| 2011 | 685.416 | 101.648 | 390.47 | 42.296 | 23.119 |
| 2012 | 551.794 | 83.284 | 405.847 | 33.834 | 19.17 |
| 2013 | 494.134 | 63.057 | 398.957 | 24.923 | 19.997 |
| 2014 | 454.067 | 63.058 | 516.238 | 30.456 | 13.024 |
| 2015 | 416.483 | 51.435 | 521.573 | 29.583 | 13.005 |
Get the data: StatBank
Investment Funds (S.124)
The Investment Funds sector (S.124) consists of all collective investment schemes except those classified in the Money Market subsector. The balance sheet of the Investment Funds sector continued to grow during 2015 (Figure 6). Figure 2 shows the change in contribution by S.124 to the overall size of the financial sector balance sheet. During 2015 this contribution increased in absolute terms while continuing to comprise approximately 39% of the total assets. Apart from a drop in balance sheet size during 2008, relating to the financial crisis, the sector has exhibited continuous growth in the intervening period, where its financial assets have grown cumulatively by €1,436bn.
During the period 2008-2015, the Investment Funds sector, excluding Money Market Funds, has increased more than five-fold in size in Ireland. The increase in assets is mainly driven by Debt Securities (AF.3) and Equity and Investment Funds (AF.5), while the liabilities are mainly composed of equity. Part of this increase is due to the reclassification of Money Market Funds (S.123) to Investment Funds (S.124) as discussed above.
| Note: The reporting basis of derivatives has changed, making it difficult to differentiate the natural growth in the sector from the change due to data collection methods. In 2014, there was a large increase in Financial Derivatives and Employee Stock Options (AF.7). This movement can partly be attributed to a reclassification relating to the manner in which Investment Funds moved from reporting derivative positions on a gross rather than on a net basis. This technical note provides more detail on Investment Funds data collection. |
| Currency and Deposits (AF.2) | Debt Securities (AF.3) | Loans (AF.4) | Equity and Investment Fund Shares/Units (AF.5) | Financial Derivatives and Employee Stock Options (AF.7) | Other Accounts Receivable (AF.8) | |
| 2006 | 14.499 | 131.96 | 1.052 | 289.527 | 5.497 | 5.087 |
| 2007 | 10.482 | 148.155 | 0.335 | 303.656 | 10.061 | 1.288 |
| 2008 | 16.629 | 97.775 | 0.435 | 208.446 | 12.999 | 5.723 |
| 2009 | 20.112 | 150.08 | 0.377 | 261.261 | 11.87 | 16.353 |
| 2010 | 25.053 | 235.077 | 0.314 | 342.342 | 19.011 | 23.706 |
| 2011 | 44.891 | 357.381 | 16.278 | 346.224 | 19.198 | 34.675 |
| 2012 | 64.095 | 441.035 | 16.898 | 421.448 | 32.26 | 42.235 |
| 2013 | 56.753 | 480.794 | 14.688 | 532.571 | 43.428 | 52.098 |
| 2014 | 58.461 | 559.49 | 15.115 | 689.544 | 228.444 | 76.445 |
| 2015 | 77.116 | 615.196 | 31.342 | 784.846 | 168.378 | 100.66 |
Get the data: StatBank
Other Financial Corporations (S.125 + S.126 + S.127)
This sector is composed of Other Financial Intermediaries (S.125), Financial Auxiliaries (S.126) and Captive Financial Institutions and Money Lenders (S.127). Other Financial Intermediaries (S.125) include companies engaged in financial leasing and consumer and other lending, securitisation vehicles, derivative and security dealers, treasury companies and a range of other companies engaged in financial intermediation. The Financial Auxiliaries sector (S.126) covers companies which provide auxiliary financial services and other financial advisory and consultancy services such as loan brokers and investment advisors. They are companies which are principally engaged in activities closely related to financial intermediation but which are not financial intermediaries themselves. The balance sheet of S.126 is considerably smaller than the sectors S.125 and S.127. The Captive Financial Institutions sector (S.127) consists of financial corporations which are neither engaged in financial intermediation nor in providing financial auxiliary services. These include trusts, special purpose entities, money lenders, treasuries, certain types of sovereign wealth funds, and holding companies that simply own the assets of subsidiaries.
| Currency and Deposits (AF.2) | Debt Securities (AF.3) | Loans (AF.4) | Equity and Investment Fund Shares/Units (AF.5) | Financial Derivatives and Employee Stock Options (AF.7) | Other Accounts Receivable (AF.8) | |
| 2006 | 18.546 | 48.519 | 510.749 | 103.365 | 5.841 | 15.649 |
| 2007 | 26.327 | 75.751 | 496.322 | 106.582 | 0.963 | 22.151 |
| 2008 | 23.848 | 185.559 | 562.644 | 80.826 | 10.41 | 19.773 |
| 2009 | 32.151 | 197.573 | 580.115 | 123.256 | 1.732 | 17.352 |
| 2010 | 36.411 | 221.995 | 610.164 | 154.155 | -0.406 | 14.63 |
| 2011 | 32.013 | 232.866 | 661.11 | 168.464 | 1.098 | 15.003 |
| 2012 | 20.215 | 215.221 | 638.725 | 115.986 | -0.025 | 11.861 |
| 2013 | 17.768 | 165.972 | 550.74 | 120.026 | 3.065 | 41.984 |
| 2014 | 26.257 | 174.516 | 717.213 | 116.486 | -1.469 | 49.582 |
| 2015 | 45.219 | 198.856 | 779.013 | 194.274 | 6.164 | 50.266 |
Get the data: StatBank
The Other Financial Corporations sector saw an increasing trend in balance sheet growth over the period 2006-2011 (Figures 7 and 8). In 2012 and 2013 the sector underwent a contraction in its balance sheet mainly due to a reduction in Debt Securities (AF.3). This trend was reversed in 2014 and 2015 with an increase in AF.3 assets. While the liabilities are largely made up of Debt Securities (AF.3) and Loans (AF.4), the assets are dominated by Loans (AF.4), in the most part held by treasury companies. These are often set up in Ireland to fund the financial activities of related multinationals in Ireland and Europe.
| Debt Securities (AF.3) | Loans (AF.4) | Equity and Investment Fund Shares/Units (AF.5) | Financial Derivatives and Employee Stock Options (AF.7) | Other Accounts Receivable (AF.8) | |
| 2006 | 269.934 | 238.696 | 95.542 | 2.586 | 16.992 |
| 2007 | 304.845 | 257.192 | 83.497 | 2.367 | 10.898 |
| 2008 | 477.889 | 314.727 | 85.489 | -2.167 | 17.004 |
| 2009 | 494.351 | 363.814 | 96.877 | 3.874 | 18.184 |
| 2010 | 527.407 | 374.002 | 106.068 | 4.111 | 19.494 |
| 2011 | 537.497 | 402.186 | 118.981 | 2.753 | 21.32 |
| 2012 | 522.676 | 358.613 | 83.449 | 11.011 | 13.889 |
| 2013 | 331.019 | 359.4 | 75.974 | 1.953 | 85.084 |
| 2014 | 433.407 | 394.907 | 175.291 | 1.269 | 95.391 |
| 2015 | 523.589 | 510.131 | 229.954 | -0.07 | 96.343 |
Get the data: StatBank
Insurance Corporations and Pension Funds (S.128 + S.129)
The Insurance Corporations (S.128) and Pension Funds (S.129) sector has seen an overall upward movement in balance sheet growth over the period 2006-2015 (Figure 9). The increase in 2015 on the assets side was driven by Equity and Investment Fund Shares (AF.5). Most of the liabilities are to households which are categorised as Insurance, Pension and Standardised Guarantee Schemes (AF.6). AF.6 includes non-life insurance technical reserves, life insurance and annuity entitlements, and pension entitlements.
| Currency and Deposits (AF.2) | Debt Securities (AF.3) | Loans (AF.4) | Equity and Investment Fund Shares/Units (AF.5) | Insurance, Pension and Standardised Guarantee Schemes (AF.6) | Financial Derivatives and Employee Stock Options (AF.7) | Other Accounts Receivable (AF.8) | |
| 2006 | 16.732 | 52.411 | 4.319 | 136.193 | 27.802 | 0.9 | 12.165 |
| 2007 | 17.889 | 58.532 | 3.392 | 131.578 | 35.221 | 0.771 | 12.938 |
| 2008 | 22.349 | 64.053 | 3.412 | 99.182 | 38.056 | 1.789 | 14.439 |
| 2009 | 22.261 | 69.182 | 4.134 | 120.482 | 41.9 | 1.593 | 12.75 |
| 2010 | 22.928 | 73.745 | 4.348 | 136.193 | 44.055 | 1.65 | 15.924 |
| 2011 | 23.588 | 80.233 | 4.597 | 126.991 | 29.978 | 2.433 | 16.294 |
| 2012 | 25.444 | 83.276 | 2.785 | 138.203 | 28.352 | 2.461 | 16.196 |
| 2013 | 24.061 | 79.53 | 1.29 | 156.929 | 26.698 | 1.768 | 16.232 |
| 2014 | 24.091 | 88.796 | 1.515 | 182.32 | 31.991 | 2.443 | 18.232 |
| 2015 | 27.159 | 92.423 | 1.349 | 196.763 | 33.734 | 1.786 | 22.532 |
Get the data: StatBank
The AF.6 classification on the asset side of the balance sheet also covers reinsurance data for Ireland. Here an insurer may protect against an unexpectedly large number of claims, or exceptionally heavy claims, by taking out a reinsurance policy with a reinsurer. Reinsurance corporations are concentrated in a limited number of financial centres, and so many of the reinsurance flows are transactions with the rest of the world.
EU Comparison
The 2015 balance sheet assets for S.12, as a percentage of GDP, are shown for selected EU countries in Figure 10. The graph shows the importance of Ireland’s financial sector to the Irish economy. Taking financial sector assets as a percentage of GDP, Ireland ranks as the third highest country in Europe, with Luxembourg and Malta being first and second highest respectively. The value of financial assets, as a percentage of GDP, for Luxembourg is 26,597. It is excluded from Figure 10 to allow a better comparable view of other selected EU countries.
| Selected European Countries | |
| Malta | 2744 |
| Ireland | 1797.2 |
| Cyprus | 1692.3 |
| Netherlands | 1452.7 |
| United Kingdom | 1086.9 |
| Denmark | 797.6 |
| France | 614 |
| Belgium | 577.4 |
| Sweden | 566.3 |
| Germany | 457.6 |
| Portugal | 457.5 |
| Spain | 402.8 |
| Finland | 402.8 |
| Italy | 389.6 |
| Greece | 335 |
Get the data: Eurostat database
We may also look at the absolute size of the Irish Financial Sector relative to other EU countries, this is shown in Figure 11. Here Ireland is mid-table, with a financial sector that is smaller than countries such as the United Kingdom, Germany and France but substantially larger than Belgium, Denmark or Finland.
| Selected European Countries | |
| United Kingdom | 27.7023721 |
| Germany | 13.877732 |
| Luxembourg | 13.8602721 |
| France | 13.392397 |
| Netherlands | 9.828027 |
| Italy | 6.398443 |
| Ireland | 4.597421 |
| Spain | 4.332784 |
| Sweden | 2.5763497 |
| Belgium | 2.3638706 |
| Denmark | 2.1224331 |
| Finland | 0.842452 |
| Portugal | 0.8214604 |
| Greece | 0.5886049 |
| Cyprus | 0.2984691 |
| Malta | 0.2411536 |
Get the data: Eurostat database
| Table 1a Financial Balance Sheet, end-years 2011-2015, non-consolidated | € million | |||||
| Institutional sector (ESA2010) | ||||||
| S.12 Financial Corporations | ||||||
| Total | S.121 | S.122 + S.123 | S.124 | S.125 + S.126 + S.127 | S.128 + S.129 | |
| Financial Assets | Central bank | Other monetary financial institutions | Non-money market investment funds | Other financial intermediaries, financial auxiliaries, captive financial institutions & money lenders | Insurance corporations & pension funds | |
| AF.1 Monetary Gold and Special Drawing Rights (SDRs) | ||||||
| 2011 | 989 | 989 | 0 | 0 | 0 | 0 |
| 2012 | 992 | 992 | 0 | 0 | 0 | 0 |
| 2013 | 886 | 886 | 0 | 0 | 0 | 0 |
| 2014 | 956 | 956 | 0 | 0 | 0 | 0 |
| 2015 | 1,018 | 1,018 | 0 | 0 | 0 | 0 |
| AF.11 Monetary Gold | ||||||
| 2011 | 235 | 235 | 0 | 0 | 0 | 0 |
| 2012 | 244 | 244 | 0 | 0 | 0 | 0 |
| 2013 | 159 | 159 | 0 | 0 | 0 | 0 |
| 2014 | 180 | 180 | 0 | 0 | 0 | 0 |
| 2015 | 189 | 189 | 0 | 0 | 0 | 0 |
| AF.12 SDRs | ||||||
| 2011 | 754 | 754 | 0 | 0 | 0 | 0 |
| 2012 | 748 | 748 | 0 | 0 | 0 | 0 |
| 2013 | 727 | 727 | 0 | 0 | 0 | 0 |
| 2014 | 776 | 776 | 0 | 0 | 0 | 0 |
| 2015 | 829 | 829 | 0 | 0 | 0 | 0 |
| AF.2 Currency and Deposits | ||||||
| 2011 | 629,529 | 152,501 | 376,536 | 44,891 | 32,013 | 23,588 |
| 2012 | 518,162 | 113,892 | 294,517 | 64,095 | 20,215 | 25,444 |
| 2013 | 395,760 | 39,293 | 257,885 | 56,753 | 17,768 | 24,061 |
| 2014 | 412,247 | 26,695 | 276,743 | 58,461 | 26,257 | 24,091 |
| 2015 | 439,408 | 13,803 | 276,111 | 77,116 | 45,219 | 27,159 |
| AF.21 Currency | ||||||
| 2011 | 1,948 | 1 | 1,947 | 0 | 0 | 0 |
| 2012 | 1,115 | 0 | 1,115 | 0 | 0 | 0 |
| 2013 | 1,219 | 1 | 1,218 | 0 | 0 | 0 |
| 2014 | 1,174 | 0 | 1,174 | 0 | 0 | 0 |
| 2015 | 1,338 | 0 | 1,338 | 0 | 0 | 0 |
| AF.22 Transferable Deposits | ||||||
| 2011 | 102,181 | 1,233 | 75,596 | 0 | 21,537 | 3,815 |
| 2012 | 81,353 | 496 | 63,027 | 0 | 12,926 | 4,904 |
| 2013 | 73,507 | 0 | 54,238 | 0 | 14,632 | 4,637 |
| 2014 | 106,433 | 0 | 83,515 | 0 | 18,421 | 4,496 |
| 2015 | 112,790 | 2,818 | 84,581 | 0 | 16,065 | 9,326 |
| AF.29 Other Deposits | ||||||
| 2011 | 525,400 | 151,267 | 298,993 | 44,891 | 10,476 | 19,772 |
| 2012 | 435,694 | 113,396 | 230,375 | 64,095 | 7,289 | 20,540 |
| 2013 | 321,034 | 39,292 | 202,429 | 56,753 | 3,137 | 19,424 |
| 2014 | 304,640 | 26,695 | 192,054 | 58,461 | 7,836 | 19,595 |
| 2015 | 325,280 | 10,985 | 190,192 | 77,115 | 29,154 | 17,834 |
| AF.3 Debt Securities | ||||||
| 2011 | 1,147,921 | 19,486 | 457,955 | 357,381 | 232,866 | 80,233 |
| 2012 | 1,225,535 | 21,334 | 464,668 | 441,035 | 215,221 | 83,276 |
| 2013 | 1,211,090 | 63,843 | 420,951 | 480,794 | 165,972 | 79,530 |
| 2014 | 1,372,255 | 54,908 | 494,546 | 559,490 | 174,516 | 88,796 |
| 2015 | 1,498,975 | 63,501 | 528,999 | 615,196 | 198,856 | 92,423 |
| AF.31 Short-term Debt Securities | ||||||
| 2011 | 323,448 | 8,628 | 181,967 | 78,612 | 46,256 | 7,985 |
| 2012 | 335,434 | 7,857 | 201,372 | 82,285 | 35,047 | 8,873 |
| 2013 | 343,009 | 19,862 | 173,906 | 96,621 | 44,205 | 8,415 |
| 2014 | 415,998 | 7,503 | 283,843 | 66,439 | 49,921 | 8,292 |
| 2015 | 457,286 | 4,004 | 336,262 | 43,513 | 63,788 | 9,719 |
| AF.32 Long-term Debt Securities | ||||||
| 2011 | 824,474 | 10,858 | 275,988 | 278,769 | 186,610 | 72,248 |
| 2012 | 890,101 | 13,477 | 263,296 | 358,750 | 180,175 | 74,403 |
| 2013 | 868,081 | 43,981 | 247,045 | 384,173 | 121,767 | 71,115 |
| 2014 | 956,257 | 47,405 | 210,703 | 493,051 | 124,595 | 80,504 |
| 2015 | 1,041,690 | 59,497 | 192,737 | 571,683 | 135,069 | 82,705 |
| AF.4 Loans | ||||||
| 2011 | 1,012,997 | 0 | 334,417 | 16,278 | 661,110 | 4,597 |
| 2012 | 956,119 | 0 | 297,711 | 16,898 | 638,725 | 2,785 |
| 2013 | 836,339 | 0 | 269,621 | 14,688 | 550,740 | 1,290 |
| 2014 | 971,275 | 0 | 237,432 | 15,115 | 717,213 | 1,515 |
| 2015 | 1,033,059 | 0 | 221,355 | 31,342 | 779,013 | 1,349 |
| AF.41 Short-term Loans | ||||||
| 2011 | 204,929 | 0 | 62,290 | 16,240 | 128,428 | 1,316 |
| 2012 | 235,506 | 0 | 60,782 | 6,792 | 166,793 | 1,138 |
| 2013 | 200,780 | 0 | 70,777 | 5,945 | 123,085 | 973 |
| 2014 | 201,396 | 0 | 64,307 | 9,700 | 126,318 | 1,072 |
| 2015 | 216,043 | 0 | 51,065 | 0 | 163,989 | 989 |
| AF.42 Long-term Loans | ||||||
| 2011 | 808,068 | 0 | 272,127 | 38 | 532,682 | 3,281 |
| 2012 | 720,613 | 0 | 236,929 | 10,105 | 471,932 | 1,647 |
| 2013 | 635,558 | 0 | 198,844 | 8,742 | 427,655 | 317 |
| 2014 | 769,879 | 0 | 173,125 | 5,415 | 590,895 | 444 |
| 2015 | 817,016 | 0 | 170,290 | 31,342 | 615,024 | 360 |
| AF.5 Equity and Investment Fund Shares/Units | ||||||
| 2011 | 660,704 | 0 | 19,024 | 346,224 | 168,464 | 126,991 |
| 2012 | 693,089 | 0 | 17,452 | 421,448 | 115,986 | 138,203 |
| 2013 | 828,265 | 0 | 18,739 | 532,571 | 120,026 | 156,929 |
| 2014 | 1,004,446 | 0 | 16,096 | 689,544 | 116,486 | 182,320 |
| 2015 | 1,202,851 | 73 | 26,896 | 784,846 | 194,274 | 196,763 |
| AF.51 Equity | ||||||
| 2011 | 518,303 | 0 | 18,135 | 269,762 | 168,464 | 61,941 |
| 2012 | 531,556 | 0 | 17,022 | 330,951 | 115,986 | 67,597 |
| 2013 | 624,088 | 0 | 18,301 | 410,792 | 120,026 | 74,969 |
| 2014 | 719,101 | 0 | 16,096 | 503,656 | 116,486 | 82,862 |
| 2015 | 862,522 | 73 | 26,312 | 576,526 | 177,510 | 82,102 |
| AF.511 Listed Shares | ||||||
| 2011 | 335,495 | 0 | 5,632 | 269,762 | 245 | 59,856 |
| 2012 | 392,540 | 0 | 562 | 327,136 | 49 | 64,793 |
| 2013 | 480,287 | 0 | 570 | 408,880 | 47 | 70,790 |
| 2014 | 582,754 | 0 | 597 | 503,628 | 207 | 78,321 |
| 2015 | 668,590 | 0 | 10,660 | 575,852 | 4,890 | 77,188 |
| AF.512 Unlisted Shares | ||||||
| 2011 | 180,739 | 0 | 12,503 | 0 | 168,219 | 17 |
| 2012 | 134,701 | 0 | 14,163 | 3,748 | 115,937 | 852 |
| 2013 | 141,083 | 0 | 17,731 | 857 | 119,979 | 2,516 |
| 2014 | 134,824 | 0 | 15,499 | 28 | 116,279 | 3,018 |
| 2015 | 192,600 | 73 | 15,651 | 675 | 172,620 | 3,581 |
| AF.519 Other Equity | ||||||
| 2011 | 2,068 | 0 | 0 | 0 | 0 | 2,068 |
| 2012 | 4,316 | 0 | 2,297 | 67 | 0 | 1,952 |
| 2013 | 2,719 | 0 | 0 | 1,055 | 0 | 1,664 |
| 2014 | 1,523 | 0 | 0 | 0 | 0 | 1,523 |
| 2015 | 1,333 | 0 | 0 | 0 | 0 | 1,333 |
| AF.52 Investment Fund Shares/Units | ||||||
| 2011 | 142,401 | 0 | 889 | 76,462 | 0 | 65,050 |
| 2012 | 161,533 | 0 | 430 | 90,497 | 0 | 70,606 |
| 2013 | 204,176 | 0 | 438 | 121,779 | 0 | 81,959 |
| 2014 | 285,345 | 0 | 0 | 185,888 | 0 | 99,457 |
| 2015 | 340,329 | 0 | 584 | 208,319 | 16,764 | 114,661 |
| AF.6 Insurance, Pension and Standardised Guarantee Schemes | ||||||
| 2011 | 29,978 | 0 | 0 | 0 | 0 | 29,978 |
| 2012 | 28,352 | 0 | 0 | 0 | 0 | 28,352 |
| 2013 | 26,698 | 0 | 0 | 0 | 0 | 26,698 |
| 2014 | 31,991 | 0 | 0 | 0 | 0 | 31,991 |
| 2015 | 33,734 | 0 | 0 | 0 | 0 | 33,734 |
| AF.61 Non-life Insurance Technical Reserves | ||||||
| 2011 | 29,978 | 0 | 0 | 0 | 0 | 29,978 |
| 2012 | 28,352 | 0 | 0 | 0 | 0 | 28,352 |
| 2013 | 26,698 | 0 | 0 | 0 | 0 | 26,698 |
| 2014 | 31,991 | 0 | 0 | 0 | 0 | 31,991 |
| 2015 | 33,734 | 0 | 0 | 0 | 0 | 33,734 |
| AF.62 Life Insurance and Annuity Entitlements | ||||||
| 2011 | 0 | 0 | 0 | 0 | 0 | 0 |
| 2012 | 0 | 0 | 0 | 0 | 0 | 0 |
| 2013 | 0 | 0 | 0 | 0 | 0 | 0 |
| 2014 | 0 | 0 | 0 | 0 | 0 | 0 |
| 2015 | 0 | 0 | 0 | 0 | 0 | 0 |
| AF.63+AF.64+AF.65 Pension Entitlements, Claims of Pension Funds on Pension Managers, Entitlements to Non-Pension Benefits | ||||||
| 2011 | 0 | 0 | 0 | 0 | 0 | 0 |
| 2012 | 0 | 0 | 0 | 0 | 0 | 0 |
| 2013 | 0 | 0 | 0 | 0 | 0 | 0 |
| 2014 | 0 | 0 | 0 | 0 | 0 | 0 |
| 2015 | 0 | 0 | 0 | 0 | 0 | 0 |
| AF.66 Provision for Calls under Standardised Guarantees | ||||||
| 2011 | 0 | 0 | 0 | 0 | 0 | 0 |
| 2012 | 0 | 0 | 0 | 0 | 0 | 0 |
| 2013 | 0 | 0 | 0 | 0 | 0 | 0 |
| 2014 | 0 | 0 | 0 | 0 | 0 | 0 |
| 2015 | 0 | 0 | 0 | 0 | 0 | 0 |
| AF.7 Financial Derivatives and Employee Stock Options | ||||||
| 2011 | 59,383 | 0 | 36,654 | 19,198 | 1,098 | 2,433 |
| 2012 | 62,973 | 0 | 28,278 | 32,260 | -25 | 2,461 |
| 2013 | 69,013 | 0 | 20,752 | 43,428 | 3,065 | 1,768 |
| 2014 | 256,794 | 0 | 27,376 | 228,444 | -1,469 | 2,443 |
| 2015 | 202,867 | 0 | 26,539 | 168,378 | 6,164 | 1,786 |
| AF.71 Financial Derivatives | ||||||
| 2011 | 59,383 | 0 | 36,654 | 19,198 | 1,098 | 2,433 |
| 2012 | 62,973 | 0 | 28,278 | 32,260 | -25 | 2,461 |
| 2013 | 69,013 | 0 | 20,752 | 43,428 | 3,065 | 1,768 |
| 2014 | 256,794 | 0 | 27,376 | 228,444 | -1,469 | 2,443 |
| 2015 | 202,867 | 0 | 26,539 | 168,378 | 6,164 | 1,786 |
| AF.72 Employee Stock Options | ||||||
| 2011 | 0 | 0 | 0 | 0 | 0 | 0 |
| 2012 | 0 | 0 | 0 | 0 | 0 | 0 |
| 2013 | 0 | 0 | 0 | 0 | 0 | 0 |
| 2014 | 0 | 0 | 0 | 0 | 0 | 0 |
| 2015 | 0 | 0 | 0 | 0 | 0 | 0 |
| AF.8 Other Accounts Receivable | ||||||
| 2011 | 82,616 | 0 | 16,643 | 34,675 | 15,003 | 16,294 |
| 2012 | 83,456 | 0 | 13,165 | 42,235 | 11,861 | 16,196 |
| 2013 | 123,334 | 0 | 13,020 | 52,098 | 41,984 | 16,232 |
| 2014 | 153,776 | 0 | 9,517 | 76,445 | 49,582 | 18,232 |
| 2015 | 185,508 | 0 | 12,050 | 100,660 | 50,266 | 22,532 |
| AF.81 Trade Credits and Advances | ||||||
| 2011 | 19,345 | 0 | 132 | 0 | 11,119 | 8,094 |
| 2012 | 14,358 | 0 | 73 | 0 | 5,448 | 8,837 |
| 2013 | 16,446 | 0 | 305 | 0 | 7,472 | 8,669 |
| 2014 | 18,508 | 0 | 73 | 0 | 8,358 | 10,077 |
| 2015 | 19,597 | 0 | 0 | 0 | 7,996 | 11,601 |
| AF.89 Other Accounts Receivable/Payable excluding Trade Credits and Advances | ||||||
| 2011 | 63,271 | 0 | 16,511 | 34,675 | 3,885 | 8,200 |
| 2012 | 69,098 | 0 | 13,092 | 42,235 | 6,413 | 7,359 |
| 2013 | 106,888 | 0 | 12,715 | 52,098 | 34,511 | 7,563 |
| 2014 | 135,267 | 0 | 9,444 | 76,445 | 41,224 | 8,155 |
| 2015 | 165,911 | 0 | 12,050 | 100,660 | 42,270 | 10,931 |
| AF.A Total Financial Assets | ||||||
| 2011 | 3,624,118 | 172,976 | 1,241,229 | 818,648 | 1,110,556 | 284,114 |
| 2012 | 3,568,679 | 136,218 | 1,115,791 | 1,017,970 | 1,001,983 | 296,717 |
| 2013 | 3,491,384 | 104,022 | 1,000,968 | 1,180,332 | 899,554 | 306,509 |
| 2014 | 4,203,739 | 82,559 | 1,061,709 | 1,627,499 | 1,082,585 | 349,388 |
| 2015 | 4,597,421 | 78,395 | 1,091,950 | 1,777,538 | 1,273,792 | 375,746 |
| Table 1b Financial Balance Sheet, end-years 2011-2015, non-consolidated | € million | |||||
| Institutional sector (ESA2010) | ||||||
| S.12 Financial Corporations | ||||||
| Total | S.121 | S.122 + S.123 | S.124 | S.125 + S.126 + S.127 | S.128 + S.129 | |
| Liabilities | Central bank | Other monetary financial institutions | Non-money market investment funds | Other financial intermediaries, financial auxiliaries, captive financial institutions & money lenders | Insurance corporations & pension funds | |
| AF.1 Monetary Gold and Special Drawing Rights (SDRs) | ||||||
| 2011 | 0 | 0 | 0 | 0 | 0 | 0 |
| 2012 | 0 | 0 | 0 | 0 | 0 | 0 |
| 2013 | 0 | 0 | 0 | 0 | 0 | 0 |
| 2014 | 0 | 0 | 0 | 0 | 0 | 0 |
| 2015 | 0 | 0 | 0 | 0 | 0 | 0 |
| AF.11 Monetary Gold | ||||||
| 2011 | 0 | 0 | 0 | 0 | 0 | 0 |
| 2012 | 0 | 0 | 0 | 0 | 0 | 0 |
| 2013 | 0 | 0 | 0 | 0 | 0 | 0 |
| 2014 | 0 | 0 | 0 | 0 | 0 | 0 |
| 2015 | 0 | 0 | 0 | 0 | 0 | 0 |
| AF.12 SDRs | ||||||
| 2011 | 0 | 0 | 0 | 0 | 0 | 0 |
| 2012 | 0 | 0 | 0 | 0 | 0 | 0 |
| 2013 | 0 | 0 | 0 | 0 | 0 | 0 |
| 2014 | 0 | 0 | 0 | 0 | 0 | 0 |
| 2015 | 0 | 0 | 0 | 0 | 0 | 0 |
| AF.2 Currency and Deposits | ||||||
| 2011 | 857,531 | 172,115 | 685,416 | 0 | 0 | 0 |
| 2012 | 686,258 | 134,464 | 551,794 | 0 | 0 | 0 |
| 2013 | 594,330 | 100,196 | 494,134 | 0 | 0 | 0 |
| 2014 | 522,073 | 68,006 | 454,067 | 0 | 0 | 0 |
| 2015 | 479,583 | 63,101 | 416,483 | 0 | 0 | 0 |
| AF.21 Currency | ||||||
| 2011 | 12,978 | 12,978 | 0 | 0 | 0 | 0 |
| 2012 | 11,089 | 11,089 | 0 | 0 | 0 | 0 |
| 2013 | 11,185 | 11,185 | 0 | 0 | 0 | 0 |
| 2014 | 13,331 | 13,331 | 0 | 0 | 0 | 0 |
| 2015 | 16,685 | 16,685 | 0 | 0 | 0 | 0 |
| AF.22 Transferable Deposits | ||||||
| 2011 | 122,754 | 0 | 122,754 | 0 | 0 | 0 |
| 2012 | 119,148 | 0 | 119,148 | 0 | 0 | 0 |
| 2013 | 133,987 | 0 | 133,987 | 0 | 0 | 0 |
| 2014 | 100,784 | 0 | 100,784 | 0 | 0 | 0 |
| 2015 | 105,171 | 0 | 105,172 | 0 | 0 | 0 |
| AF.29 Other Deposits | ||||||
| 2011 | 721,799 | 159,137 | 562,662 | 0 | 0 | 0 |
| 2012 | 556,021 | 123,375 | 432,646 | 0 | 0 | 0 |
| 2013 | 449,158 | 89,011 | 360,147 | 0 | 0 | 0 |
| 2014 | 407,958 | 54,675 | 353,283 | 0 | 0 | 0 |
| 2015 | 357,727 | 46,416 | 311,311 | 0 | 0 | 0 |
| AF.3 Debt Securities | ||||||
| 2011 | 639,145 | 0 | 101,648 | 0 | 537,497 | 0 |
| 2012 | 605,960 | 0 | 83,284 | 0 | 522,676 | 0 |
| 2013 | 394,076 | 0 | 63,057 | 0 | 331,019 | 0 |
| 2014 | 496,465 | 0 | 63,058 | 0 | 433,407 | 0 |
| 2015 | 575,024 | 0 | 51,435 | 0 | 523,589 | 0 |
| AF.31 Short-term Debt Securities | ||||||
| 2011 | 22,805 | 0 | 14,488 | 0 | 8,317 | 0 |
| 2012 | 39,325 | 0 | 15,395 | 0 | 23,930 | 0 |
| 2013 | 30,896 | 0 | 10,703 | 0 | 20,193 | 0 |
| 2014 | 29,029 | 0 | 12,004 | 0 | 17,025 | 0 |
| 2015 | 40,286 | 0 | 14,049 | 0 | 26,237 | 0 |
| AF.32 Long-term Debt Securities | ||||||
| 2011 | 616,340 | 0 | 87,160 | 0 | 529,180 | 0 |
| 2012 | 566,635 | 0 | 67,889 | 0 | 498,746 | 0 |
| 2013 | 363,181 | 0 | 52,354 | 0 | 310,827 | 0 |
| 2014 | 467,436 | 0 | 51,054 | 0 | 416,382 | 0 |
| 2015 | 534,738 | 0 | 37,386 | 0 | 497,352 | 0 |
| AF.4 Loans | ||||||
| 2011 | 405,917 | 0 | 0 | 6,475 | 402,186 | 3,855 |
| 2012 | 385,233 | 0 | 0 | 22,463 | 358,613 | 4,156 |
| 2013 | 399,938 | 0 | 0 | 37,032 | 359,400 | 3,506 |
| 2014 | 416,283 | 0 | 0 | 17,556 | 394,907 | 3,820 |
| 2015 | 551,776 | 0 | 0 | 37,558 | 510,131 | 4,086 |
| AF.41 Short-term Loans | ||||||
| 2011 | 241,703 | 0 | 0 | 5,982 | 235,034 | 686 |
| 2012 | 243,996 | 0 | 0 | 20,049 | 223,172 | 775 |
| 2013 | 248,207 | 0 | 0 | 33,050 | 214,711 | 446 |
| 2014 | 244,471 | 0 | 0 | 12,447 | 231,506 | 518 |
| 2015 | 322,652 | 0 | 0 | 28,277 | 293,890 | 485 |
| AF.42 Long-term Loans | ||||||
| 2011 | 164,215 | 0 | 0 | 493 | 167,152 | 3,169 |
| 2012 | 141,237 | 0 | 0 | 2,414 | 135,441 | 3,381 |
| 2013 | 151,731 | 0 | 0 | 3,982 | 144,689 | 3,059 |
| 2014 | 171,813 | 0 | 0 | 5,110 | 163,402 | 3,301 |
| 2015 | 229,124 | 0 | 0 | 9,281 | 216,241 | 3,601 |
| AF.5 Equity and Investment Fund Shares/Units | ||||||
| 2011 | 1,308,360 | 3,154 | 390,470 | 768,667 | 118,981 | 27,088 |
| 2012 | 1,451,709 | 2,268 | 405,847 | 931,751 | 83,449 | 28,393 |
| 2013 | 1,574,120 | 3,699 | 398,957 | 1,069,719 | 75,974 | 25,771 |
| 2014 | 2,007,479 | 12,721 | 516,238 | 1,275,172 | 175,291 | 28,057 |
| 2015 | 2,229,200 | 14,583 | 521,573 | 1,432,189 | 229,954 | 30,901 |
| AF.51 Equity | ||||||
| 2011 | 254,380 | 3,154 | 105,157 | 0 | 118,981 | 27,088 |
| 2012 | 223,986 | 2,268 | 109,876 | 0 | 83,449 | 28,393 |
| 2013 | 230,424 | 3,699 | 124,980 | 0 | 75,974 | 25,771 |
| 2014 | 329,270 | 12,721 | 113,201 | 0 | 175,291 | 28,057 |
| 2015 | 330,443 | 14,583 | 55,005 | 0 | 229,954 | 30,901 |
| AF.511 Listed Shares | ||||||
| 2011 | 8,195 | 0 | 8,195 | 0 | 0 | 0 |
| 2012 | 8,726 | 0 | 8,726 | 0 | 0 | 0 |
| 2013 | 14,261 | 0 | 14,261 | 0 | 0 | 0 |
| 2014 | 24,820 | 0 | 24,820 | 0 | 0 | 0 |
| 2015 | 32,059 | 0 | 32,059 | 0 | 0 | 0 |
| AF.512 Unlisted Shares | ||||||
| 2011 | 246,185 | 3,154 | 96,962 | 0 | 118,981 | 27,088 |
| 2012 | 215,261 | 2,268 | 101,150 | 0 | 83,449 | 28,393 |
| 2013 | 216,163 | 3,699 | 110,719 | 0 | 75,974 | 25,771 |
| 2014 | 304,450 | 12,721 | 88,381 | 0 | 175,291 | 28,057 |
| 2015 | 298,385 | 14,583 | 22,946 | 0 | 229,954 | 30,901 |
| AF.519 Other Equity | ||||||
| 2011 | 0 | 0 | 0 | 0 | 0 | 0 |
| 2012 | 0 | 0 | 0 | 0 | 0 | 0 |
| 2013 | 0 | 0 | 0 | 0 | 0 | 0 |
| 2014 | 0 | 0 | 0 | 0 | 0 | 0 |
| 2015 | 0 | 0 | 0 | 0 | 0 | 0 |
| AF.52 Investment Fund Shares/Units | ||||||
| 2011 | 1,053,980 | 0 | 285,313 | 768,667 | -0 | 0 |
| 2012 | 1,227,722 | 0 | 295,971 | 931,751 | 0 | 0 |
| 2013 | 1,343,696 | 0 | 273,977 | 1,069,719 | 0 | 0 |
| 2014 | 1,678,209 | 0 | 403,037 | 1,275,172 | 0 | 0 |
| 2015 | 1,898,757 | 0 | 466,568 | 1,432,189 | 0 | 0 |
| AF.6 Insurance, Pension and Standardised Guarantee Schemes | ||||||
| 2011 | 244,522 | 0 | 0 | 0 | 0 | 244,522 |
| 2012 | 257,819 | 0 | 0 | 0 | 0 | 257,819 |
| 2013 | 264,948 | 0 | 0 | 0 | 0 | 264,948 |
| 2014 | 305,805 | 0 | 0 | 0 | 0 | 305,805 |
| 2015 | 328,035 | 0 | 0 | 0 | 0 | 328,035 |
| AF.61 Non-life Insurance Technical Reserves | ||||||
| 2011 | 34,951 | 0 | 0 | 0 | 0 | 34,951 |
| 2012 | 41,928 | 0 | 0 | 0 | 0 | 41,928 |
| 2013 | 36,949 | 0 | 0 | 0 | 0 | 36,949 |
| 2014 | 42,138 | 0 | 0 | 0 | 0 | 42,138 |
| 2015 | 44,679 | 0 | 0 | 0 | 0 | 44,679 |
| AF.62 Life Insurance and Annuity Entitlements | ||||||
| 2011 | 139,072 | 0 | 0 | 0 | 0 | 139,072 |
| 2012 | 135,591 | 0 | 0 | 0 | 0 | 135,591 |
| 2013 | 136,499 | 0 | 0 | 0 | 0 | 136,499 |
| 2014 | 158,467 | 0 | 0 | 0 | 0 | 158,467 |
| 2015 | 167,556 | 0 | 0 | 0 | 0 | 167,556 |
| AF.63+AF.64+AF.65 Pension Entitlements, Claims of Pension Funds on Pension Managers, Entitlements to Non-Pension Benefits | ||||||
| 2011 | 70,499 | 0 | 0 | 0 | 0 | 70,499 |
| 2012 | 80,300 | 0 | 0 | 0 | 0 | 80,300 |
| 2013 | 91,500 | 0 | 0 | 0 | 0 | 91,500 |
| 2014 | 105,200 | 0 | 0 | 0 | 0 | 105,200 |
| 2015 | 115,800 | 0 | 0 | 0 | 0 | 115,800 |
| AF.66 Provision for Calls under Standardised Guarantees | ||||||
| 2011 | 0 | 0 | 0 | 0 | 0 | 0 |
| 2012 | 0 | 0 | 0 | 0 | 0 | 0 |
| 2013 | 0 | 0 | 0 | 0 | 0 | 0 |
| 2014 | 0 | 0 | 0 | 0 | 0 | 0 |
| 2015 | 0 | 0 | 0 | 0 | 0 | 0 |
| AF.7 Financial Derivatives and Employee Stock Options | ||||||
| 2011 | 55,127 | 0 | 42,296 | 10,078 | 2,753 | 0 |
| 2012 | 79,755 | 0 | 33,834 | 34,911 | 11,011 | 0 |
| 2013 | 67,190 | 0 | 24,923 | 40,314 | 1,953 | 0 |
| 2014 | 252,173 | 0 | 30,456 | 220,448 | 1,269 | 0 |
| 2015 | 191,439 | 0 | 29,583 | 161,926 | -70 | 0 |
| AF.71 Financial Derivatives | ||||||
| 2011 | 55,127 | 0 | 42,296 | 10,078 | 2,753 | 0 |
| 2012 | 79,755 | 0 | 33,834 | 34,911 | 11,011 | 0 |
| 2013 | 67,190 | 0 | 24,923 | 40,314 | 1,953 | 0 |
| 2014 | 252,173 | 0 | 30,456 | 220,448 | 1,269 | 0 |
| 2015 | 191,439 | 0 | 29,583 | 161,926 | -70 | 0 |
| AF.72 Employee Stock Options | ||||||
| 2011 | 0 | 0 | 0 | 0 | 0 | 0 |
| 2012 | 0 | 0 | 0 | 0 | 0 | 0 |
| 2013 | 0 | 0 | 0 | 0 | 0 | 0 |
| 2014 | 0 | 0 | 0 | 0 | 0 | 0 |
| 2015 | 0 | 0 | 0 | 0 | 0 | 0 |
| AF.8 Other Accounts Receivable | ||||||
| 2011 | 91,577 | 0 | 23,119 | 33,502 | 21,320 | 13,635 |
| 2012 | 75,640 | 0 | 19,170 | 29,225 | 13,889 | 13,356 |
| 2013 | 153,515 | 0 | 19,997 | 33,748 | 85,084 | 14,686 |
| 2014 | 244,906 | 0 | 13,024 | 121,204 | 95,391 | 15,286 |
| 2015 | 294,532 | 0 | 13,005 | 168,156 | 96,343 | 17,028 |
| AF.81 Trade Credits and Advances | ||||||
| 2011 | 22,858 | 0 | 0 | 0 | 15,155 | 7,703 |
| 2012 | 15,735 | 0 | 0 | 0 | 8,294 | 7,441 |
| 2013 | 18,995 | 0 | 0 | 0 | 10,635 | 8,360 |
| 2014 | 27,387 | 0 | 0 | 0 | 18,099 | 9,288 |
| 2015 | 30,254 | 0 | 0 | 0 | 21,090 | 9,164 |
| AF.89 Other Accounts Receivable/Payable excluding Trade Credits and Advances | ||||||
| 2011 | 68,719 | 0 | 23,119 | 33,502 | 6,165 | 5,933 |
| 2012 | 59,905 | 0 | 19,170 | 29,225 | 5,595 | 5,915 |
| 2013 | 134,520 | 0 | 19,997 | 33,748 | 74,449 | 6,326 |
| 2014 | 217,520 | 0 | 13,024 | 121,204 | 77,293 | 5,998 |
| 2015 | 264,278 | 0 | 13,005 | 168,156 | 75,253 | 7,864 |
| AF.L Total Liabilities | ||||||
| 2011 | 3,602,180 | 175,269 | 1,242,949 | 818,722 | 1,082,738 | 289,101 |
| 2012 | 3,542,374 | 136,732 | 1,093,929 | 1,018,350 | 989,638 | 303,725 |
| 2013 | 3,448,118 | 103,895 | 1,001,068 | 1,180,812 | 853,431 | 308,911 |
| 2014 | 4,245,185 | 80,727 | 1,076,843 | 1,634,381 | 1,100,267 | 352,967 |
| 2015 | 4,649,589 | 77,684 | 1,032,079 | 1,799,829 | 1,359,947 | 380,051 |
| BF.90 Financial Net Worth | ||||||
| 2011 | 21,938 | -2,293 | -1,721 | -74 | 27,817 | -4,986 |
| 2012 | 26,305 | -514 | 21,862 | -380 | 12,345 | -7,008 |
| 2013 | 43,267 | 127 | -100 | -480 | 46,123 | -2,402 |
| 2014 | -41,446 | 1,832 | -15,134 | -6,882 | -17,682 | -3,579 |
| 2015 | -52,169 | 711 | 59,872 | -22,291 | -86,155 | -4,305 |
This publication is consistent with the Institutional Sector Accounts publication published by the CSO in November 2016. Here we highlight the importance of the Financial Corporations sector which is presented on a subsector by subsector basis and the commentary emphasises the time series behaviour across subsectors. The Financial Transaction account data can be found on the StatBank.
The Financial Balance Sheet (non-consolidated) account shows the stock at the end of each year of the financial assets and liabilities of the sector. A change in balance sheet position from year to year can be explained in part by the net transactions during that year. In addition, valuation changes, exchange rate changes and reclassifications can impact on the balance sheet position. The consolidated account data is available on the StatBank.
S.12 Financial Corporations are corporate bodies producing financial services on a commercial basis. They can take various legal forms, with a range of ownership arrangements. Further details of the subsectors of S.12 and the financial instrument classes are provided here.
Note, however, that estimates are not available of the stock of non-financial assets (property, equipment, valuables and intangible non-financial assets) and it is not therefore possible to estimate the net worth of each sector or of the total economy.
For more detailed information see Assets and Liabilities of the Financial Sector Methodology (PDF 142KB) .
 Hide Background Notes
Scan the QR code below to view this release online or go to
http://www.cso.ie/en/releasesandpublications/er/alfs/assetsandliabilitiesofthefinancialsector2015/
 Show Table 1(a) Financial Balance Sheet, end-years 2011-2015, non-consolidated Assets
 Hide Table 1(a) Financial Balance Sheet, end-years 2011-2015, non-consolidated Assets