

This chapter outlines key statistics for the Irish business economy. Business Demography data was used to analyse the number of enterprises and employment across five sectors: Industry, Construction, Distribution, Services, and Financial & Insurance. This data was combined with the Structural Business surveys, which are run annually by the CSO.
| Table 16.1 Overview of the Business Economy, 2018 | |||
| Enterprises | Turnover | Persons Engaged | |
| Industry | 18,703 | €268,289bn | 250,635 |
| Construction | 57,626 | €29,153bn | 144,521 |
| Distribution | 47,789 | €182,394bn | 374,968 |
| Services | 157,290 | €254,492bn | 803,147 |
| Financial & Insurance | 8,670 | €60,423bn | 105,424 |
| Total Business Economy | 290,078 | €794,751bn | 1,678,695 |
| Source: CSO | |||
Link to publication: Business in Ireland
In 2018, the business economy in Ireland was worth €794.8 billion, employed 1,678,695 persons and had 290,078 enterprises.
The Services sector, which includes communications companies and accommodation, had the largest number of enterprises at 157,290.
The Construction and Distribution sectors reported 57,626 and 47,789 enterprises respectively. Industry had 18,703 enterprises while the smallest number of enterprises at 8,670 was in the Financial & Insurance field.
| For long labels below use to display on multiple lines | Number of enterprises |
|---|---|
| Industry | 18703 |
| Construction | 57626 |
| Distribution | 47789 |
| Services | 157290 |
| Financial and Insurance | 8670 |
| Industry | Construction | Distribution | Services | Financial and Insurance | |
| Turnover by sector- 2018 | 268.3 | 29.2 | 182.4 | 254.5 | 60.4 |
The Industrial sector generated the most turnover and contributed €268.3 billion to the economy.
The Services sector had a turnover of €254.5 billion; this was followed by the Distribution sector, which includes wholesale and retail businesses, with turnover of €182.4 billion.
The Financial & Insurance sector generated €60.4 billion turnover while the smallest sector in the business economy in Ireland in 2018 was Construction with turnover of €29.2 billion.
| Industry | Construction | Distribution | Services | Financial and Insurance | |
| Persons engaged | 250635 | 144521 | 374968 | 803147 | 105424 |
The Services sector dominated employment figures with 803,147 persons employed.
Distribution enterprises provided employment for 374,968 persons.
The Industrial sector which includes manufacturing had 250,635 persons engaged.
The business sectors with the lowest number of persons employed in 2018 were Construction with 144,521 and the Financial & Insurance sector, which includes banking, with 105,424 persons employed.
| SMEs (<250) | Large (250+) | |
| All Sectors | 77950 | 313878 |
| Industry | 95569 | 778812 |
| Construction | 70455 | 117176 |
| Distribution | 68617 | 47612 |
| Services | 80070 | 198197 |
Gross Value Added (GVA) per person engaged across all sectors averaged €313,878 for Large enterprises and €77,950 for Small and Medium Enterprises (SMEs).
Large Industrial enterprises reported the highest GVA per person engaged at €778,812 for 2018.
The lowest GVA per person engaged was in Distribution enterprises with 250 or more employees, at €47,612.
| For long labels below use to display on multiple lines | GVA |
|---|---|
| Micro (<10) | 17.6 |
| Small (10-49) | 9.2 |
| Medium (50-249) | 10.4 |
| Large (250+) | 62.7 |
Large enterprises which employ 250 or more persons generated 62.7% of all GVA.
Small and Medium enterprises combined accounted for a further 19.6% of GVA, while the remaining 17.6% was generated by Micro enterprises that employ less than 10 persons.
Link to publication: Business in Ireland
| Table 16.2 Contribution of 50 largest enterprises by GVA and employment within sector, 2018 | |||||
| €m | |||||
| Industry | Construction | Distribution | Services1 | Total Business Economy 1 | |
| Business Economy | |||||
| Turnover | 268,289 | 29,153 | 182,394 | 254,492 | 734,328 |
| Gross value added | 107,205 | 10,677 | 23,465 | 90,718 | 232,065 |
| Gross operating surplus | 93,489 | 4,191 | 11,035 | 61,095 | 169,810 |
| Persons engaged | 250,635 | 144,521 | 374,968 | 803,147 | 1,573,271 |
| Contribution of Top 50 Enterprises by GVA | |||||
| Turnover | 78.9% | 21.3% | 31.4% | 52.8% | 43.3% |
| Gross value added | 87.8% | 22.2% | 35.2% | 49.4% | 55.9% |
| Gross operating surplus | 96.2% | 38.0% | 52.5% | 65.3% | 72.8% |
| Persons engaged | 20.7% | 8.1% | 16.3% | 9.1% | 5.3% |
| Contribution of Top 50 Enterprises by employment | |||||
| Turnover | 65.8% | 16.9% | 11.9% | 31.0% | 27.1% |
| Gross value added | 75.2% | 15.2% | 17.7% | 13.5% | 32.9% |
| Gross operating surplus | 81.1% | 16.5% | 10.2% | 10.2% | 39.8% |
| Persons engaged | 27.7% | 10.5% | 23.3% | 13.8% | 10.6% |
| Source: CSO | |||||
| 1 Excludes Financial & Insurance activities (NACE Rev.2 Section K) and includes Services NACE divisions R92, R93, S95, S96. | |||||
| Top 50 by employment | Top 50 by GVA | |
| Gross Operating Surplus | 39.8 | 72.8 |
| GVA | 32.9 | 55.9 |
| Turnover | 27.1 | 43.3 |
The Top 50 enterprises by GVA in Ireland accounted for 43.3% of all turnover with 5.3% of persons engaged. The Top 50 enterprises by employment accounted for 27.1% of total turnover and 10.6% of persons engaged.
Link to publication: Business in Ireland
| Table 16.3 Breakdown of personnel costs in the total business economy1 by size class, 2018 | ||||
| SMEs(<250) | Large (250+) | Total | ||
| Personnel costs | €m | 38,213 | 24,042 | 62,255 |
| Wages & salaries | €m | 34,667 | 21,020 | 55,687 |
| Social security costs | €m | 3,546 | 3,022 | 6,568 |
| Social security costs as a % of personnel costs | % | 9.3 | 12.6 | 10.5 |
| Wages and salaries per employee | €uro | 31,247 | 45,320 | 35,396 |
| Source: CSO | ||||
| 1 The total business economy includes NACE Rev.2 Sections B to N (excluding K) and R92, R93, S95 and S96. | ||||
The business economy in Ireland generated €55.7 billion in wages and salaries and a further €6.6 billion in social security contributions.
The average spend on wages & salaries per employee was €31,247 in Small & Medium enterprises.
In Large enterprises, which employ 250 or more persons, the average spend on wages & salaries per employee was €45,320.
Link to publication: Business in Ireland
| Table 16.4 Number of persons engaged in SMEs by sector, 2012 to 2018 | ||||||
| Year | Construction | Services | Distribution | Industry | Financial | Total |
| 2012 | 85,667 | 408,920 | 238,959 | 110,628 | 30,244 | 874,418 |
| 2013 | 86,494 | 419,112 | 239,689 | 109,688 | 30,653 | 885,636 |
| 2014 | 92,289 | 438,666 | 243,303 | 114,642 | 31,084 | 919,984 |
| 2015 | 102,690 | 463,991 | 251,059 | 118,376 | 32,765 | 968,881 |
| 2016 | 113,558 | 484,187 | 257,718 | 121,921 | 33,621 | 1,011,005 |
| 2017 | 128,303 | 509,914 | 264,684 | 125,596 | 35,116 | 1,063,613 |
| 2018 | 133,932 | 519,068 | 267,160 | 128,787 | 36,289 | 1,085,236 |
| Source: CSO | ||||||
| Large (250+) | SMEs (<250) | |
| Active enterprises | 0.2 | 99.8 |
| Persons engaged | 32.5 | 67.5 |
| Turnover | 53.8 | 46.2 |
| GVA | 62.7 | 37.3 |
SMEs accounted for 99.8% of all enterprises and 67.5% of persons engaged.
They also generated 46.2% of all turnover and 37.3% of GVA.
The number of persons engaged by SMEs increased by 24.1% between 2012 and 2018. All sectors showed increases between 2012 and 2018, with the Construction sector at 56.3% and the Services sector at 26.9% showing the largest increases.
The Distribution sector recorded the lowest increase of 11.8% for the same period.
Link to publication: Business in Ireland
| Persons Engaged | Active Enterprises | |
| Mining & quarrying | 4113 | 447 |
| Manufacturing | 227338 | 16542 |
| Electricity, gas etc | 9135 | 668 |
| Water supply etc | 10049 | 1046 |
| Construction | 144521 | 57626 |
| Motor trade | 37259 | 9299 |
| Wholesale trade | 109535 | 14204 |
| Retail trade | 228174 | 24286 |
| Transportation and storage | 102095 | 24876 |
| Accommodation and food | 194889 | 19172 |
| Information and communication | 107256 | 15910 |
| Financial and insurance | 105424 | 8670 |
| Real estate | 29219 | 14913 |
| Profession, scientific etc | 154162 | 43635 |
| Administrative and support | 144742 | 19050 |
Retail trade accounted for the largest number of persons engaged at 228,174.
Mining and quarrying accounted for the least amount of persons engaged at 4,113.
Link to publication: Business in Ireland
| Table 16.5 Structural Business Statistics by sector and nationality of ownership, 2018 | |||||
| Irish-owned | Foreign-owned affiliates2 | All enterprises | |||
| Owned by EU multinationals | Owned by non-EU multinationals | Total | |||
| Number of enterprises | |||||
| Industry1 | 17,821 | 487 | 389 | 876 | 18,697 |
| Construction | 57,112 | 369 | 137 | 506 | 57,618 |
| Distribution | 46,209 | 911 | 565 | 1,476 | 47,685 |
| Services (excl. Financials) | 153,942 | 1,864 | 1,415 | 3,279 | 157,221 |
| All sectors | 275,084 | 3,587 | 2,488 | 6,137 | 281,221 |
| Number of persons engaged | |||||
| Industry1 | 140,059 | 31,841 | 78,489 | 110,330 | 250,389 |
| Construction | 135,233 | 5,633 | 3,655 | 9,288 | 144,521 |
| Distribution | 268,525 | 66,327 | 39,885 | 106,212 | 374,737 |
| Services (excl. Financials) | 625,172 | 84,687 | 93,019 | 177,706 | 802,878 |
| All sectors | 1,168,989 | 186,152 | 214,434 | 403,536 | 1,572,525 |
| Turnover (€millions) | |||||
| Industry1 | 42,548 | 14,229 | 211,437 | 225,667 | 268,215 |
| Construction | 26,536 | 1,460 | 1,123 | 2,583 | 29,119 |
| Distribution | 92,975 | 34,454 | 54,869 | 89,323 | 182,298 |
| Services (excl. Financials) | 93,190 | 23,508 | 137,752 | 161,261 | 254,451 |
| All sectors | 255,249 | 72,982 | 404,332 | 478,833 | 734,082 |
| GVA (€millions) | |||||
| Industry1 | 12,218 | 4,247 | 90,722 | 94,969 | 107,187 |
| Construction | 9,631 | 473 | 563 | 1,036 | 10,667 |
| Distribution | 12,805 | 4,659 | 5,986 | 10,645 | 23,450 |
| Services (excl. Financials) | 43,721 | 8,740 | 38,243 | 46,983 | 90,704 |
| All sectors | 78,375 | 17,987 | 135,446 | 153,633 | 232,008 |
| Source: CSO | |||||
| 1 Industry covers NACE Rev.2 (05-39) of which Manufacturing (10-33), Construction (41-43), Distribution (45-47) and Services covers NACE Rev. 2 H to N (excluding K) and includes NACE divisions R92, R93, S95, S96. | |||||
| 2There is a discontinuity in the data series for Foreign-owned Multi-nationals in Ireland for 2018. This is due to a change in CSO procedures and not a year-on-year change. | |||||
Figure 16.9 Irish MNEs abroad and foreign MNEs in Ireland, 2018
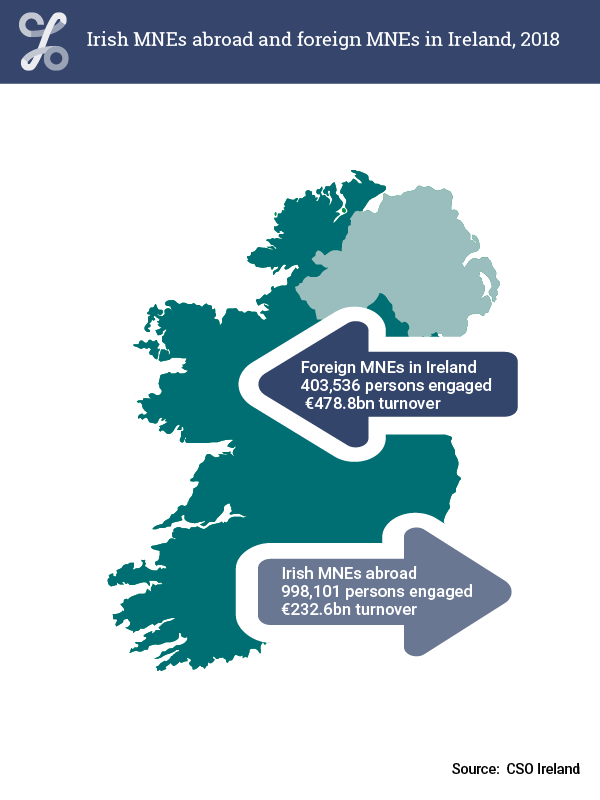
Foreign multinationals in Ireland employed 403,536 persons and generated €478.8 billion in turnover.
Foreign-owned enterprises accounted for 65.2% of total turnover and 66.2% of total GVA in the Irish business economy.
Services which includes Distribution accounted for 77.2% of employment in Irish-owned affiliates abroad.
The average turnover per person engaged in Irish-owned foreign affiliates was €233.0k.
Turnover per person engaged in Irish-owned foreign affiliates was lowest in Services.
Link to publication: Business in Ireland
Figure 16.10 Employment in Irish affiliates abroad 2018
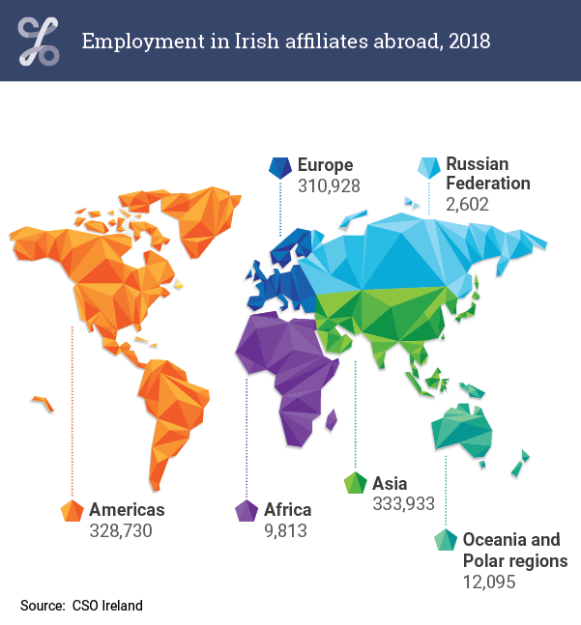
In 2018, Irish multinationals abroad had turnover of €232.6 billion, with US and UK affiliates accounting for 57.3% of this. There were over 998,000 persons employed in Irish multinationals abroad, 33.8% of whom were in the US and the UK.
In terms of employment by continent, Europe, Asia and the Americas each accounted for approximately a third of the total, with employment in the remaining regions amounting to 2.5%.
| Services (ex. Finance) | Distribution | Construction | Manufacturing | |
| IRELAND | 36.3 | 11.1 | 4.6 | 48.1 |
| Germany | 39.4 | 18.3 | 6.6 | 35.7 |
| Italy | 37.9 | 19.7 | 7.2 | 35.3 |
| Spain | 44.9 | 23.1 | 8.3 | 23.7 |
| France | 45.3 | 19.3 | 9.8 | 25.6 |
| United Kingdom | 56.5 | 17.8 | 9.3 | 16.5 |
The Manufacturing sector accounted for 48.1% of total GVA in Ireland in 2017.
The United Kingdom recorded the lowest percentage of total GVA for the Manufacturing sector at 16.5%.
Link to publication: Business in Ireland
Go to next theme Economy
Learn about our data and confidentiality safeguards, and the steps we take to produce statistics that can be trusted by all.