What’s in a County?
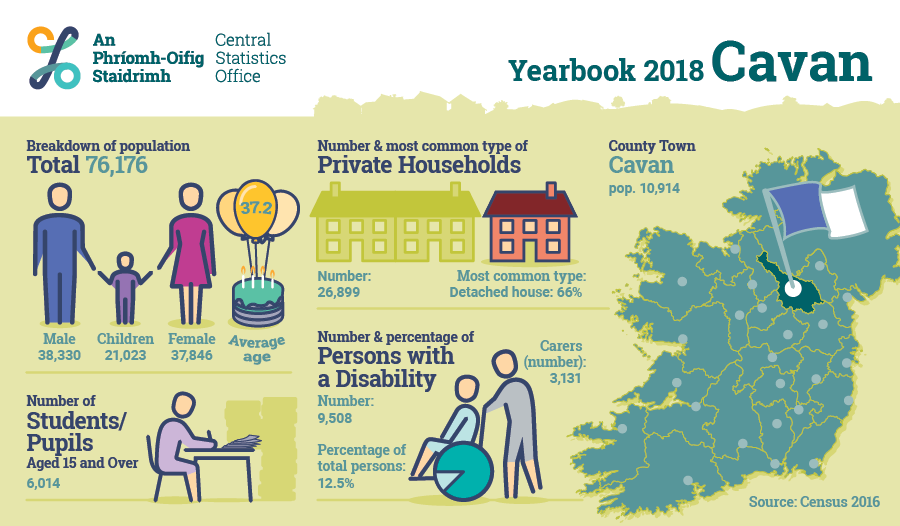
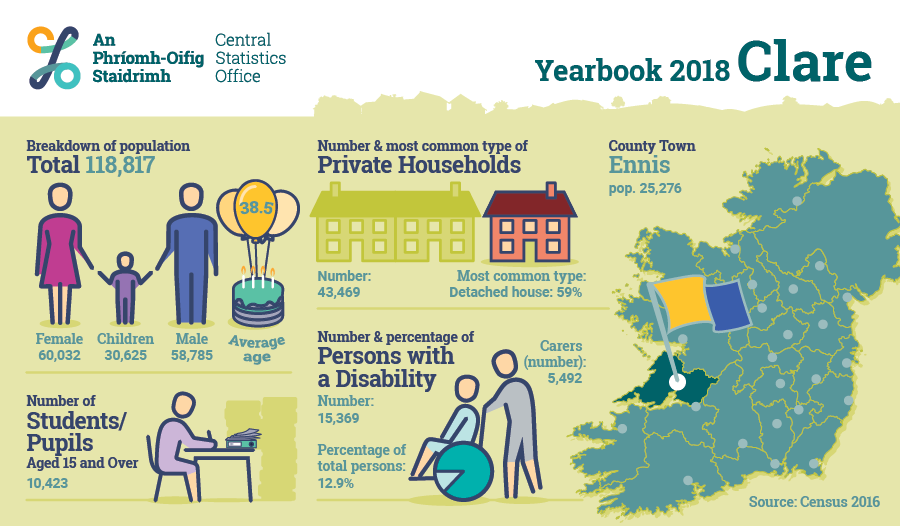
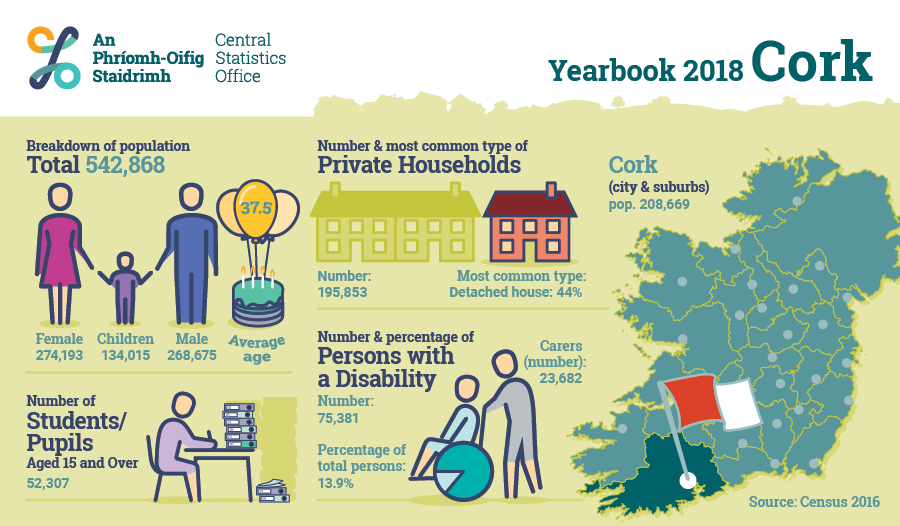
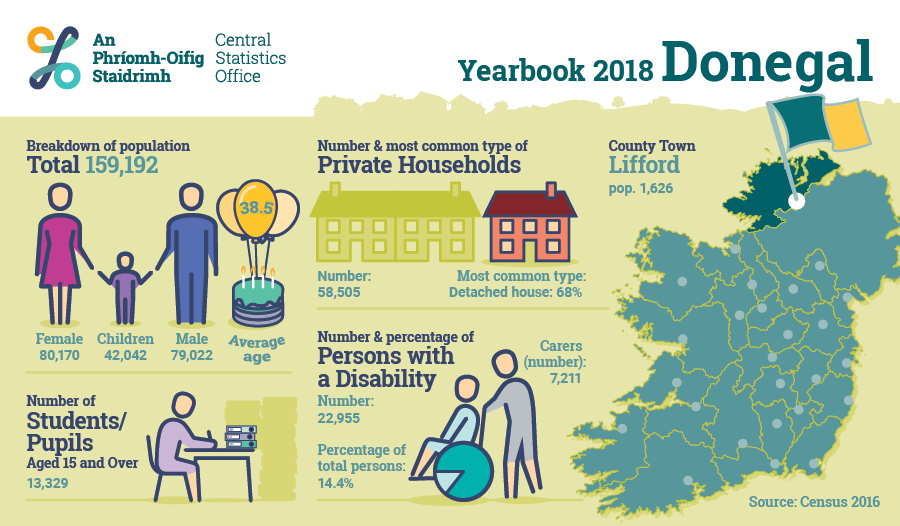
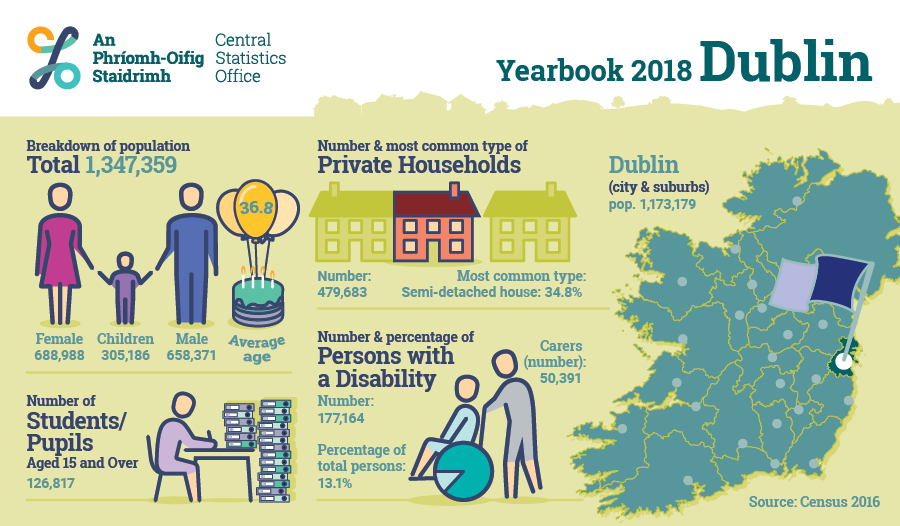
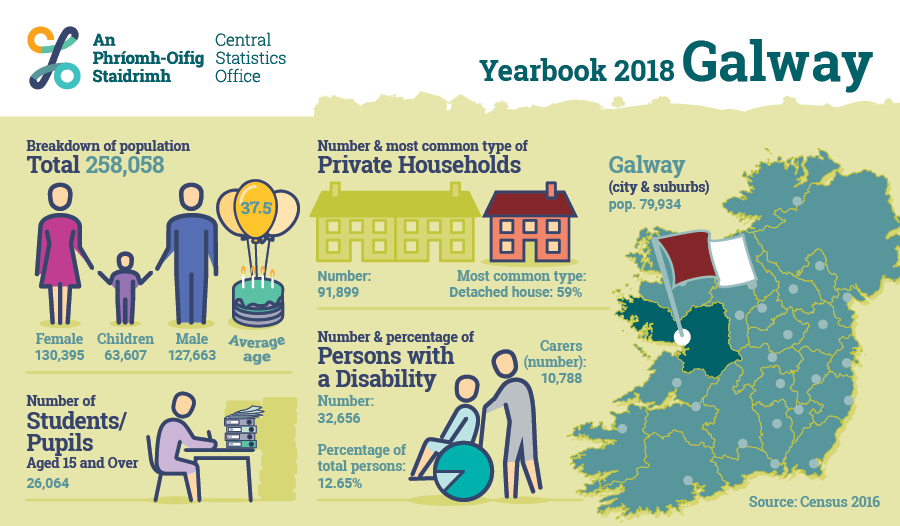
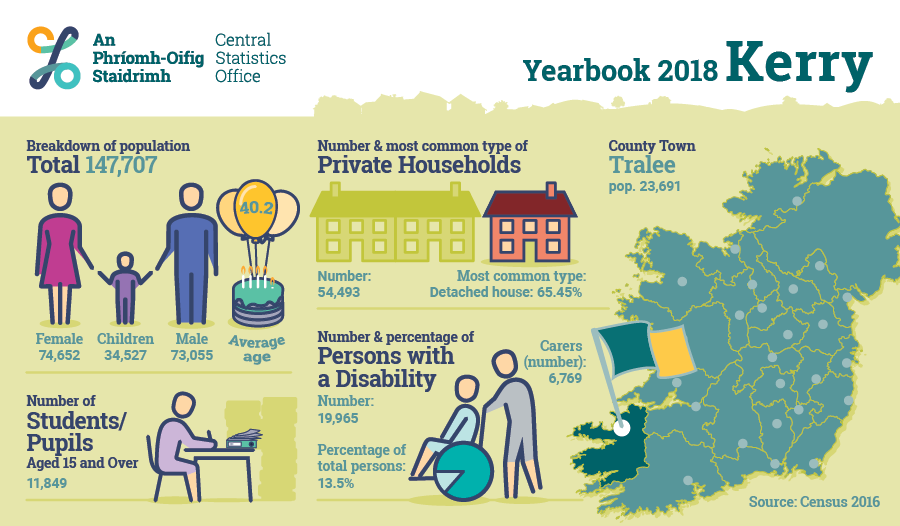
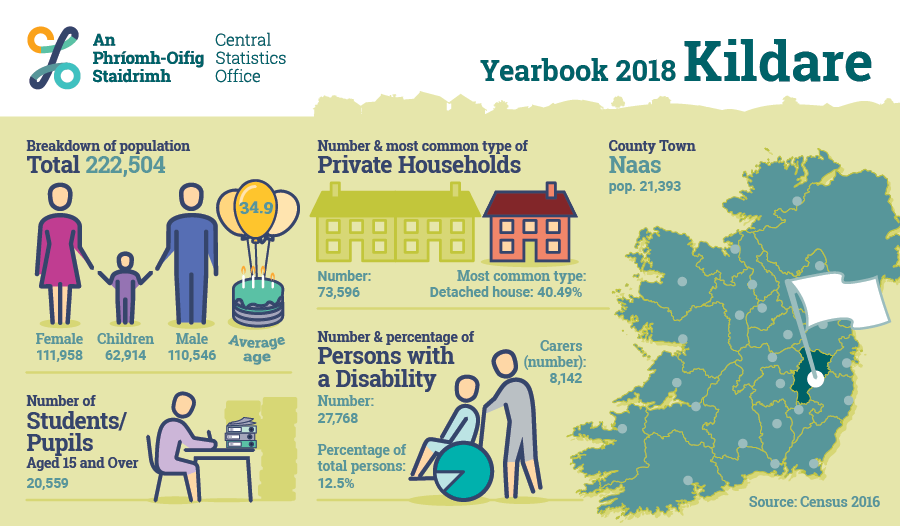
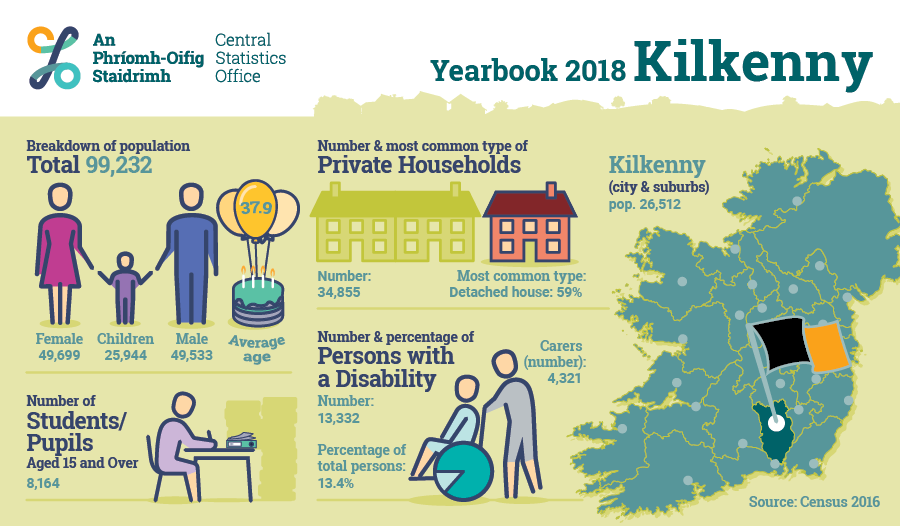
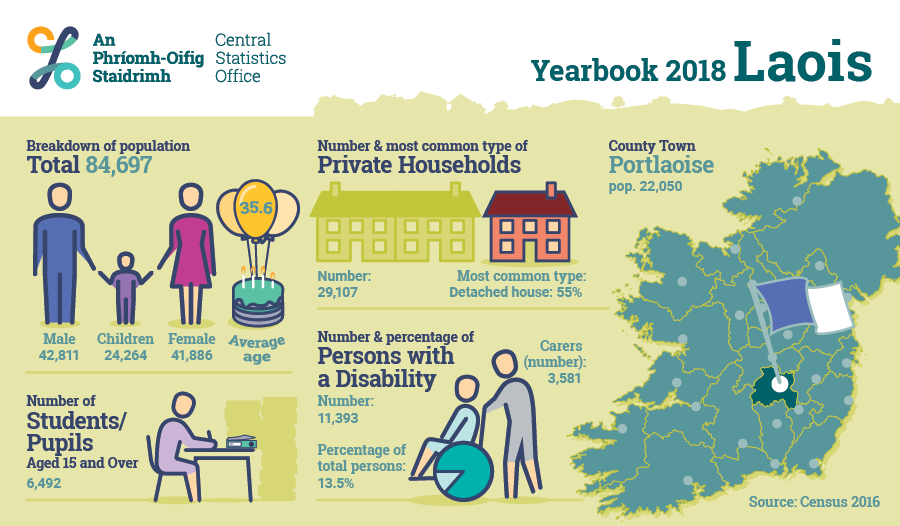
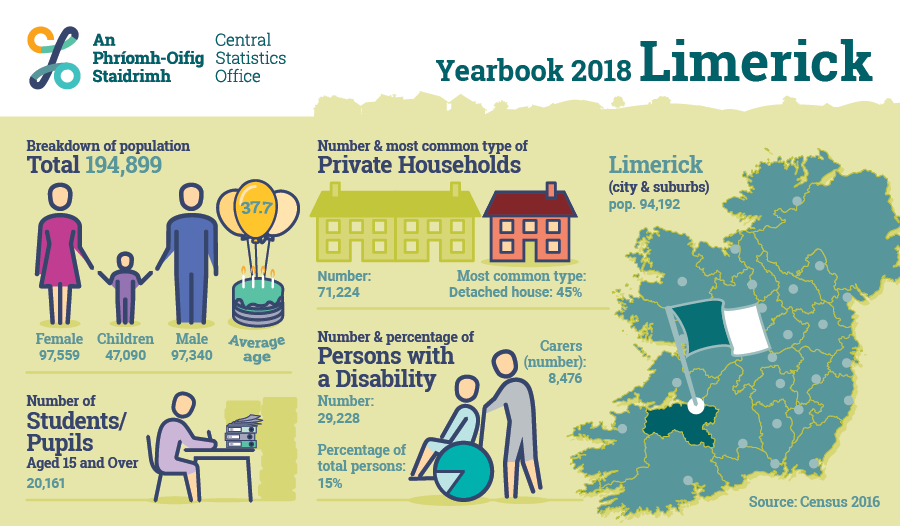
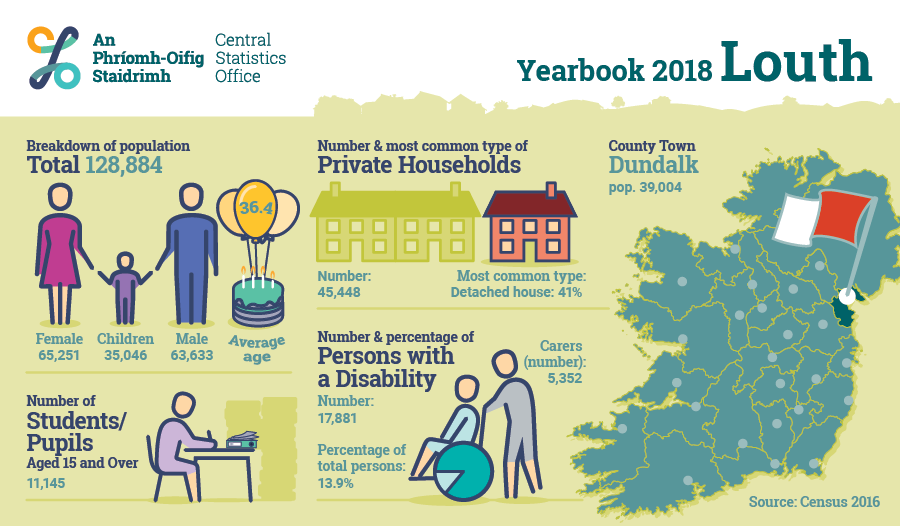
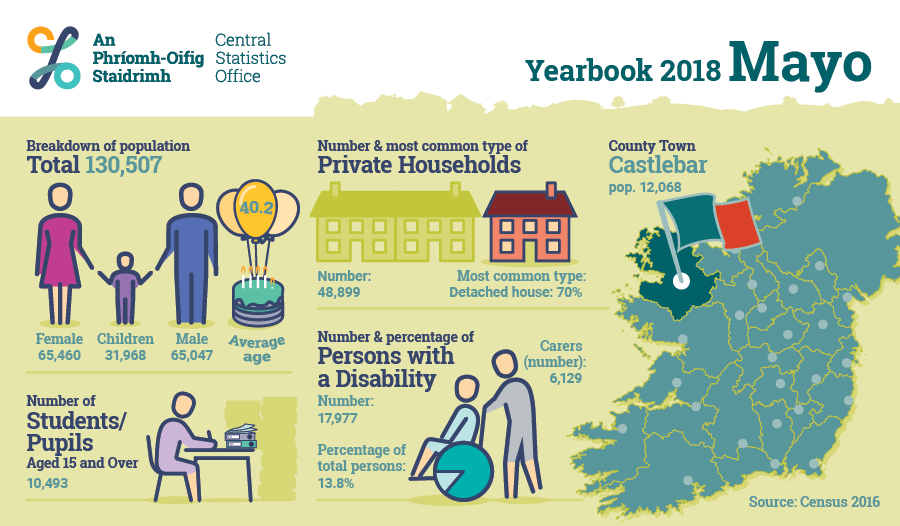
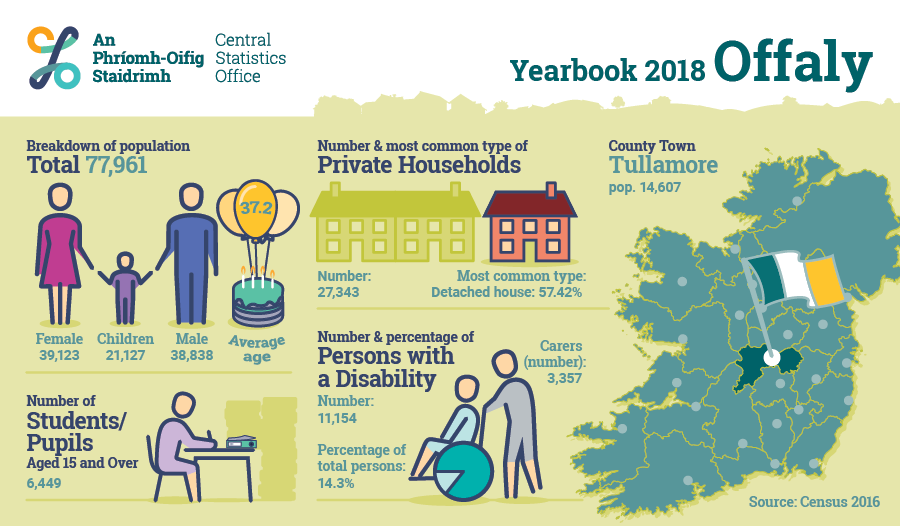
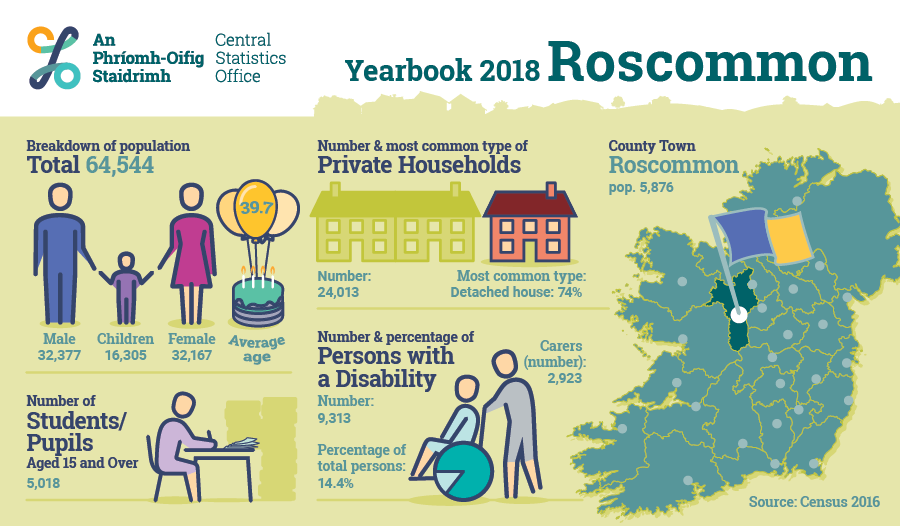
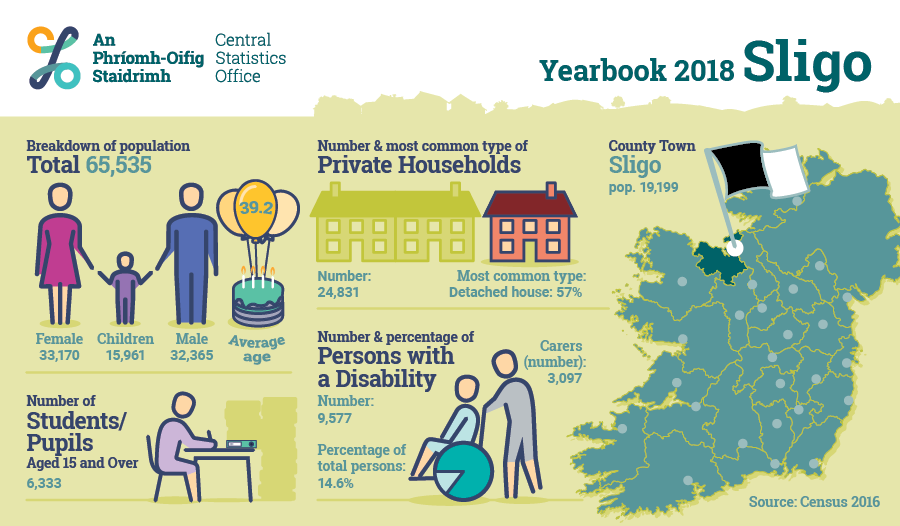
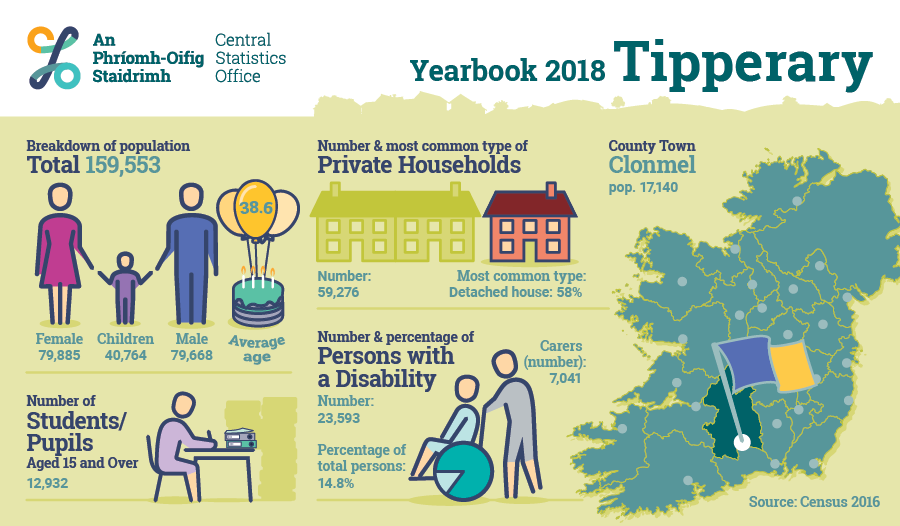
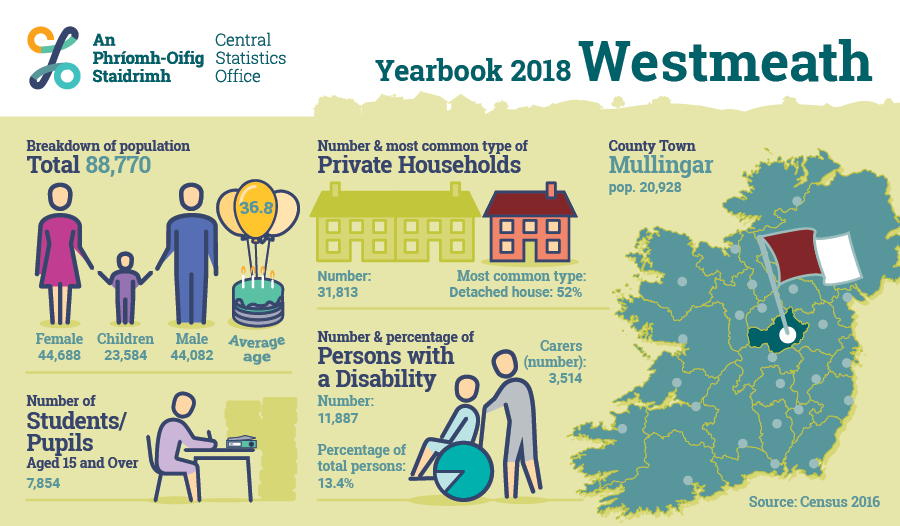
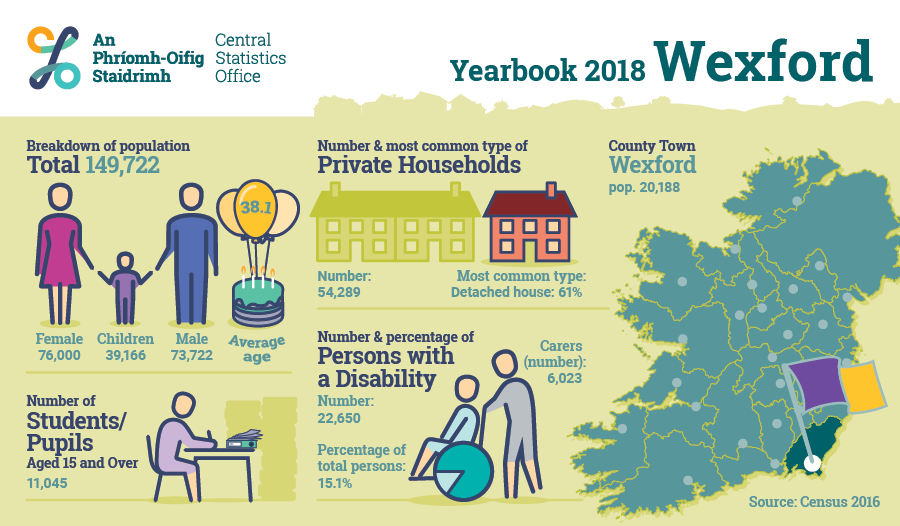
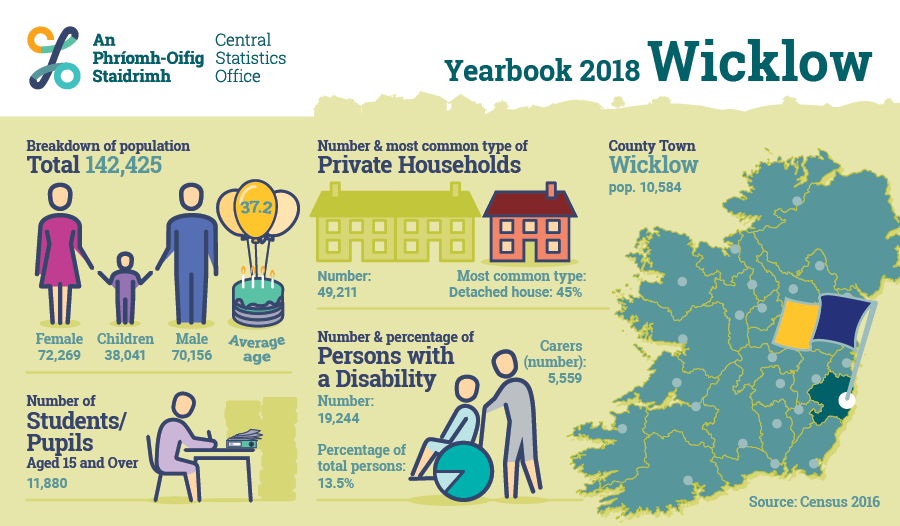
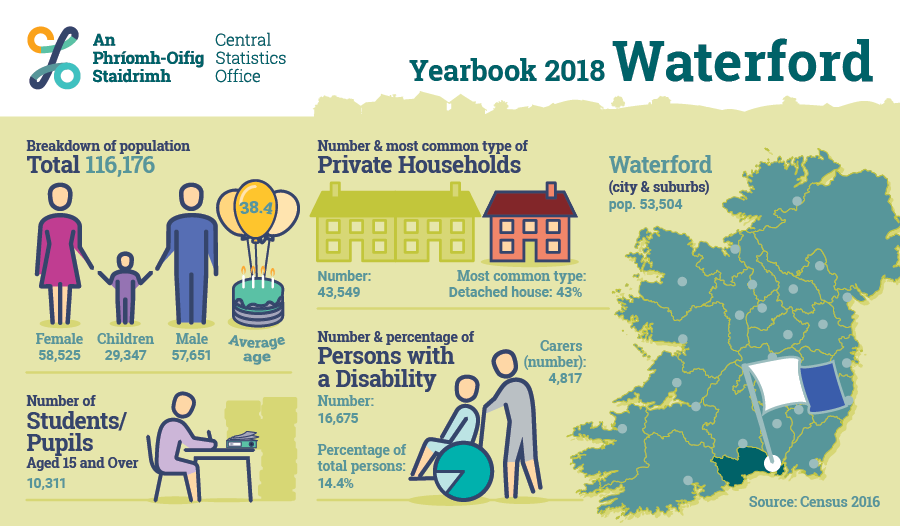
For this chapter we used Census 2016 data to create 26 county infographics. We have information on population numbers, the average age, the number of students/pupils and persons with a disability and the number of carers in each. Watch the animation below to view every county in sequence or scroll down to view and download your county's infographic.

Find your county's profile below. Click to view larger or download to view and print.
Go to next chapter >>> Life Events
Learn about our data and confidentiality safeguards, and the steps we take to produce statistics that can be trusted by all.