

SDG 2.a.1 The Agriculture Orientation Index for Government Expenditure is published by the Food and Agriculture Organisation, United Nations.
The Agriculture Orientation Index (AOI) is the agriculture share of government expenditure divided by the agriculture share of GDP. An AOI larger than 1 means the agriculture sector receives a higher share of government spending relative to its economic value. An AOI value smaller than 1 reflects a lower orientation to agriculture.
The AOI was 1.2% in 2018. The AOI was highest in 2008 at 3.63%. See Table 3.1.
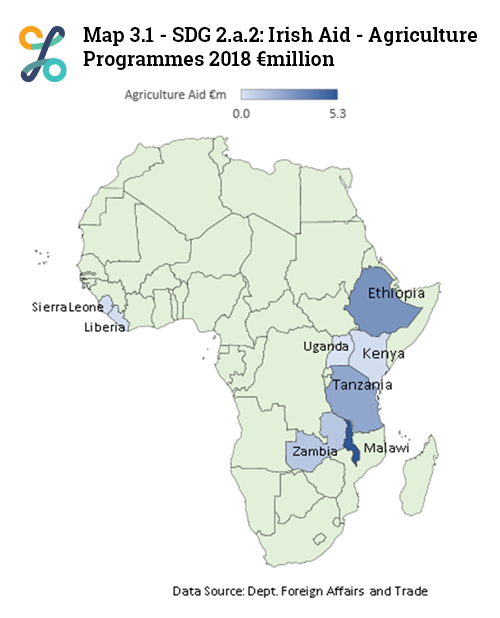
SDG 2.a.2: Total Official Flows (Official Development Assistance plus Other Official Flows) to the Agriculture Sector was published by the Department of Foreign Affairs and Trade in their Irish Aid Annual Report 2018.
Irish Aid (a division of the Department of Foreign Affairs and Trade) is the Irish Government’s official aid programme, working on behalf of Irish people to address poverty and hunger in some of the world’s poorest countries. The aid programme is an integral part of Ireland’s foreign policy.
The Official Development Assistance (ODA) spent on agriculture was €25.21 million (3% of Total ODA) in 2018. See Table 3.2.
ANNEX NINE of the Irish Aid Annual Report 2018 shows the 2018 sector breakdown of the funding by country. Table 3.3 and Map 3.1 shows the agricultural aid received by selected countries.
SDG 2.b.1 Agricultural Export Subsidies aim to correct and prevent trade restrictions and distortions in world agricultural markets, including through the parallel elimination of all forms of agricultural export subsidies and all export measures with equivalent effect, in accordance with the mandate of the Doha Development Round. These data are classified as Tier 2 in the Tier Classification for Global SDG Indicators.
A report by UNCTAD (UN Conference on Trade and Development) indicates that Agricultural Export Subsidies are vanishing. The two paragraphs below are extracts from UNCTAD's report on SDG 2.b.
Agricultural export subsidies more than halved in the five years from 2010 to 2015. The 2015 Nairobi package (WTO, 2019a) has further strengthened WTO members’ commitment to abolish trade-distorting subsidies in agricultural markets. The impacts of these policies have led to improved market access for developing economies that have instigated structural changes to access global agricultural markets. Spikes in food prices combined with low agricultural commodity prices have increased governmental pressure to remove trade distorting protectionist policies that may not be captured by traditional export subsidy outlay measures alone. Hence, broader and more comprehensive monitoring of trade barriers may be required to achieve the ambitions of SDG 2.
Since 1999, the Agreement on Agriculture (WTO, 2019b) has placed limits on export subsidies in order to prevent the disposal or dumping of surplus commodities on global agricultural markets. Following the 2015 Nairobi Ministerial Conference, WTO members have taken steps to phase out export subsidy entitlements from their WTO schedule of commitments in order to level the playing field between developed and developing economies. Apart from a few selected agricultural products, developed countries have agreed to remove export subsidies with immediate effect, and most developing countries have agreed to do so by 2018.
SDG 2.c.1 Indicator of Food Price Anomalies; the Consumer Price Index (CPI) measure for food and non-alcoholic beverages was used as a proxy for indicator SDG 2.c.1.
The CPI for food and non-alcoholic beverages was 96.9 in 2019, slightly down from 97.5 in 2018. This Index in the CPI was at its highest at 107.7 in 2013 but has declined continuously since then. See Table 3.4.
At a Global level, the Food and Agriculture Organisation (FAO) Food Price Index is a measure of the monthly change in international prices of a basket of food commodities. It consists of the average of five commodity group price indices, weighted with the average export shares of each of the groups for 2002-2004. For more detailed information please see the FAO Food Price Index Report.
The FAO Food Price Index (FFPI) averaged 180.5 points in February 2020, down 1.9 points (1.0%) from January but still 13.5 points (8.1%) higher than in February 2019. See Figure 3.1.
| Month | Nominal Food Price Index | Real Food Price Index |
|---|---|---|
| 1/2018 | 168.443434145033 | 132.476451534223 |
| 2/2018 | 171.423797149994 | 134.820430788654 |
| 3/2018 | 173.178933250823 | 136.20080042893 |
| 4/2018 | 173.986512659822 | 136.835940973168 |
| 5/2018 | 175.824922505769 | 138.281803283521 |
| 6/2018 | 172.726614588811 | 135.845063373281 |
| 7/2018 | 167.096432779211 | 131.4170694214 |
| 8/2018 | 167.831916467391 | 131.995508525696 |
| 9/2018 | 164.525942162748 | 129.395444314434 |
| 10/2018 | 162.940634608062 | 128.148640480844 |
| 11/2018 | 161.753721179752 | 127.215163435218 |
| 12/2018 | 161.465326080169 | 126.988348067634 |
| 1/2019 | 163.929609516438 | 128.926443944558 |
| 2/2019 | 167.023171447944 | 131.35945125866 |
| 3/2019 | 167.620302703789 | 131.829079714504 |
| 4/2019 | 170.704292494498 | 134.254558784761 |
| 5/2019 | 173.810532810306 | 136.697537323755 |
| 6/2019 | 173.187639761566 | 136.207647876883 |
| 7/2019 | 171.719447203397 | 135.052951991808 |
| 8/2019 | 169.727445904723 | 133.486293933337 |
| 9/2019 | 169.232768360416 | 133.097242700464 |
| 10/2019 | 172.034401308697 | 135.300655337908 |
| 11/2019 | 176.842552069454 | 139.082142900541 |
| 12/2019 | 181.468460845383 | 142.720301804547 |
| 1/2020 | 182.441731614917 | 143.485754364834 |
| 2/2020 | 180.532954279768 | 141.984549824491 |
Go to next chapter: Background Notes
Learn about our data and confidentiality safeguards, and the steps we take to produce statistics that can be trusted by all.