
| 2014 | 2015 | % change | |
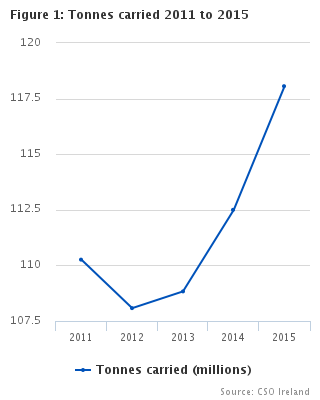
| Tonnes carried (thousand) | 112,499 | 118,059 | 4.9% |
| Tonne-km (million) | 9,772 | 9,844 | 0.7% |
| Vehicle kilometres (million) | 1,307 | 1,302 | -0.4% |
| Average number of vehicles | 83,650 | 87,094 | 4.1% |
| Laden journeys (thousand) | 10,094 | 10,279 | 1.8% |
| Table A: Key road freight statistics, 2005-2015 | |||||
| Year | Tonne-km | Tonnes carried | Vehicle kilometres | Average number of vehicles | Laden journeys |
| million | thousand | million | number | thousand | |
| 2005 | 17,819 | 291,883 | 2,312 | 79,916 | 22,425 |
| 2006 | 17,322 | 299,030 | 2,242 | 87,135 | 23,248 |
| 2007 | 18,707 | 299,307 | 2,332 | 97,752 | 23,646 |
| 2008 | 17,289 | 245,788 | 2,207 | 97,640 | 20,085 |
| 2009 | 12,071 | 148,328 | 1,585 | 87,616 | 12,659 |
| 2010 | 10,924 | 125,865 | 1,457 | 84,025 | 11,177 |
| 2011 | 9,941 | 110,260 | 1,338 | 81,178 | 10,168 |
| 2012 | 9,895 | 108,078 | 1,316 | 79,971 | 10,057 |
| 2013 | 9,138 | 108,831 | 1,261 | 76,967 | 9,925 |
| 2014 | 9,772 | 112,499 | 1,307 | 83,650 | 10,094 |
| 2015 | 9,844 | 118,059 | 1,302 | 87,094 | 10,279 |
Vehicles used for hire or reward performed 76.3% of total road freight activity, amounting to 7.5 billion tonne-km in 2015. These vehicles carried 75.7 million tonnes and travelled a total of 769 million vehicle kilometres during 2015. Vehicles used for own account purposes accounted for 2.3 billion tonne-km (23.7%) of total activity, and travelled a total of 533 million vehicle kilometres, carrying 42.3 million tonnes of goods. See tables B and 1.
| Table B: Road freight activity by main use of vehicle, 2015 | ||||||
| Main use of vehicle | Tonne-km | Tonnes carried | Vehicle kilometres | |||
| million | % | thousand | % | million | % | |
| Hire or reward | 7,510 | 76.3% | 75,740 | 64.2% | 769 | 59.1% |
| Own account | 2,334 | 23.7% | 42,319 | 35.8% | 533 | 40.9% |
| Total | 9,844 | 100.0 | 118,059 | 100.0 | 1,302 | 100.0 |
Vehicles owned by transport companies carried 67.0 million tonnes of goods in 2015 compared with 51.1 million tonnes carried by all other goods vehicles. Although carrying a greater quantity of goods, vehicles owned by transport companies travelled slightly more, covering 662 million vehicle kilometres compared with 641 million for all other goods vehicles. Vehicles in the transport sector accounted for almost 4,000 (38.9%) of all laden journeys compared with just under 6,300 for all other goods vehicles. See tables C and 3.
| Table C: Road freight activity by business of owner, 2015 | ||||||||
| Business of owner | Tonne-km | Tonnes carried | Vehicle kilometres | Laden journeys | ||||
| million | % | thousand | % | million | % | thousand | % | |
| Transport | 6,863 | 69.7 | 66,974 | 56.7 | 662 | 50.8 | 3,995 | 38.9 |
| Other | 2,981 | 30.3 | 51,085 | 43.3 | 641 | 49.2 | 6,285 | 61.1 |
| Total | 9,844 | 100.0 | 118,059 | 100.0 | 1,302 | 100.0 | 10,279 | 100.0 |
In 2015, seven in ten (68.7%) of the total fleet of 87,094 vehicles had an unladen weight of between 2 to 5 tonnes. However, these vehicles were responsible for just 4.0% of the total weight of goods transported and 2.8% of total activity in terms of tonne-km. Vehicles with an unladen weight of 10 tonnes or more accounted for less than one fifth (19.8%) of the vehicle fleet, but were responsible for 89.4% of total activity in terms of tonne-km. These vehicles carried 102.7 million tonnes of goods, representing 87.0% of the total tonnes carried, and they made over half (53.3%) of all laden journeys. See tables D and 3.
| Table D: Road freight activity by unladen weight of vehicle, 2015 | ||||||||
| Unladen weight (tonnes) | Tonne-km | Tonnes carried | No. of vehicles | Laden journeys | ||||
| million | % | thousand | % | number | % | thousand | % | |
| 2 - 5 | 274 | 2.8 | 4,742 | 4.0 | 59,829 | 68.7 | 3,251 | 31.6 |
| 5 - 7.5 | 200 | 2.0 | 2,784 | 2.4 | 4,869 | 5.6 | 613 | 6.0 |
| 7.5 - 10 | 565 | 5.7 | 7,858 | 6.7 | 5,121 | 5.9 | 937 | 9.1 |
| 10 - 12.5 | 2,619 | 26.6 | 34,973 | 29.6 | 7,208 | 8.3 | 2,086 | 20.3 |
| Over 12.5 | 6,186 | 62.8 | 67,703 | 57.3 | 10,067 | 11.6 | 3,392 | 33.0 |
| Total | 9,844 | 100.0 | 118,059 | 100.0 | 87,094 | 100.0 | 10,279 | 100.0 |
Vehicles manufactured in the four years to 2015 (2012-2015) accounted for almost one fifth (19.7%) of the goods vehicle fleet in 2015. These vehicles carried 21.6% of all goods and accounted for 31.8% of overall road freight activity (tonne-km). Over one third of all vehicles (34.5%) were aged 10 years or more and they carried 29.3% of all goods. See tables E, 10 and 11.
| Table E: Road freight activity by age of vehicle, 2015 | ||||||||
| Year of manufacture | Tonne-km | Tonnes carried | Vehicle kilometres | No. of vehicles | ||||
| million | % | thousand | % | million | % | number | % | |
| 2015 | 701 | 7.1 | 6,049 | 5.1 | 78 | 6.0 | 3,597 | 4.1 |
| 2014 | 825 | 8.4 | 7,030 | 6.0 | 111 | 8.5 | 5,759 | 6.6 |
| 2013 | 794 | 8.1 | 6,350 | 5.4 | 101 | 7.8 | 4,326 | 5.0 |
| 2012 | 815 | 8.3 | 6,032 | 5.1 | 96 | 7.4 | 3,507 | 4.0 |
| 2011 | 664 | 6.7 | 6,413 | 5.4 | 82 | 6.3 | 3,980 | 4.6 |
| 2010 | 403 | 4.1 | 3,473 | 2.9 | 54 | 4.1 | 3,394 | 3.9 |
| 2009 | 468 | 4.8 | 4,727 | 4.0 | 62 | 4.8 | 3,118 | 3.6 |
| 2008 | 927 | 9.4 | 11,191 | 9.5 | 128 | 9.8 | 8,589 | 9.9 |
| 2007 | 958 | 9.7 | 14,296 | 12.1 | 132 | 10.1 | 10,688 | 12.3 |
| 2006 | 1,208 | 12.3 | 17,881 | 15.1 | 149 | 11.4 | 10,082 | 11.6 |
| 2005 or before | 2,081 | 21.1 | 34,617 | 29.3 | 309 | 23.7 | 30,053 | 34.5 |
| Total | 9,844 | 100.0 | 118,059 | 100.0 | 1,302 | 100.0 | 87,094 | 100.0 |
In 2015, the bulk of road freight activity as measured by tonne-km (86.3%) was carried out over distances greater than 50 kilometres. A total of 56.2 million tonnes of goods (47.6%) was transported over these longer distances, covering 732 million vehicle kilometres. For distances of 50 km and less, the total amount of goods carried was greater (61.9 million tonnes) but they represented just 13.7% of the overall activity, as measured by tonne-km. See tables F and 5.
| Table F: Road freight activity by length of haul, 2015 | ||||||
| Length of haul | Tonne-km | Tonnes carried | Vehicle kilometres | |||
| million | % | thousand | % | million | % | |
| Up to 10 km | 96 | 1.0 | 14,748 | 12.5 | 456 | 35.0 |
| 11 - 25 km | 412 | 4.2 | 23,533 | 19.9 | 39 | 3.0 |
| 26 - 50 km | 842 | 8.6 | 23,576 | 20.0 | 75 | 5.8 |
| 51 - 150 km | 2,971 | 30.2 | 34,700 | 29.4 | 277 | 21.3 |
| 151 - 500 km | 4,221 | 42.9 | 20,031 | 17.0 | 365 | 28.0 |
| Over 500 km | 1,303 | 13.2 | 1,470 | 1.2 | 90 | 6.9 |
| Total | 9,844 | 100.0 | 118,059 | 100.0 | 1,302 | 100.0 |
Of the total total weight of goods carried, the commodity group quarry products, metal ores and peat accounted for the largest share (22.9% or 27.0 million tonnes) in 2015. This was followed by foodstuffs at 19.2% (22.7 million tonnes). However, the contribution of quarry products, metal ores and peat to overall road freight activity, in terms of tonne-km, was just 9.4%, reflecting heavier loads carried over shorter distances. In contrast, foodstuffs accounted for 27.7% of total tonne-km. See tables G, 8 and 9.
| Table G: Road freight activity by commodity group carried, 2015 | |||
| Commodity | Tonne-km | Tonnes carried | Vehicle kilometres |
| million | thousand | million | |
| Products of agriculture, forestry and fishing | 1,169 | 13,283 | 76 |
| Coal and natural gas | 77 | 752 | 6 |
| Quarry products, metal ores and peat | 926 | 27,049 | 47 |
| Foodstuffs | 2,722 | 22,651 | 238 |
| Textiles and leather | 123 | 816 | 16 |
| Wood, pulp and paper | 480 | 4,390 | 40 |
| Coke and refined petroleum products | 857 | 10,690 | 48 |
| Chemicals and plastics | 441 | 3,935 | 38 |
| Other non-metallic mineral products | 673 | 15,350 | 52 |
| Metal products (except machinery and equipment) | 209 | 1,725 | 19 |
| Machinery and equipment | 199 | 1,579 | 31 |
| Furniture and other manufactured goods | 114 | 937 | 32 |
| Secondary raw materials and waste | 290 | 4,283 | 26 |
| Other goods | 1,564 | 10,618 | 635 |
| Total | 9,844 | 118,059 | 1,302 |
Goods vehicles involved in the delivery of goods to road works or building sites carried 32.6 million tonnes of road freight in 2015, which was the highest among all types of work carried out by goods vehicles. This was followed by those involved in the delivery of goods to retail outlets (13.8 million tonnes) and the delivery of materials and fuels to factories (13.1 million tonnes). See figure 2 and table 6.
| Type of work | Tonnes |
|---|---|
| Import/export work | 11860000 |
| Carriage of livestock | 1375000 |
| Carriage of other farm produce from farms | 5753000 |
| Carriage of fertilisers, feeding stuffs, etc. to farms | 6126000 |
| Delivery of goods to road works or building sites | 32556000 |
| Delivery of goods to retail outlets | 13808000 |
| Delivery of goods to wholesalers | 10029000 |
| Delivery of materials and fuels to factories | 13129000 |
| Delivery of goods to households | 3536000 |
| Other work | 19888000 |
In terms of overall road freight activity in 2015 vehicles involved in import/export work (2.3 billion tonne-km) were the largest contributors, representing almost one quarter (23.7%) of total tonne-km. This was followed by those involved in the delivery of goods to retail outlets (14.6%). See figure 3 and table 6.
| Type of work | % |
|---|---|
| Import/export work | 23.7 |
| Carriage of livestock | 1.2 |
| Carriage of other farm produce from farms | 4 |
| Carriage of fertilisers, feeding stuffs, etc. to farms | 4.1 |
| Delivery of goods to road works or building sites | 9.8 |
| Delivery of goods to retail outlets | 14.6 |
| Delivery of goods to wholesalers | 11.7 |
| Delivery of materials and fuels to factories | 11.5 |
| Delivery of goods to households | 2 |
| Other work | 17.4 |
The vast majority of the 118.1 million tonnes of goods transported by Irish goods vehicles in 2015 was carried out within the Republic of Ireland. National transport accounted for 94.2% (111.2 million tonnes) of the total, with international transport representing the remainder. In terms of overall road freight activity, as expressed by tonne-km, the difference was not quite as significant, with just under eighty percent (78.3%) of activity carried out within the national territory. See tables H, 2, 7 and 9.
| Table H: National and international road freight activity in 2015 | ||||
| Type of transport | Tonne-km | Tonnes carried | ||
| million | % | thousand | % | |
| National | 7,707 | 78.3 | 111,191 | 94.2 |
| International | 2,137 | 21.7 | 6,867 | 5.8 |
| Total | 9,844 | 100.0 | 118,059 | 100.0 |
Dublin was the region of origin for just over one quarter (26.2%) of all goods carried within the national territory. The South-West and South-East followed with 16.6% and 14.1% respectively. See tables I and 14.
| Table I: Domestic transport activity1 classified by region of origin, 2015 | |||||||
| Region | Tonne-km | Tonnes carried | |||||
| million | % | thousand | % | ||||
| Border | 718 | 9.3 | 10,395 | 9.3 | |||
| Midland | 473 | 6.1 | 6,539 | 5.9 | |||
| West | 600 | 7.8 | 8,785 | 7.9 | |||
| Dublin | 2,068 | 26.8 | 29,151 | 26.2 | |||
| Mid-East | 731 | 9.5 | 12,522 | 11.3 | |||
| Mid-West | 669 | 8.7 | 9,580 | 8.6 | |||
| South-East | 1,076 | 14.0 | 15,721 | 14.1 | |||
| South-West | 1,370 | 17.8 | 18,498 | 16.6 | |||
| Total | 7,707 | 100.0 | 111,191 | 100.0 | |||
| 1Domestic transport activity excludes Northern Ireland and Other countries in Table 14 | |||||||
In 2015, the United Kingdom (including Northern Ireland) was the major source/destination region for the transport of goods to and from the Republic of Ireland. In total, 4.7 million tonnes of goods were transported, with a total of 2.1 million tonnes received and 2.6 million tonnes dispatched from the Republic of Ireland to the UK. See tables J and 15.
| Table J: Tonnes of goods received and dispatched to and from the Republic of Ireland by country, 2015 | ||||||||
| Country | Tonnage received | Tonnage dispatched | Total tonnage | |||||
| thousand | % | thousand | % | thousand | % | |||
| United Kingdom | 2,062 | 88.4 | 2,644 | 89.9 | 4,706 | 89.2 | ||
| (of which Northern Ireland) | 723 | 31.0 | 878 | 29.9 | 1,601 | 30.4 | ||
| France | 52 | 2.2 | 90 | 3.1 | 142 | 2.7 | ||
| Netherlands | 84 | 3.6 | 48 | 1.6 | 132 | 2.5 | ||
| Germany | 48 | 2.1 | 46 | 1.6 | 94 | 1.8 | ||
| Italy | 32 | 1.4 | 40 | 1.4 | 72 | 1.4 | ||
| Spain | 18 | 0.8 | 14 | 0.5 | 32 | 0.6 | ||
| Other Countries | 36 | 1.5 | 59 | 2.0 | 95 | 1.8 | ||
| Total | 2,333 | 100.0 | 2,941 | 100.0 | 5,274 | 100.0 | ||
The weight of goods carried by road on Irish registered vehicles increased by 4.9% to 118.1 million tonnes between 2014 and 2015. The weight of goods carried by vehicles owned by transport companies increased by 2.7% to 67.0 million tonnes, while the share of goods transported by vehicles owned by transport companies decreased from 58.0% in 2014 to 56.7% in 2015. Overall road freight activity, as measured by tonne-km, rose marginally but remained at 9.8 billion. The largest increase in the weight of goods (21.4%) occurred for vehicles involved in the carriage of other farm produce from farms, while the largest decrease occurred for vehicles involved in the delivery of goods to households where the weight of goods carried fell by 12.0% in 2015. See table K.
| Table K: Road freight activity, a comparison between 2014 and 2015 | |||||||
| Category | Tonne-km | Tonnes carried | |||||
| 2014 | 2015 | Change | 2014 | 2015 | Change | ||
| million | million | % | thousand | thousand | % | ||
| Total | 9,772 | 9,844 | 0.7 | 112,499 | 118,059 | 4.9 | |
| Business of owner | |||||||
| Transport | 6,969 | 6,863 | -1.5 | 65,240 | 66,974 | 2.7 | |
| Other | 2,803 | 2,981 | 6.4 | 47,260 | 51,085 | 8.1 | |
| Main use of vehicle | |||||||
| Hire or reward | 7,616 | 7,510 | -1.4 | 74,448 | 75,740 | 1.7 | |
| Own account | 2,156 | 2,334 | 8.3 | 38,052 | 42,319 | 11.2 | |
| Journey | |||||||
| National | 7,674 | 7,707 | 0.4 | 106,214 | 111,191 | 4.7 | |
| International | 2,098 | 2,137 | 1.9 | 6,285 | 6,867 | 9.3 | |
| Main type of work | |||||||
| Import/export work | 2,350 | 2,335 | -0.6 | 11,808 | 11,860 | 0.4 | |
| Carriage of livestock | 118 | 116 | -1.7 | 1,302 | 1,375 | 5.6 | |
| Carriage of other farm produce from farms | 317 | 392 | 23.7 | 4,738 | 5,753 | 21.4 | |
| Carriage of fertilisers, feeding stuffs, etc. to farms | 461 | 404 | -12.4 | 6,530 | 6,126 | -6.2 | |
| Delivery of goods to road works or building sites | 975 | 965 | -1.0 | 31,121 | 32,556 | 4.6 | |
| Delivery of goods to retail outlets | 1,558 | 1,433 | -8.0 | 14,801 | 13,808 | -6.7 | |
| Delivery of goods to wholesalers | 1,063 | 1,154 | 8.6 | 8,789 | 10,029 | 14.1 | |
| Delivery of materials and fuels to factories | 986 | 1,129 | 14.5 | 10,949 | 13,129 | 19.9 | |
| Delivery of goods to households | 220 | 199 | -9.5 | 4,016 | 3,536 | -12.0 | |
| Other work | 1,725 | 1,716 | -0.5 | 18,445 | 19,888 | 7.8 | |
| Table 1 Transport activity classified by business of owner and main use of vehicle, 2015 | ||||||||
| Business of owner of vehicle | Tonne-km (million) | Tonnes carried (thousand) | ||||||
| Own account | Hire or reward | Total | Own account | Hire or reward | Total | |||
| Transport | 0 | 6,863 | 6,863 | 0 | 66,974 | 66,974 | ||
| Manufacturing industry | 723 | 0 | 723 | 18,120 | 0 | 18,120 | ||
| Mining & quarrying (incl. sand & gravel merchants) | 199 | 0 | 199 | 7,675 | 0 | 7,675 | ||
| Creameries & agricultural cooperative societies | 25 | 0 | 25 | 318 | 0 | 318 | ||
| Manufacture of food & feeding stuffs | 161 | 0 | 161 | 2,211 | 0 | 2,211 | ||
| Manufacture of drink & tobacco | 3 | 0 | 3 | 34 | 0 | 34 | ||
| Manufacture of glass, cement & clay products | 207 | 0 | 207 | 6,602 | 0 | 6,602 | ||
| Other manufacturing | 128 | 0 | 128 | 1,280 | 0 | 1,280 | ||
| Building & construction | 67 | 0 | 67 | 1,527 | 0 | 1,527 | ||
| Distribution | 1,144 | 503 | 1,647 | 15,541 | 7,179 | 22,720 | ||
| Agriculture & livestock dealing | 132 | 49 | 181 | 1,891 | 407 | 2,298 | ||
| Local authorities | 67 | 0 | 67 | 1,769 | 0 | 1,769 | ||
| Other | 200 | 96 | 295 | 3,470 | 1,180 | 4,650 | ||
| Total | 2,334 | 7,510 | 9,844 | 42,319 | 75,740 | 118,059 | ||
| Table 2 Transport activity classified by vehicle capacity, national/international journeys and main use of vehicle, 2015 | ||||||||||||||||||
| Type of journey and vehicle capacity | Tonne-km (million) | Tonnes carried (thousand) | ||||||||||||||||
| Own account | Hire or reward | Total | Own account | Hire or reward | Total | |||||||||||||
| National journeys | ||||||||||||||||||
| vehicle capacity (kg) | ||||||||||||||||||
| Up to 5,000 | 76 | 46 | 122 | 1,564 | 533 | 2,096 | ||||||||||||
| 5,001 - 10,000 | 82 | 75 | 157 | 1,839 | 1,010 | 2,850 | ||||||||||||
| 10,001 - 15,000 | 86 | 101 | 187 | 1,572 | 1,186 | 2,758 | ||||||||||||
| 15,001 - 20,000 | 310 | 248 | 558 | 7,064 | 4,824 | 11,888 | ||||||||||||
| 20,001 - 25,000 | 73 | 207 | 280 | 1,307 | 2,593 | 3,900 | ||||||||||||
| 25,001 - 35,000 | 868 | 2,396 | 3,263 | 19,188 | 33,681 | 52,869 | ||||||||||||
| Over 35,000 | 724 | 2,416 | 3,140 | 8,944 | 25,887 | 34,831 | ||||||||||||
| Total | 2,219 | 5,489 | 7,707 | 41,477 | 69,714 | 111,191 | ||||||||||||
| International journeys | ||||||||||||||||||
| vehicle capacity (kg) | ||||||||||||||||||
| Up to 5,000 | 2 | 1 | 3 | 14 | 5 | 19 | ||||||||||||
| 5,001 - 10,000 | 2 | 4 | 6 | 11 | 25 | 36 | ||||||||||||
| 10,001 - 15,000 | 2 | 17 | 19 | 30 | 52 | 82 | ||||||||||||
| 15,001 - 20,000 | 8 | 43 | 51 | 95 | 126 | 221 | ||||||||||||
| 20,001 - 25,000 | 7 | 123 | 130 | 12 | 224 | 236 | ||||||||||||
| 25,001 - 35,000 | 38 | 893 | 932 | 386 | 2,783 | 3,169 | ||||||||||||
| Over 35,000 | 56 | 941 | 996 | 295 | 2,811 | 3,106 | ||||||||||||
| Total | 115 | 2,022 | 2,137 | 842 | 6,025 | 6,867 | ||||||||||||
| All journeys | ||||||||||||||||||
| Vehicle capacity (kg) | ||||||||||||||||||
| Up to 5,000 | 78 | 47 | 125 | 1,577 | 538 | 2,115 | ||||||||||||
| 5,001 - 10,000 | 84 | 80 | 163 | 1,850 | 1,035 | 2,885 | ||||||||||||
| 10,001 - 15,000 | 88 | 118 | 206 | 1,602 | 1,238 | 2,840 | ||||||||||||
| 15,001 - 20,000 | 318 | 291 | 609 | 7,159 | 4,950 | 12,108 | ||||||||||||
| 20,001 - 25,000 | 80 | 330 | 410 | 1,319 | 2,817 | 4,136 | ||||||||||||
| 25,001 - 35,000 | 906 | 3,289 | 4,195 | 19,574 | 36,463 | 56,037 | ||||||||||||
| Over 35,000 | 780 | 3,356 | 4,136 | 9,239 | 28,698 | 37,937 | ||||||||||||
| Total | 2,334 | 7,510 | 9,844 | 42,319 | 75,740 | 118,059 | ||||||||||||
| Table 3 Transport activity classified by business of owner, unladen weight and main use of vehicle, 2015 | |||||||
| Business of owner and unladen weight of vehicle | Tonne-km (million) | Tonnes carried (thousand) | |||||
| Own account | Hire or reward | Total | Own account | Hire or reward | Total | ||
| Transport | |||||||
| Unladen weight (kg) | |||||||
| 2,000 - 5,000 | 0 | 66 | 66 | 0 | 769 | 769 | |
| 5,001 - 7,500 | 0 | 83 | 83 | 0 | 900 | 900 | |
| 7,501 - 10,000 | 0 | 307 | 307 | 0 | 3,598 | 3,598 | |
| 10,001 - 12,500 | 0 | 1,848 | 1,848 | 0 | 19,940 | 19,940 | |
| Over 12,500 | 0 | 4,559 | 4,559 | 0 | 41,766 | 41,766 | |
| Total | 0 | 6,863 | 6,863 | 0 | 66,974 | 66,974 | |
| Other businesses | |||||||
| Unladen weight (kg) | |||||||
| 2,000 - 5,000 | 160 | 49 | 208 | 3,378 | 594 | 3,972 | |
| 5,001 - 7,500 | 92 | 26 | 117 | 1,631 | 254 | 1,884 | |
| 7,501 - 10,000 | 217 | 41 | 258 | 3,787 | 472 | 4,259 | |
| 10,001 - 12,500 | 599 | 172 | 771 | 12,575 | 2,458 | 15,033 | |
| Over 12,500 | 1,266 | 360 | 1,626 | 20,948 | 4,989 | 25,936 | |
| Total | 2,334 | 647 | 2,981 | 42,319 | 8,766 | 51,085 | |
| All businesses | |||||||
| Unladen weight (kg) | |||||||
| 2,000 - 5,000 | 160 | 115 | 274 | 3,378 | 1,363 | 4,742 | |
| 5,001 - 7,500 | 92 | 108 | 200 | 1,631 | 1,153 | 2,784 | |
| 7,501 - 10,000 | 217 | 348 | 565 | 3,787 | 4,070 | 7,858 | |
| 10,001 - 12,500 | 599 | 2,020 | 2,619 | 12,575 | 22,398 | 34,973 | |
| Over 12,500 | 1,266 | 4,919 | 6,186 | 20,948 | 46,755 | 67,703 | |
| Total | 2,334 | 7,510 | 9,844 | 42,319 | 75,740 | 118,059 | |
| Table 4 Transport activity classified by region of origin1 and main use of vehicle, 2015 | |||||||
| Region of origin | Tonne-km (million) | Tonnes carried (thousand) | |||||
| Own account | Hire or reward | Total | Own account | Hire or reward | Total | ||
| Border | 228 | 683 | 911 | 4,423 | 6,956 | 11,379 | |
| Midland | 174 | 324 | 498 | 2,985 | 3,658 | 6,644 | |
| West | 250 | 407 | 658 | 4,423 | 4,477 | 8,900 | |
| Dublin | 432 | 1,875 | 2,307 | 8,090 | 22,025 | 30,115 | |
| Mid-East | 287 | 514 | 801 | 6,000 | 6,754 | 12,754 | |
| Mid-West | 201 | 511 | 712 | 3,896 | 5,759 | 9,655 | |
| South-East | 310 | 932 | 1,242 | 5,786 | 10,334 | 16,120 | |
| South-West | 403 | 1,027 | 1,429 | 6,336 | 12,229 | 18,565 | |
| Other | 50 | 1,236 | 1,286 | 380 | 3,547 | 3,927 | |
| Total | 2,334 | 7,510 | 9,844 | 42,319 | 75,740 | 118,059 | |
| 1 See Appendix A | |||||||
| Table 5 Transport activity classified by business of owner, length of haul and main use of vehicle, 2015 | |||||||
| Business of owner of vehicle and length of haul | Tonne-km (million) | Tonnes carried (thousand) | |||||
| Own account | Hire or reward | Total | Own account | Hire or reward | Total | ||
| Transport | |||||||
| Length of haul (km) | |||||||
| Up to 10 | 0 | 43 | 43 | 0 | 6,833 | 6,833 | |
| 11-25 | 0 | 194 | 194 | 0 | 11,062 | 11,062 | |
| 26-50 | 0 | 471 | 471 | 0 | 12,860 | 12,860 | |
| 51-150 | 0 | 1,867 | 1,867 | 0 | 20,853 | 20,853 | |
| 151-500 | 0 | 3,097 | 3,097 | 0 | 14,050 | 14,050 | |
| Over 500 | 0 | 1,192 | 1,192 | 0 | 1,316 | 1,316 | |
| Total | 0 | 6,863 | 6,863 | 0 | 66,974 | 66,974 | |
| Other businesses | |||||||
| Length of haul (km) | |||||||
| Up to 10 | 45 | 7 | 53 | 6,716 | 1,200 | 7,916 | |
| 11-25 | 184 | 35 | 218 | 10,562 | 1,910 | 12,471 | |
| 26-50 | 317 | 54 | 371 | 9,146 | 1,570 | 10,716 | |
| 51-150 | 855 | 248 | 1,103 | 10,982 | 2,865 | 13,847 | |
| 151-500 | 894 | 231 | 1,125 | 4,853 | 1,128 | 5,981 | |
| Over 500 | 39 | 72 | 111 | 61 | 93 | 154 | |
| Total | 2,334 | 647 | 2,981 | 42,319 | 8,766 | 51,085 | |
| All businesses | |||||||
| Length of haul (km) | |||||||
| Up to 10 | 45 | 51 | 96 | 6,716 | 8,032 | 14,748 | |
| 11-25 | 184 | 228 | 412 | 10,562 | 12,972 | 23,533 | |
| 26-50 | 317 | 525 | 842 | 9,146 | 14,430 | 23,576 | |
| 51-150 | 855 | 2,115 | 2,971 | 10,982 | 23,718 | 34,700 | |
| 151-500 | 894 | 3,328 | 4,221 | 4,853 | 15,178 | 20,031 | |
| Over 500 | 39 | 1,264 | 1,303 | 61 | 1,410 | 1,470 | |
| Total | 2,334 | 7,510 | 9,844 | 42,319 | 75,740 | 118,059 | |
| Table 6 Transport activity classified by main type of work and main use of vehicle, 2015 | |||||||
| Main type of work done by vehicle | Tonne-km (million) | Tonnes carried (thousand) | |||||
| Own account | Hire or reward | Total | Own account | Hire or reward | Total | ||
| Import/export work1 | 55 | 2,280 | 2,335 | 397 | 11,463 | 11,860 | |
| Carriage of livestock | 41 | 75 | 116 | 599 | 776 | 1,375 | |
| Carriage of other farm produce from farms | 119 | 273 | 392 | 1,790 | 3,963 | 5,753 | |
| Carriage of fertilisers, feeding stuffs etc. to farms | 106 | 299 | 404 | 1,872 | 4,254 | 6,126 | |
| Delivery of goods to road works or building sites | 451 | 514 | 965 | 16,460 | 16,096 | 32,556 | |
| Delivery of goods to retail outlets | 433 | 1,000 | 1,433 | 4,977 | 8,831 | 13,808 | |
| Delivery of goods to wholesalers | 230 | 925 | 1,154 | 2,191 | 7,838 | 10,029 | |
| Delivery of materials and fuels to factories | 175 | 954 | 1,129 | 2,716 | 10,413 | 13,129 | |
| Delivery of goods to households | 148 | 51 | 199 | 2,932 | 604 | 3,536 | |
| Other work | 576 | 1,140 | 1,716 | 8,387 | 11,501 | 19,888 | |
| Total | 2,334 | 7,510 | 9,844 | 42,319 | 75,740 | 118,059 | |
| 1Includes work done to and from ports as well as roll-on/roll-off and cross-border work | |||||||
| Table 7 Transport activity classified by national/international journeys and main use of vehicle, 2015 | ||||||||
| Type of journey | Tonne-km (million) | Tonnes carried (thousand) | ||||||
| Own account | Hire or reward | Total | Own account | Hire or reward | Total | |||
| National journeys | 2,219 | 5,489 | 7,707 | 41,477 | 69,714 | 111,191 | ||
| International journeys | 115 | 2,022 | 2,137 | 842 | 6,025 | 6,867 | ||
| Goods loaded in Ireland | 65 | 785 | 851 | 462 | 2,478 | 2,941 | ||
| Goods unloaded in Ireland | 34 | 653 | 687 | 312 | 2,021 | 2,333 | ||
| Cross trade | 13 | 534 | 548 | 40 | 967 | 1,007 | ||
| Cabotage | 2 | 49 | 51 | 28 | 559 | 587 | ||
| Total journeys | 2,334 | 7,510 | 9,844 | 42,319 | 75,740 | 118,059 | ||
| Table 8 Transport activity classified by group of goods and national/international journeys, 2015 | |||||||
| Group of goods (NST 2007) | Tonne-km (million) | Tonnes carried (thousand) | |||||
| National | International | Total | National | International | Total | ||
| journeys | journeys | journeys | journeys | ||||
| Products of agriculture, forestry & fishing | 951 | 218 | 1,169 | 12,479 | 804 | 13,283 | |
| Coal & natural gas | 52 | 25 | 77 | 590 | 162 | 752 | |
| Quarry products, metal ores & peat | 866 | 60 | 926 | 26,471 | 578 | 27,049 | |
| Foodstuffs | 1,889 | 833 | 2,722 | 20,551 | 2,100 | 22,651 | |
| Textiles & leather | 113 | 10 | 123 | 779 | 37 | 816 | |
| Wood, pulp & paper | 422 | 58 | 480 | 4,038 | 352 | 4,390 | |
| Coke & refined petroleum products | 802 | 55 | 857 | 10,281 | 409 | 10,690 | |
| Chemicals & plastics | 311 | 130 | 441 | 3,623 | 312 | 3,935 | |
| Other non-metallic mineral products | 593 | 80 | 673 | 14,917 | 433 | 15,350 | |
| Metal products (exc. machinery & equipment) | 140 | 70 | 209 | 1,441 | 284 | 1,725 | |
| Machinery & equipment | 132 | 67 | 199 | 1,443 | 137 | 1,579 | |
| Furniture & other manufactured goods | 86 | 29 | 114 | 850 | 87 | 937 | |
| Secondary raw materials & waste | 288 | 2 | 290 | 4,264 | 19 | 4,283 | |
| Other goods | 1,063 | 501 | 1,564 | 9,463 | 1,154 | 10,618 | |
| Total | 7,707 | 2,137 | 9,844 | 111,191 | 6,867 | 118,059 | |
| Table 9 Transport activity classified by group of goods and main use of vehicle, 2015 | |||||||
| Group of goods (NST 2007) | Tonne-km (million) | Tonnes carried (thousand) | |||||
| Own | Hire or | Total | Own | Hire or | Total | ||
| account | reward | account | reward | ||||
| Products of agriculture, forestry & fishing | 294 | 875 | 1,169 | 3,842 | 9,441 | 13,283 | |
| Coal & natural gas | 32 | 44 | 77 | 446 | 305 | 752 | |
| Quarry products, metal ores & peat | 397 | 529 | 926 | 13,204 | 13,845 | 27,049 | |
| Foodstuffs | 492 | 2,230 | 2,722 | 5,714 | 16,937 | 22,651 | |
| Textiles & leather | 31 | 91 | 123 | 304 | 513 | 816 | |
| Wood, pulp & paper | 49 | 431 | 480 | 561 | 3,830 | 4,390 | |
| Coke & refined petroleum products | 357 | 500 | 857 | 4,614 | 6,076 | 10,690 | |
| Chemicals & plastics | 46 | 395 | 441 | 564 | 3,371 | 3,935 | |
| Other non-metallic mineral products | 246 | 427 | 673 | 7,615 | 7,735 | 15,350 | |
| Metal products (exc. machinery & equipment) | 42 | 168 | 209 | 432 | 1,292 | 1,725 | |
| Machinery & equipment | 51 | 148 | 199 | 671 | 909 | 1,579 | |
| Furniture & other manufactured goods | 36 | 78 | 114 | 392 | 546 | 937 | |
| Secondary raw materials & waste | 149 | 141 | 290 | 2,423 | 1,860 | 4,283 | |
| Other goods | 111 | 1,453 | 1,564 | 1,537 | 9,081 | 10,618 | |
| Total | 2,334 | 7,510 | 9,844 | 42,319 | 75,740 | 118,059 | |
| Table 10 Average number of vehicles classified by unladen weight and year of manufacture of vehicle, 2015 | ||||||
| Year of manufacture of vehicle | Unladen weight (kg) | Total | ||||
| 2,000 - | 5,001 - | 7,501 - | 10,001 - | Over | ||
| 5,000 | 7,500 | 10,000 | 12,500 | 12,500 | ||
| 2015 | 2,636 | 97 | 124 | 230 | 510 | 3,597 |
| 2014 | 4,536 | 100 | 181 | 245 | 697 | 5,759 |
| 2013 | 3,094 | 117 | 175 | 237 | 703 | 4,326 |
| 2012 | 2,509 | 92 | 103 | 189 | 614 | 3,507 |
| 2011 | 3,002 | 69 | 90 | 237 | 582 | 3,980 |
| 2010 | 2,646 | 85 | 148 | 194 | 322 | 3,394 |
| 2009 | 2,065 | 192 | 192 | 229 | 440 | 3,118 |
| 2008 | 5,937 | 435 | 416 | 662 | 1,139 | 8,589 |
| 2007 | 7,799 | 387 | 493 | 789 | 1,221 | 10,688 |
| 2006 | 6,586 | 531 | 688 | 1,051 | 1,226 | 10,082 |
| 2005 or before | 19,020 | 2,764 | 2,511 | 3,145 | 2,614 | 30,053 |
| Total | 59,829 | 4,869 | 5,121 | 7,208 | 10,067 | 87,094 |
| Table 11 Transport activity classified by year of manufacture and main use of vehicle, 2015 | |||||||
| Year of manufacture of vehicle | Tonne-km (million) | Tonnes carried (thousand) | |||||
| Own account | Hire or reward | Total | Own account | Hire or reward | Total | ||
| 2015 | 136 | 565 | 701 | 1,983 | 4,066 | 6,049 | |
| 2014 | 208 | 618 | 825 | 2,469 | 4,562 | 7,030 | |
| 2013 | 190 | 605 | 794 | 2,198 | 4,151 | 6,350 | |
| 2012 | 97 | 717 | 815 | 1,051 | 4,981 | 6,032 | |
| 2011 | 148 | 515 | 664 | 1,776 | 4,636 | 6,413 | |
| 2010 | 71 | 332 | 403 | 819 | 2,654 | 3,473 | |
| 2009 | 106 | 362 | 468 | 1,723 | 3,004 | 4,727 | |
| 2008 | 243 | 684 | 927 | 3,884 | 7,306 | 11,191 | |
| 2007 | 296 | 662 | 958 | 6,586 | 7,710 | 14,296 | |
| 2006 | 276 | 932 | 1,208 | 6,692 | 11,189 | 17,881 | |
| 2005 or before | 564 | 1,517 | 2,081 | 13,138 | 21,480 | 34,617 | |
| Total | 2,334 | 7,510 | 9,844 | 42,319 | 75,740 | 118,059 | |
| Table 12 Transport activity classified by body type and main use of vehicle, 2015 | ||||||||||||
| Type of vehicle and body type | Tonne-km (million) | Tonnes carried (thousand) | ||||||||||
| Own account | Hire or reward | Total | Own account | Hire or reward | Total | |||||||
| Articulated | ||||||||||||
| Platform or sided | 80 | 695 | 775 | 754 | 6,418 | 7,172 | ||||||
| Tipper | 193 | 686 | 879 | 4,801 | 11,205 | 16,006 | ||||||
| Tanker or other bulk carrier | 348 | 999 | 1,348 | 4,449 | 12,280 | 16,729 | ||||||
| Insulated or refrigerated box | 229 | 1,450 | 1,679 | 1,674 | 6,387 | 8,061 | ||||||
| Box or van body | 140 | 631 | 771 | 1,247 | 3,845 | 5,092 | ||||||
| Livestock carrier | 23 | 76 | 99 | 279 | 442 | 720 | ||||||
| Other | 271 | 2,131 | 2,402 | 3,593 | 17,005 | 20,598 | ||||||
| Total | 1,285 | 6,667 | 7,952 | 16,797 | 57,582 | 74,379 | ||||||
| Rigid/Rigid with trailer | ||||||||||||
| Platform or sided | 95 | 89 | 184 | 1,912 | 1,666 | 3,578 | ||||||
| Tipper | 279 | 220 | 498 | 10,616 | 9,282 | 19,899 | ||||||
| Tanker or other bulk carrier | 237 | 36 | 273 | 4,197 | 673 | 4,871 | ||||||
| Insulated or refrigerated box | 84 | 56 | 140 | 1,255 | 564 | 1,819 | ||||||
| Box or van body | 131 | 179 | 311 | 1,812 | 1,810 | 3,622 | ||||||
| Livestock carrier | 23 | 39 | 62 | 361 | 411 | 772 | ||||||
| Other | 200 | 225 | 424 | 5,369 | 3,751 | 9,119 | ||||||
| Total | 1,049 | 843 | 1,892 | 25,522 | 18,157 | 43,680 | ||||||
| All vehicles | ||||||||||||
| Platform or sided | 175 | 784 | 959 | 2,666 | 8,084 | 10,750 | ||||||
| Tipper | 472 | 905 | 1,377 | 15,417 | 20,488 | 35,905 | ||||||
| Tanker or other bulk carrier | 585 | 1,035 | 1,620 | 8,646 | 12,954 | 21,600 | ||||||
| Insulated or refrigerated box | 313 | 1,506 | 1,819 | 2,928 | 6,951 | 9,880 | ||||||
| Box or van body | 271 | 810 | 1,081 | 3,060 | 5,655 | 8,715 | ||||||
| Livestock carrier | 46 | 115 | 161 | 640 | 852 | 1,492 | ||||||
| Other | 471 | 2,355 | 2,826 | 8,962 | 20,755 | 29,717 | ||||||
| Total | 2,334 | 7,510 | 9,844 | 42,319 | 75,740 | 118,059 | ||||||
| Table 13 Transport activity classified by national/international journeys, axle configuration and main use of vehicle, 2015 | |||||||
| Type of journey and axle configuration | Tonne-km (million) | Tonnes carried (thousand) | |||||
| Own account | Hire or reward | Total | Own account | Hire or reward | Total | ||
| National journeys | |||||||
| Rigid | |||||||
| 2 axle | 316 | 253 | 569 | 5,930 | 2,993 | 8,923 | |
| 3 axle | 299 | 100 | 399 | 5,740 | 1,995 | 7,735 | |
| Other rigid | 371 | 357 | 729 | 12,956 | 12,036 | 24,993 | |
| Rigid + trailer | 38 | 76 | 114 | 634 | 900 | 1,534 | |
| Articulated | |||||||
| 3 axle | 10 | 39 | 49 | 193 | 316 | 509 | |
| 4 axle | 144 | 231 | 376 | 3,102 | 3,936 | 7,039 | |
| 5 axle | 486 | 1,654 | 2,139 | 5,370 | 16,270 | 21,639 | |
| Other articulated | 554 | 2,778 | 3,333 | 7,551 | 31,268 | 38,819 | |
| Total | 2,219 | 5,489 | 7,707 | 41,477 | 69,714 | 111,191 | |
| International journeys | |||||||
| Rigid | |||||||
| 2 axle | 8 | 15 | 23 | 71 | 61 | 132 | |
| 3 axle | 9 | 4 | 13 | 80 | 15 | 94 | |
| Other rigid | 5 | 10 | 16 | 98 | 55 | 153 | |
| Rigid + trailer | 3 | 27 | 29 | 13 | 103 | 116 | |
| Articulated | |||||||
| 3 axle | 2 | 5 | 7 | 15 | 26 | 40 | |
| 4 axle | 6 | 40 | 46 | 96 | 201 | 298 | |
| 5 axle | 29 | 949 | 978 | 93 | 1,959 | 2,052 | |
| Other articulated | 53 | 971 | 1,024 | 377 | 3,606 | 3,982 | |
| Total | 115 | 2,022 | 2,137 | 842 | 6,025 | 6,867 | |
| All journeys | |||||||
| Rigid | |||||||
| 2 axle | 324 | 268 | 593 | 6,001 | 3,054 | 9,055 | |
| 3 axle | 307 | 104 | 411 | 5,819 | 2,010 | 7,829 | |
| Other rigid | 377 | 368 | 744 | 13,054 | 12,091 | 25,145 | |
| Rigid + trailer | 41 | 103 | 143 | 647 | 1,003 | 1,650 | |
| Articulated | |||||||
| 3 axle | 12 | 44 | 56 | 208 | 342 | 550 | |
| 4 axle | 150 | 272 | 422 | 3,199 | 4,138 | 7,336 | |
| 5 axle | 515 | 2,603 | 3,118 | 5,462 | 18,229 | 23,691 | |
| Other articulated | 608 | 3,749 | 4,357 | 7,928 | 34,874 | 42,802 | |
| Total | 2,334 | 7,510 | 9,844 | 42,319 | 75,740 | 118,059 | |
| Table 14 Transport activity classified by region of origin and region of destination, 2015 | |||||||||||
| Region of origin1 | Region of destination1 | Total | |||||||||
| Border | Midland | West | Dublin | Mid-East | Mid-West | South-East | South-West | Northern | Other | ||
| Ireland | countries | ||||||||||
| Tonne-km (million) | |||||||||||
| Border | 282 | 41 | 55 | 155 | 63 | 23 | 58 | 41 | 22 | 171 | 911 |
| Midland | 51 | 123 | 50 | 82 | 46 | 23 | 44 | 54 | 7 | 17 | 498 |
| West | 65 | 41 | 253 | 90 | 23 | 52 | 48 | 28 | 4 | 53 | 658 |
| Dublin | 223 | 148 | 204 | 481 | 237 | 150 | 231 | 394 | 53 | 185 | 2,307 |
| Mid-East | 106 | 42 | 43 | 167 | 192 | 32 | 84 | 65 | 11 | 59 | 801 |
| Mid-West | 28 | 45 | 63 | 96 | 28 | 231 | 52 | 126 | 5 | 37 | 712 |
| South-East | 42 | 48 | 27 | 172 | 103 | 75 | 450 | 159 | 31 | 135 | 1,242 |
| South-West | 15 | 41 | 41 | 195 | 72 | 150 | 236 | 620 | 2 | 59 | 1,429 |
| Northern Ireland | 25 | 5 | 4 | 18 | 6 | 2 | 16 | 2 | 14 | 8 | 99 |
| Other countries | 80 | 12 | 27 | 253 | 38 | 11 | 119 | 70 | 18 | 559 | 1,187 |
| Total | 918 | 545 | 767 | 1,710 | 808 | 749 | 1,338 | 1,559 | 167 | 1,283 | 9,844 |
| Tonnes Carried (thousand) | |||||||||||
| Border | 7,036 | 412 | 443 | 1,318 | 642 | 89 | 319 | 136 | 269 | 716 | 11,379 |
| Midland | 656 | 2,919 | 502 | 840 | 638 | 246 | 466 | 272 | 44 | 61 | 6,644 |
| West | 653 | 478 | 6,303 | 442 | 125 | 404 | 238 | 142 | 23 | 92 | 8,900 |
| Dublin | 1,839 | 1,372 | 983 | 15,766 | 5,287 | 720 | 1,624 | 1,560 | 320 | 643 | 30,115 |
| Mid-East | 1,251 | 632 | 241 | 3,957 | 5,121 | 200 | 839 | 281 | 67 | 164 | 12,754 |
| Mid-West | 136 | 396 | 447 | 508 | 174 | 5,716 | 637 | 1,566 | 17 | 58 | 9,655 |
| South-East | 186 | 431 | 145 | 1,202 | 1,190 | 816 | 10,426 | 1,325 | 134 | 266 | 16,120 |
| South-West | 47 | 223 | 208 | 793 | 319 | 1,402 | 1,945 | 13,561 | 4 | 62 | 18,565 |
| Northern Ireland | 460 | 24 | 27 | 114 | 26 | 5 | 62 | 4 | 140 | 11 | 874 |
| Other countries | 526 | 48 | 82 | 532 | 93 | 13 | 210 | 107 | 22 | 1,421 | 3,053 |
| Total | 12,790 | 6,936 | 9,381 | 25,473 | 13,614 | 9,610 | 16,765 | 18,955 | 1,040 | 3,494 | 118,059 |
| 1See Appendix A | |||||||||||
| Table 15 Transport activity classified by country of origin and country of destination, 2015 | ||||||||||
| Country of origin | Country of destination | Total | ||||||||
| France | Germany | Ireland | Italy | Netherlands | Spain | United Kingdom | Other EU | Other countries1 | ||
| Tonne-km (million) | ||||||||||
| France | 11 | 2 | 52 | 18 | 1 | 10 | 45 | 3 | 0 | 141 |
| Germany | 0 | 6 | 61 | 0 | 4 | 0 | 39 | 7 | 0 | 117 |
| Ireland | 75 | 57 | 7,707 | 62 | 49 | 26 | 505 | 57 | 19 | 8,558 |
| Italy | 12 | 0 | 53 | 4 | 0 | 0 | 12 | 2 | 0 | 83 |
| Netherlands | 0 | 3 | 72 | 0 | 1 | 0 | 8 | 2 | 0 | 86 |
| Spain | 0 | 0 | 29 | 0 | 0 | 4 | 10 | 0 | 0 | 43 |
| United Kingdom | 19 | 11 | 380 | 9 | 10 | 3 | 209 | 32 | 0 | 673 |
| Other EU | 10 | 8 | 29 | 1 | 4 | 4 | 49 | 16 | 7 | 128 |
| Other countries1 | 0 | 0 | 10 | 0 | 0 | 0 | 6 | 0 | 0 | 16 |
| Total | 127 | 86 | 8,394 | 93 | 69 | 46 | 882 | 119 | 27 | 9,844 |
| Tonnes carried (thousand) | ||||||||||
| France | 22 | 2 | 52 | 24 | 3 | 13 | 69 | 7 | 0 | 192 |
| Germany | 0 | 13 | 48 | 0 | 8 | 0 | 40 | 12 | 0 | 121 |
| Ireland | 90 | 46 | 111,191 | 40 | 48 | 14 | 2,644 | 44 | 15 | 114,132 |
| Italy | 13 | 0 | 32 | 19 | 0 | 0 | 8 | 1 | 0 | 73 |
| Netherlands | 2 | 6 | 84 | 0 | 12 | 0 | 13 | 2 | 0 | 118 |
| Spain | 0 | 0 | 18 | 0 | 0 | 4 | 4 | 0 | 0 | 26 |
| United Kingdom | 37 | 12 | 2,062 | 7 | 14 | 2 | 1,086 | 28 | 0 | 3,248 |
| Other EU | 11 | 14 | 29 | 1 | 4 | 3 | 43 | 25 | 4 | 134 |
| Other countries1 | 0 | 0 | 7 | 0 | 0 | 0 | 4 | 0 | 2 | 13 |
| Total | 174 | 94 | 113,524 | 90 | 89 | 35 | 3,912 | 118 | 21 | 118,059 |
| 1Includes any country which is not a member state of the EU | ||||||||||
This report contains the results of the "National Survey of Transport of Goods by Road" which is conducted on a weekly basis throughout the year.
This is a statutory survey conducted under the Statistics (Road Freight) Order, 2012 (SI No 583 of 2012) to meet Ireland’s EU requirements under Council Regulation (EC) 70/2012 on statistical returns in respect of the carriage of goods by road.
This report covers the survey period beginning the first week of January 2015 and ending the last week of December 2015. Irish registered vehicles that come within the scope of the survey must meet the following criteria:
No other vehicles are covered. In particular this means that vehicles in other motor taxation classes such as agricultural tractors, general haulage tractors, dumpers and exempt vehicles (i.e. vehicles exempt from liability to pay road tax which includes state owned, diplomatic, fire services or disabled drivers) are not included in the survey.
All activity of goods vehicles within the scope of the survey engaged in the carriage of goods on the public road, either on own account or for hire or reward, are covered. Excluded, therefore, is activity such as site work off the public road or work of a mainly service nature (e.g. carriage of personnel to or from places of work).
The sampling frame for the Survey comes from the Department of Transport, Tourism and Sport’s database on vehicles taxed as goods vehicles.
The sampling frame/register is updated every eight weeks during the year with information from the Department regarding vehicles:
The information required of each vehicle on the register for survey purposes is as follows:
a) year of manufacture of the vehicle
b) date of first registration of the vehicle
c) an indication as to whether the vehicle has been taxed for the carriage of goods on own account or for hire or reward
d) the unladen weight of the vehicle
e) name and address of the person on whose name the vehicle was most recently taxed (referred to as the owner of the vehicle in the following paragraphs).
The results are published on an annual basis.
Information is collected in respect of one week’s transport activity for a random sample of goods vehicles. Every week a sample of vehicles is selected from the register. A survey questionnaire is then issued to the registered owners of these vehicles by post, seeking information on the vehicle and an account of the vehicle’s activity during that week. For the purposes of sample selection, vehicles are divided into 20 strata. These strata were created on the basis of four criteria:
See Table L
Response Rates
Out of a total of 28,855 vehicles surveyed, a satisfactory return was received in respect of 15,380 vehicles, representing an overall response rate of 53.3%. However, this rate varied across the differing survey strata. Response rates broken down by the unladen weight and the year of manufacture of vehicle are presented in Table M.
See Table M
In 2007, the standard goods classification for transport statistics, NST/R, was revised by the United Nations Economic Commission for Europe (UNECE). A new version, NST 2007, was introduced to be consistent with the revised NACE (Statistical Classification of Economic Activities in the European Community). This new goods classification came into force in 2008.
Accordingly, the goods commodities collected in the “National Survey of Transport of Goods by Road” have been revised in line with this new goods classification, effective from 2009 onwards. Unfortunately, this revision means that the results by commodity in this publication for 2015 are not directly comparable with 2008 or previous years.
Estimation of survey results from data relating to only one week’s activity for a sample of vehicles introduces a statistical variability which would not be present if a full year’s data had been collected for every vehicle. This means that the survey results cannot be taken as accurate to the full degree shown in this report.
This variability is expressed by means of the coefficient of variation. This coefficient gives the relative size of the “sampling error” (variability) present in an estimate compared with the estimate itself. In general, estimates can be said to have a relative precision of twice their coefficient of variation. The estimated coefficients of variation for the overall tonnes carried, tonne-kilometres and vehicle kilometres estimates are shown in Table N below.
In general, the more detailed the classification provided the greater the coefficient of variation of the estimates. In the derivation of the results the assumption is made that non-respondents have similar characteristics and activity levels to those of respondents in the same stratification cell. This assumption, which is a standard one in surveys such as this, may result in some degree of bias being introduced into the results. Moreover, although every effort is made to ensure that the returns received are correct in all respects it is inevitable that some minor non-sampling errors remain undetected.
The totals in the tables may not always add up due to rounding.
See Table N
Two basic categories of journey are distinguished – split delivery/collection journeys and end-to-end journeys.
End-to-end journeys are those which have no intermediate collection or delivery points between their origin and destination.
Split delivery/collection journeys involve the depositing and/or collection of part of the load carried at one or more stopping points along the way. A common example of such a journey would be the delivery of beer to public houses and the collection of empties.
Tonnes Carried
This is the weight of goods (including empties) carried inclusive of packaging etc. but excluding the weight of demountable containers (if any) in which the goods are carried.
For split delivery/collection journeys tonnes carried are taken as the weight of goods at the start of the journey plus the weight of any other goods collected during the journey.
Tonne-Kilometres (tonne-km)
For end-to-end journeys this is the result of multiplying the weight of goods carried by the distance they were carried.
For split delivery/collection journeys more complex formulae were used. These involved multiplying the distance travelled with a load by an estimate of the average weight of load carried.
National Transport
National transport is the carriage of goods by road by Irish registered goods vehicles between two places (a place of loading/embarkment and a place of unloading/disembarkment) both of which are located in the Republic of Ireland.
NUTS2 and NUTS3 Regions
The regional classifications in this release are based on the NUTS (Nomenclature of Territorial Units) classification used by Eurostat. The NUTS3 regions correspond to the eight Regional Authorities established under the Local Government Act, 1991 (Regional Authorities) (Establishment) Order, 1993, which came into operation on 1 January 1994. The NUTS2 regions, which were proposed by Government and agreed by Eurostat in 1999, are groupings of the NUTS3 regions. The composition of the regions is set out below.
Border: Cavan, Donegal, Leitrim, Louth, Monaghan and Sligo.
Midland: Laois, Longford, Offaly, and Westmeath.
West: Galway City and County, Mayo and Roscommon.
Dublin: Dublin City, Dun Laoghaire-Rathdown, Fingal, and South Dublin.
Mid-East: Kildare, Meath and Wicklow.
Mid-West: Limerick City and County, Clare and North Tipperary.
South-East: Waterford City and County, Carlow, Kilkenny, South Tipperary and Wexford.
South-West: Cork City and County and County of Kerry.
See Appendix B below.
 Hide Background Notes
| Table L: Sampling proportions by age and unladen weight of vehicle, 2015 | ||||
| Year of manufacture | Unladen weight | Total | ||
| 2 - 5 tonnes | 5 - 10 tonnes | 10 tonnes | ||
| and over | ||||
| Sampling proportion % | ||||
| Before 2007 | 8 | 55 | 93 | 33 |
| 2007 - 2010 | 15 | 76 | 85 | 34 |
| After 2010 | 18 | 64 | 79 | 32 |
| Total | 13 | 61 | 87 | 33 |
| Table M: Response rates by age and unladen weight of vehicle, 2015 | |||||||||||
| Year of manufacture | Unladen weight | Total | |||||||||
| 2 - 5 tonnes | 5 - 10 tonnes | 10 tonnes and over | |||||||||
| Forms | % | Forms | % | Forms | % | Forms | % | ||||
| issued | Response | issued | Response | issued | Response | issued | Response | ||||
| Before 2007 | 2,102 | 65.9 | 3,578 | 55.4 | 7,506 | 46.0 | 13,186 | 51.7 | |||
| 2007 - 2010 | 2,777 | 66.1 | 1,786 | 54.4 | 4,240 | 45.4 | 8,803 | 53.7 | |||
| After 2010 | 2,795 | 64.1 | 739 | 53.9 | 3,332 | 49.2 | 6,866 | 55.8 | |||
| Total | 7,674 | 65.3 | 6,103 | 54.9 | 15,078 | 46.5 | 28,855 | 53.3 | |||
| Table N: Accuracy indicators for road freight activity, 2015 | ||||||||
| Unladen weight (tonnes) | Tonne-km | Tonnes carried | Vehicle kilometres | |||||
| Survey | Coefficient | Survey | Coefficient | Survey | Coefficient | |||
| estimate | of variation | estimate | of variation | estimate | of variation | |||
| million | % | thousand | % | million | % | |||
| 2 - 5 | 274 | 10.1 | 4,742 | 8.0 | 332 | 2.4 | ||
| 5 - 7.5 | 200 | 4.9 | 2,784 | 3.8 | 67 | 2.1 | ||
| 7.5 - 10 | 565 | 4.0 | 7,858 | 3.9 | 111 | 1.8 | ||
| 10 - 12.5 | 2,619 | 2.0 | 34,973 | 2.3 | 270 | 1.1 | ||
| Over 12.5 | 6,186 | 1.4 | 67,703 | 1.5 | 522 | 0.8 | ||
| Total | 9,844 | 1.1 | 118,059 | 1.1 | 1,302 | 0.8 | ||
| Appendix B: Goods vehicle category types | |||
| Code | Body type | Goods vehicle population1 2015 | |
| All | Survey scope | ||
| 2 | Station wagon/jeep | 882 | 0 |
| 3 | Minibus | 9 | 0 |
| 5 | Bus | 18 | 0 |
| 6 | Van | 33,895 | 33,895 |
| 7 | Open lorry & container | 161 | 161 |
| 8 | Open lorry only | 1,113 | 1,113 |
| 13 | Travelling machine/workshop | 36 | 0 |
| 14 | Mobile shop | 89 | 0 |
| 15 | Hoist/crane | 19 | 0 |
| 22 | Low loader | 28 | 28 |
| 23 | Tanker | 407 | 407 |
| 24 | Concrete mixer/concrete pump | 191 | 191 |
| 25 | Horse box/animal transporter | 1,109 | 1,109 |
| 26 | Dumper | 1 | 1 |
| 30 | Refuse collector | 620 | 620 |
| 31 | Gritter/chip spreader | 1 | 0 |
| 37 | Other | 2,980 | 2,980 |
| 40 | Hatchback | 4 | 0 |
| 48 | Pick up | 692 | 692 |
| 49 | Motor caravan | 0 | 0 |
| 50 | Van with side windows | 59 | 59 |
| 51 | Other light goods | 52 | 52 |
| 52 | Box van | 2,506 | 2,506 |
| 53 | Luton van | 387 | 387 |
| 54 | Insulated/refrigerated van | 981 | 981 |
| 55 | Glass carrier | 9 | 9 |
| 56 | Other van | 15 | 15 |
| 58 | Drop-side lorry | 691 | 691 |
| 59 | Hopper truck | 1 | 1 |
| 60 | Recovery vehicle | 148 | 0 |
| 61 | Solid bulk carrier | 14 | 14 |
| 63 | Car transporter | 58 | 58 |
| 64 | Other goods heavy | 3,314 | 3,314 |
| 69 | Road maintenance vehicle | 7 | 0 |
| 70 | Road tar sprayer | 2 | 0 |
| 71 | Road marking machine | 1 | 0 |
| 75 | Articulated tractor unit | 11,638 | 11,638 |
| 76 | Jeep | 14,149 | 0 |
| 77 | Estate | 2,148 | 0 |
| 78 | Liftback | 1 | 0 |
| 81 | Rigid | 3,607 | 3,607 |
| 82 | Crew cab | 12,347 | 12,347 |
| 85 | Well driller/drilling machine | 1 | 0 |
| 86 | Curtain sider | 1,235 | 1,235 |
| 87 | Tipper | 2,415 | 2,415 |
| 88 | Skip loader | 243 | 243 |
| 89 | Telescopic handler | 2 | 0 |
| 90 | Drain cleaner | 5 | 0 |
| 91 | Security van/truck | 88 | 88 |
| 92 | MPV | 33 | 0 |
| 95 | Chassis cab | 6,240 | 6,240 |
| Total | 104,649 | 87,094 | |
| 1 This annual population estimate is an average of four quarterly population estimates. Vehicles under two tonnes unladen weight or with motor tax expired for more than 3 months are not included in these estimates. | |||
Scan the QR code below to view this release online or go to
http://www.cso.ie/en/releasesandpublications/ep/p-rfts/roadfreighttransportsurvey2015/
 Show Table A: Key road freight statistics, 2004-2015
 Hide Table A: Key road freight statistics, 2004-2015