
| 2008 | 2009 | 20102 | 2011 | 2012 | 2013 | 2014 | 2015 | 2016 | 2017 | 2018 | |
| Administrative Burden, actual compliance (Response Burden Barometer)1 | 147.0 | 136.0 | 144.4 | 98.0 | 90.7 | 100.0 | 91.9 | 92.4 | 90.3 | 87.2 | 86.3 |
| 1 Base Year updated to year 2013 from year 2005 | |||||||||||
| 2 2010 figures reflect the decennial Census of Agriculture | |||||||||||
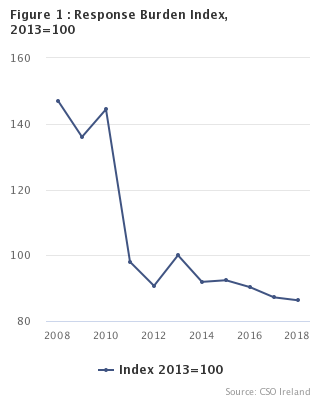
The Response Burden Barometer (RBB) for 2018 continued in the relatively stable pattern that has been evident in the last five years, dropping slightly from the previous record low recorded in 2017.
The RBB is a measure of the total administrative burden placed on Irish enterprises and agricultural holdings by Central Statistics Office (CSO) surveys when calculated on an actual compliance basis1.
Changes to the burden include natural fluctuation with enterprises entering and leaving the survey population over the course of the year, and variation in response expected. As some surveys such as the Farm Structure Survey (every 2 to 3 years) and the Census of Agriculture (every ten years), don't take place every year, care needs to be taken when comparing the RBB from one year to that of the previous year. Improved data and development of methodologies also contribute to variation within the RBB.
There was a 1% decrease in burden between 2017 and 2018. The cost to business of this burden was €3.96 million in 2018, down by €38,600 from 2017. See Tables 1 & 2.
The latest estimate is that there are 488,600 active business enterprises (including the latest Farm Population figure) in Ireland. In the course of the 2018 surveys to these enterprises, the CSO issued 294,600 surveys forms, or an average of 0.60 survey forms per enterprise. There were 198,200 forms returned as partially or wholly completed, representing an average of 0.41 forms per enterprise. See Table 2.
If burden is measured on the basis of partially or fully completed survey forms actually returned to the CSO (i.e., if burden is based on actual compliance), then the total number of hours spent by business in 2018 was 225,900, or 27.7 minutes per business. The administrative cost2, measured on 2013 prices, of actual compliance was €6.6 million, or €13.44 per enterprise. The administrative burden (i.e. administrative costs less business-as-usual costs), was €3.96 million, or €8.11 per enterprise. See Table 2 & Methodology.
If all survey forms issued by the CSO were partially or wholly completed and returned (i.e., if there had been full compliance), then the total number of hours spent on this task by enterprises in Ireland in 2018 would have been 266,300, or an average of 32.7 minutes per enterprise. The administrative cost of full compliance would have been €8.2 million, or €16.80 per enterprise. The corresponding administrative burden would have been €5.0 million, or €10.13 per enterprise. See Table 2 & Methodology.
The most burdensome survey in 2018 was the Trade Intrastat Imports survey, which is conducted jointly with Revenue, issued 45,600 forms, of which 43,500 were returned partially or wholly completed. The full compliance administrative costs of completing all Trade Intrastat Imports forms in 2018 were €2.5 million, while the actual compliance administrative costs were €2.4 million.
Of the purely CSO surveys, the most burdensome was the Balance of Payments survey, with a cost of €620,000 for the returns made in 2018. See Statbank Tables.
1Actual compliance basis: calculated on a time and cost basis of fully or partially completed returns to the CSO. This is the preferred method of the European Statistical System for calculating the Response Burden Barometer level.
2The hourly administrative cost figure used in the calculations for non-Trade surveys was €44.00 (based on 2013 figures). For Trade surveys, the administrative cost figure was based on their 2013 Response Burden Survey. The administrative burden of CSO Surveys was 60.32% of the administrative costs figure. Please see Methodology for further details.
| Table 1 Total Administrative Burden, actual compliance (Response Burden Barometer) Index, 2013 = 100 | |||||||||||
| All Surveys | 2008 | 2009 | 2010¹ | 2011 | 2012 | 2013 | 2014 | 2015 | 2016 | 2017 | 2018 |
| Forms Issued | 122.5 | 119.2 | 141.0 | 93.3 | 86.8 | 100.0 | 86.1 | 91.9 | 103.8 | 88.3 | 83.7 |
| Forms Returned | 124.0 | 118.7 | 146.8 | 94.0 | 87.0 | 100.0 | 87.3 | 88.8 | 101.6 | 86.0 | 81.3 |
| Time, full compliance (forms issued) - hours | 150.5 | 137.1 | 140.6 | 99.1 | 91.1 | 100.0 | 96.9 | 101.6 | 96.4 | 99.1 | 98.2 |
| Time, actual compliance (forms returned) - hours | 139.9 | 130.6 | 136.8 | 98.7 | 92.0 | 100.0 | 99.4 | 101.4 | 102.3 | 104.7 | 105.9 |
| Administrative Burden, full compliance | 158.1 | 142.5 | 147.3 | 98.0 | 89.4 | 100.0 | 90.1 | 93.0 | 88.0 | 85.5 | 82.7 |
| Administrative Burden, actual compliance (Response Burden Barometer) | 147.0 | 136.0 | 144.4 | 98.0 | 90.7 | 100.0 | 91.9 | 92.4 | 90.3 | 87.2 | 86.3 |
| 1 2010 figures reflect the decennial Census of Agriculture | |||||||||||
| Table 2 Forms, Time taken to complete forms, Administrative Burden, All Surveys | ||||||||
| 2008 | 2013 | 2014 | 2015 | 2016 | 2017 | 2018 | ||
| Total number of active business enterprises (incl. agricultural holdings) | 431,400 | 451,700 | 450,700 | 450,700 | 461,300 | 460,800 | 488,600 | |
| Number of forms Issued | ||||||||
| All Surveys | 431,100 | 351,900 | 302,900 | 323,400 | 365,400 | 310,600 | 294,600 | |
| Average number of survey forms per business enterprise per year | 1.00 | 0.78 | 0.67 | 0.72 | 0.79 | 0.67 | 0.60 | |
| Number of forms Returned | ||||||||
| All Surveys | 302,000 | 243,600 | 212,600 | 216,400 | 247,600 | 209,500 | 198,200 | |
| Average number of survey forms per business enterprise per year | 0.70 | 0.54 | 0.47 | 0.48 | 0.54 | 0.45 | 0.41 | |
| Time, full compliance (forms issued), hours | ||||||||
| All Surveys | 408,000 | 271,100 | 262,800 | 275,500 | 261,400 | 268,700 | 266,300 | |
| Average number of minutes per business enterprise per year | 56.7 | 36.0 | 35.0 | 36.7 | 34.0 | 35.0 | 32.7 | |
| Time, actual compliance (forms returned), hours | ||||||||
| All Surveys | 298,400 | 213,300 | 211,900 | 216,300 | 218,100 | 223,200 | 225,900 | |
| Average number of minutes per business enterprise per year | 41.5 | 28.3 | 28.2 | 28.8 | 28.4 | 29.1 | 27.7 | |
| Administrative Costs, full compliance, 2013 prices | ||||||||
| All Surveys (€) | 15,686,500 | 9,919,200 | 8,938,500 | 9,222,100 | 8,726,900 | 8,481,300 | 8,207,600 | |
| Average administrative cost (€) per business enterprise per year | 36.36 | 21.96 | 19.83 | 20.46 | 18.92 | 18.41 | 16.80 | |
| Administrative Burden, full compliance, 2013 prices | ||||||||
| All Surveys (€) | 9,462,100 | 5,983,300 | 5,391,700 | 5,562,800 | 5,264,100 | 5,115,900 | 4,950,800 | |
| Average administrative burden (€) per business enterprise per year | 21.93 | 13.25 | 11.96 | 12.34 | 11.41 | 11.10 | 10.13 | |
| Administrative Costs, actual compliance, 2013 prices | ||||||||
| All Surveys (€) | 11,185,300 | 7,607,300 | 6,992,700 | 7,029,600 | 6,873,200 | 6,632,700 | 6,568,700 | |
| Average administrative cost (€) per business enterprise per year | 25.93 | 16.84 | 15.52 | 15.60 | 14.90 | 14.39 | 13.44 | |
| Administrative Burden, actual compliance, 2013 prices | ||||||||
| All Surveys (Response Burden Barometer) (€) | 6,747,000 | 4,588,800 | 4,218,000 | 4,240,300 | 4,145,900 | 4,000,800 | 3,962,200 | |
| Average administrative burden (€) per business enterprise per year | 15.64 | 10.16 | 9.36 | 9.41 | 8.99 | 8.68 | 8.11 | |
Minimising survey response burden
Notwithstanding the ever-growing international demand for statistics (from organisations such as the European Commission, the European Central Bank, the United Nations, the Organisation for Economic Co-operation and Development, etc.), minimising the administrative burden placed on CSO business respondents is, and has been for many years, a corporate priority of the CSO. (See the CSO’s Statement of Strategy 2019) The CSO has taken, and continues to take, a number of actions towards this end. Amongst these actions are:-
In the case of Ireland it should be noted that most, but not all, government statistical inquiries are conducted by the CSO, and that almost all CSO surveys are driven by EU legislation with limited scope for national interpretation during implementation. The above actions have been possible within the structures of the governing EU legislation.
 Hide Background Notes
Scan the QR code below to view this release online or go to
http://www.cso.ie/en/releasesandpublications/ep/p-rbb/responseburdenbarometer2018/
 Show Table 1 Response Burden Barometer Index, 2013 = 100
 Hide Table 1 Response Burden Barometer Index, 2013 = 100