
| 2005 | 2008 | 2012 | |
| Response Burden Barometer (Index, 2005 = 100) | 100 | 115.5 | 76.9 |
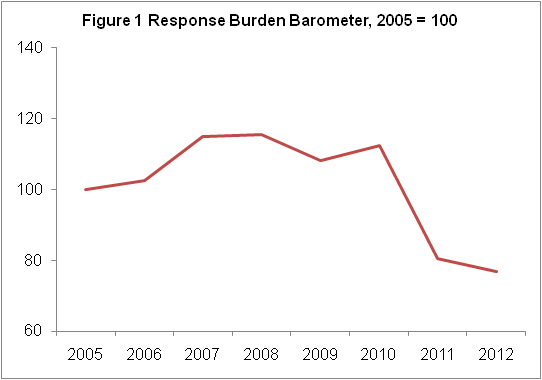
The Response Burden Barometer (RBB) to 2012 reduced by 23.1% since the reference year 2005, the year the CSO started measuring burden.
The Response Burden Barometer (RBB) is a measure of the total administrative burden placed on Irish businesses by Central Statistics Office (CSO) surveys when calculated on an actual compliance basis1.
When measured from 2008 the burden to 2012 has decreased by 33% (i.e., 76.9/115.5), exceeding the target reduction of 25% over this timeframe2. The cost to business of this burden was €5.8 million in 2012. See Tables 1 & 2.
It is estimated that there were 369,600 active business enterprises in Ireland in 2012. In the course of 2012, the CSO issued 325,400 surveys forms, or an average of 0.9 survey forms per enterprise. There were 227,400 forms returned as partially or wholly completed, representing an average of 0.6 forms per enterprise. See Table 2.
If burden is measured on the basis of partially or fully completed survey forms actually returned to the CSO (i.e., if burden is based on actual compliance), then the total number of hours spent by business in 2012 was 213,900, or 35 minutes per business. The administrative cost, measured on 2005 prices, of actual compliance was €9.6 million, or €26 per enterprise. The administrative burden of actual compliance in 2012 was €5.8 million, or €16 per business. See Measurement Methodology & Table 2.
If all survey forms issued by the CSO were partially or wholly completed and returned (i.e., if there had been full compliance), then the total number of hours spent on this task by businesses in Ireland in 2012 would have been 269,100, or an average of 44 minutes per business. The administrative cost of full compliance would have been €12.1 million, or €33 per enterprise, the lowest cost since the CSO starting measuring this burden. The administrative burden (i.e., administrative costs less business-as-usual costs) of full compliance would have been €7.3 million, or €20 per business. See Measurement Methodology & Table 2.
The most burdensome survey in 2012 was the Trade Intrastat Imports survey, which issued 77,100 forms, of which 66,800 were returned partially or wholly completed. The administrative costs of completing all Intrastat Imports forms in 2012 were €7.1 million.
Of the purely CSO surveys, the full compliance administrative costs of the Balance of Payment surveys were €844,500 in 2012, while the actual compliance administrative costs were €777,300.
1Actual compliance basis: calculated on a time and cost basis of fully or partially completed returns to the CSO - the preferred method of calculation of the European Statisticial System.
2In March 2008 the Government adopted a 25% target for the reduction of this burden by end of 2012. The EU wide target is also for a 25% reduction by 2012.
| Table 1 Response Burden Barometer Index, 2005 = 100 | ||||||||
| All Surveys | 2005 | 2006 | 2007 | 2008 | 2009 | 2010¹ | 2011 | 2012 |
| Forms Issued | 100 | 90 | 111.3 | 97.1 | 94.8 | 113 | 76.3 | 71.3 |
| Forms Returned | 100 | 93.2 | 110.2 | 97.3 | 93.5 | 114.5 | 74.1 | 69.7 |
| Time, full compliance (forms issued) - hours | 100 | 103.7 | 121.6 | 123.6 | 112.9 | 118.7 | 85.4 | 78.6 |
| Time, actual compliance (forms returned) - hours | 100 | 102.6 | 114.9 | 115.5 | 108.1 | 112.5 | 80.7 | 76.9 |
| Administrative Burden, full compliance | 100 | 103.7 | 121.6 | 123.6 | 112.9 | 118.7 | 85.4 | 78.6 |
| Administrative Burden, actual compliance (Response Burden Barometer) | 100 | 102.6 | 114.9 | 115.5 | 108.1 | 112.5 | 80.7 | 76.9 |
| 1 2010 figures reflect the decennial Census of Agriculture | ||||||||
| Table 2 Forms, Time taken to complete forms, Administrative Burden, All Surveys | ||||||
| 2005 | 20101 | 2011 | 2012 | |||
| Total number of active business enterprises | 362,100 | 363,200 | 369,600 | 369,600 | ||
| Number of forms Issued | ||||||
| All Surveys | 456,200 | 515,500 | 348,300 | 325,400 | ||
| Average number of survey forms per business enterprise per year | 1.26 | 1.42 | 0.94 | 0.88 | ||
| Number of forms Returned | ||||||
| All Surveys | 326,100 | 373,400 | 241,800 | 227,400 | ||
| Average number of survey forms per business enterprise per year | 0.90 | 1.03 | 0.65 | 0.62 | ||
| Time, full compliance (forms issued), hours | ||||||
| All Surveys | 342,100 | 406,100 | 292,300 | 269,100 | ||
| Average number of minutes per business enterprise per year | 56.7 | 67.1 | 47.5 | 43.7 | ||
| Time, actual compliance (forms returned), hours | ||||||
| All Surveys | 278,300 | 313,200 | 224,900 | 213,900 | ||
| Average number of minutes per business enterprise per year | 46.1 | 51.7 | 36.5 | 34.7 | ||
| Administrative Costs, full compliance, 2005 prices | ||||||
| All Surveys (€) | 15,338,000 | 18,207,300 | 13,103,500 | 12,063,200 | ||
| Average administrative cost (€) per business enterprise per year | 42.36 | 50.13 | 35.46 | 32.64 | ||
| Administrative Burden, full compliance, 2005 prices | ||||||
| All Surveys (€) | 9,251,900 | 10,982,600 | 7,904,100 | 7,276,500 | ||
| Average administrative burden (€) per business enterprise per year | 25.55 | 30.24 | 21.39 | 19.69 | ||
| Administrative Costs, actual compliance, 2005 prices | ||||||
| All Surveys (€) | 12,476,100 | 14,041,400 | 10,073,100 | 9,588,700 | ||
| Average administrative cost (€) per business enterprise per year | 34.46 | 38.66 | 27.26 | 25.95 | ||
| Administrative Burden, actual compliance, 2005 prices | ||||||
| All Surveys (Response Burden Barometer) (€) | 7,525,600 | 8,469,800 | 6,076,100 | 5,783,900 | ||
| Average administrative burden (€) per business enterprise per year | 20.79 | 23.32 | 16.44 | 15.65 | ||
| 1 2010 figures reflect the decennial Census of Agriculture | ||||||
Minimising survey response burden
Notwithstanding the ever-growing international demand for statistics (from organisations such as the European Commission, the European Central Bank, the United Nations, the Organisation for Economic Co-operation and Development, etc.), minimising the administrative burden placed on CSO business respondents is, and has been for many years, a corporate priority of the CSO. (See the CSO’s Statement of Strategy 2012-20141) The CSO has taken, and continues to take, a number of actions towards this end. Amongst these actions are:-
In the case of Ireland it should be noted that most, but not all, government statistical inquiries are conducted by the CSO, and that all CSO surveys are driven by EU legislation with limited scope for national interpretation during implementation. The above actions have been possible within the structures of the governing EU legislation.
 Hide Background Notes
Scan the QR code below to view this release online or go to
http://www.cso.ie/en/releasesandpublications/ep/p-rbb/responseburdenbarometer2012/
 Show Table 1 Response Burden Barometer Index, 2005 = 100
 Hide Table 1 Response Burden Barometer Index, 2005 = 100