
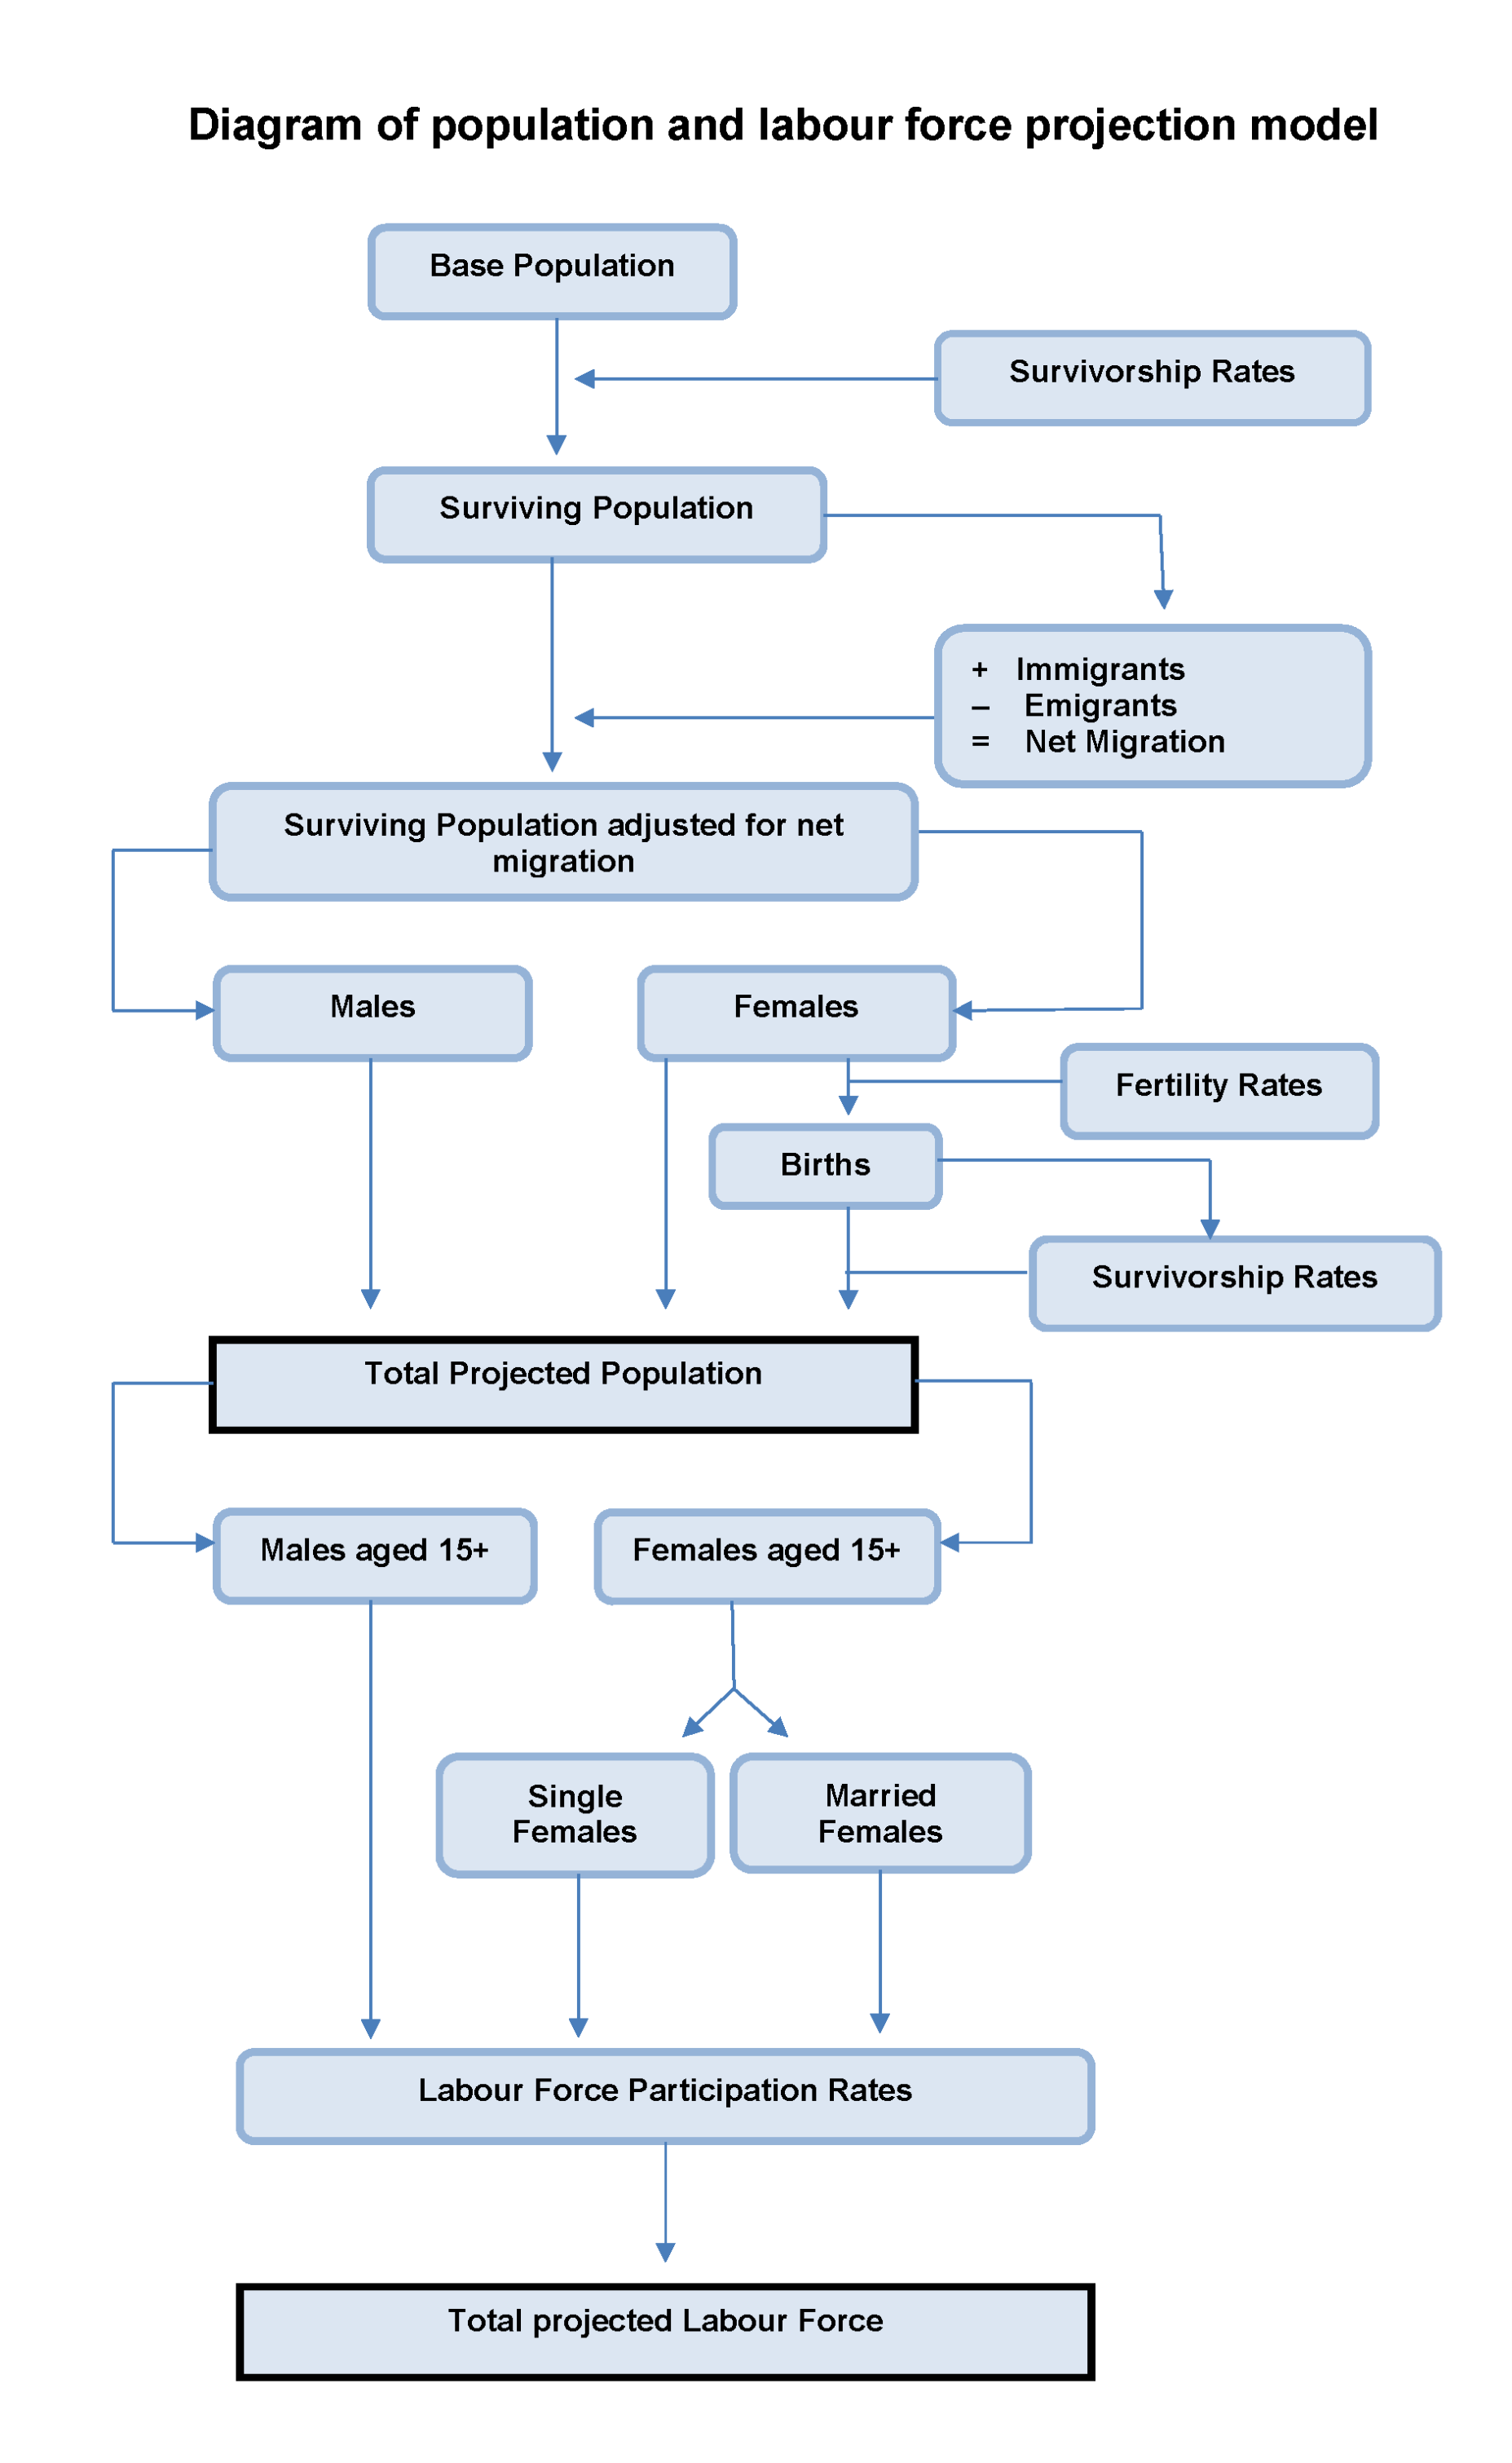
The model used is the demographic component method which projects the 2016 usually resident (base) population forward under the chosen assumptions governing births, deaths and net migration. This is illustrated graphically in the flow chart diagram below.
Population projections methodology
After the usually resident based population is aged a year, the appropriate survivorship ratios (see Appendix 2) are applied, accounting for mortality and giving the surviving population. The gross inward and outward migration rates which these groups are assumed to experience in the year are applied to the population. The assumed fertility rates are applied to the female population aged 15 - 49 to give the number of births in the year (adjusted downward for infant mortality) to give the total projected population for that year. This population then becomes the base population for the following year and the process continues from 2017 to 2051.
The assumed outward and inward migration flows are broken down by age and sex on the basis of the distributions estimated for the inter-censal period 2011 - 2016. This yields the surviving population adjusted for net migration but without an estimate of the number of children born in the year. The age specific fertility rates for the projection year are applied to the projected female population to estimate the projected births. These births are then divided into males and females on the basis of the ratios experienced for recent years. The appropriate survivorship ratios are then applied to male and female births before these are added in to yield the total projected population.
Labour force projections methodology
The assumed labour force participation rates for males, single females and married females are applied to the projected population aged 15 years and over to give the projected labour force. These participation rates are based on age, the estimated proportion of women who are married at that particular age, the proportion of young people who are students and the estimated proportion of these young people who are in the labour force.
Learn about our data and confidentiality safeguards, and the steps we take to produce statistics that can be trusted by all.