Back to Top

 Skip navigation

Deprivation

Deprivation

Nearly one in seven people severely limited in usual activities went without heating at some stage in the past year

CSO statistical release, , 11am

Deprivation Items

14.1%
of people aged 16 years and over 'severely limited' in usual activities
went without heating at some stage in 2025
up from 12.7% in 2024 and down from 20.5% in 2023
Source: CSO Ireland, Poverty Indicators by Health Status - Survey on Income and Living Conditions (SILC) 2025

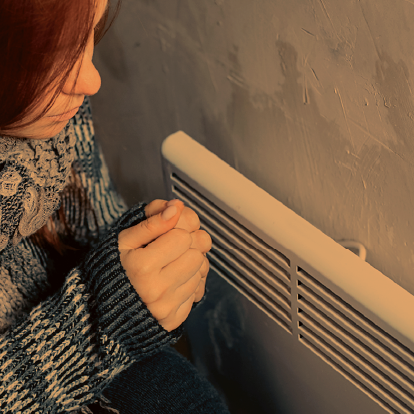
The Survey on Income and Living Conditions (SILC) identifies people living in enforced deprivation as those who cannot afford two of 11 basic deprivation indicators. See Survey on Income and Living Conditions Fact Sheet.

In 2025, the most common deprivation items (see At Risk of Poverty Indicators Explained (PDF 1,094KB) ) for people aged 16 years and older were; being unable to afford to replace worn out furniture (15.0%), unable to afford a morning, afternoon or evening out in the last fortnight (9.5%) and unable to afford to get together once a month with family or friends for a drink or a meal (9.2%). See figure 2.1 and table 2.1.

Figure 2.1 Types of Deprivation Experienced by Persons Aged 16 Years and Over, 2025
Table 2.1 Types of Deprivation Experienced by Persons Aged 16 Years and Over, and Year (% of Individuals)

Higher Deprivation Rates for People Severely Limited in Usual Activities

The Global Activity Limitation Indicator (GALI) measures long-standing health related activity limitations. The Editor’s Note in the Key Findings section of this report describes the questions used to derive the GALI status of survey respondents aged 16 years and older.

People ‘severely limited’ in usual activities for at least six months, had higher rates of deprivation for all of the 11 deprivation indicators compared with those ‘not limited’.

  • Home heating: 11.5% of those ‘severely limited’ could not afford to keep their home adequately warm compared with 3.2% of those ‘not limited’.
  • Clothing: 19.0% of those ‘severely limited’ could not afford new (not second-hand) clothes, nearly four times the rate of those ‘not limited’ at 4.9%.
  • Social participation: nearly one in five (19.4%) of those ‘severely limited’ could not afford to get together with family or friends once a month for a drink or a meal, compared with 7.1% of those ‘not limited’.
  • Food: 5.7% of those ‘severely limited’ could not afford a meal with meat, chicken, fish (or vegetarian equivalent) every second day, compared with 1.0% of those ‘not limited’ and over double the 2024 rate of 2.6% for those ‘severely limited’. See figure 2.2 and table 2.2.
Figure 2.2 Types of Deprivation Experienced by Persons Aged 16 Years and Over and GALI Status, 2025
Table 2.2 Types of Deprivation Experienced by Persons Aged 16 Years and Over and GALI Status, 2025 (% of Individuals)

Enforced Deprivation

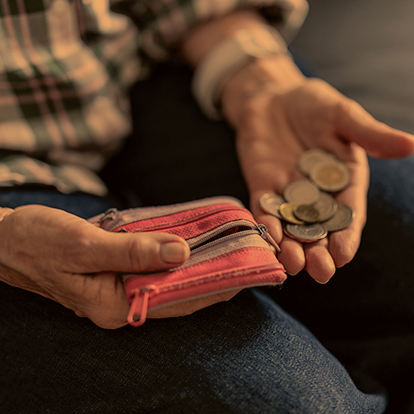
Enforced deprivation - households experiencing two or more of the 11 deprivation items of people aged 16 years and older decreased by 0.1 percentage point, from 14.1% in 2024 to 14.0% in 2025.

Over one in three people with severe limitations are living in enforced deprivation 

In 2025, the enforced deprivation rate for those ‘severely limited’ increased by over six percentages points to 34.3% in 2025 from 28.2% in 2024. The enforced deprivation rate for people who were ‘limited but not severely’ was 23.4% in 2025 (up from 20.1% in 2024) and for those ‘not limited’, the 2025 rate was 10.9%, down from 12.2% in 2024. See figure 2.3 and table 2.3.

34.3%
of people aged 16 years and over 'severely limited' in usual activities
experienced enforced deprivation in 2025
up from 28.2% in 2024 and 32.0% in 2023
Source: CSO Ireland, Poverty Indicators by Health Status - Survey on Income and Living Conditions (SILC) 2025
Figure 2.3 Enforced Deprivation Rate for Persons Aged 16 Years and Over by GALI Status and Year
Table 2.3 Enforced Deprivation Rate for Persons Aged 16 Years and Over by GALI Status and Year (% of Individuals)

As General Health Declines the Likelihood of Enforced Deprivation Increases

Survey respondents aged 16 years and over were asked two additional questions related to their health.

The first one related to self-perceived general health:

Q. How would you describe your health in general? Is it:

  1. Very Good
  2. Good
  3. Fair
  4. Bad
  5. Very bad

The second related to the presence of chronic morbidity:

Q. Do you have any long-standing illness or longstanding health problem? By long-standing I mean illnesses or health problems which have lasted, or are expected to last, for six months or more.

  1. Yes
  2. No

Analysis of enforced deprivation rates by self-perceived general health status shows that people with bad health have much higher rates of enforced deprivation when compared to those with good health. The enforced deprivation rate for those reporting ‘very bad’ health was 33.0%, over a five percentage point increase from 2024 (27.8%), and over four times the rate of those reporting ‘very good’ health (8.2%). See figure 2.4 and table 2.4.

Figure 2.4 Enforced Deprivation Rate for Persons Aged 16 Years and Over by Self-Perceived General Health Status and Year
Table 2.4 Enforced Deprivation Rate for Persons Aged 16 Years and Over by Self-Perceived General Health Status and Year (% of Individuals)

Higher Enforced Deprivation Rates for People with Chronic Illnesses

People with a self-reported chronic illness had an enforced deprivation rate twice that of those without a chronic illness (21.8% and 10.8% respectively). See figure 2.5 and table 2.5.

Figure 2.5 Enforced Deprivation Rate for Persons Aged 16 Years and Over by Self-reported Chronic Illness Status and Year
Table 2.5 Enforced Deprivation Rate for Persons Aged 16 Years and Over by Self-reported Chronic Illness Status and Year (% of Individuals)