
Gas consumption by power plants was 7.4% lower in 2021 when compared with 2020 mainly due to Whitegate being offline.
Total networked gas consumption in 2021 was 55,413 gigawatt hours, a decrease of 4.4% over 2020 consumption (see Table 1).
Gas consumption by the Industry & Commercial sector was 2.2% higher in 2021.
Power plants accounted for 61% of total networked gas consumption in 2021 compared with 25% by the non-residential sector, and 14% by the residential sector (see Table 1).
January to March accounted for 47% of networked gas consumption by households in 2021 (see Table 2D).
The median networked gas consumption was 10,056 kWh for all households in the State (see Table 5B).
| Table A Networked Gas Consumption by Sector 2012-2021 | ||||
| % of row | Gigawatt hours | |||
| Year | Power Plants | Non-Residential | Residential | Total |
| 2012 | 63 | 22 | 15 | 51,059 |
| 2013 | 61 | 24 | 16 | 48,981 |
| 2014 | 61 | 24 | 15 | 47,167 |
| 2015 | 60 | 25 | 15 | 47,503 |
| 2016 | 63 | 23 | 13 | 53,704 |
| 2017 | 64 | 23 | 13 | 54,726 |
| 2018 | 62 | 24 | 14 | 57,129 |
| 2019 | 63 | 24 | 13 | 57,744 |
| 2020 | 63 | 23 | 14 | 57,953 |
| 2021 | 61 | 25 | 14 | 55,413 |
| Power Plants | Non-Residential | Residential | |
| 2021 | 34.013 | 13.59 | 7.81 |
| X-axis label | Jan-Mar | Apr-Jun | Jul-Sep | Oct-Dec |
|---|---|---|---|---|
| 2012 | 4.363 | 2.556 | 0.596 | 2.537 |
| 2013 | 4.647 | 2.925 | 0.427 | 1.914 |
| 2014 | 4.454 | 1.961 | 0.416 | 1.804 |
| 2015 | 4.522 | 2.151 | 0.557 | 1.86 |
| 2016 | 3.989 | 2.416 | 0.415 | 2.001 |
| 2017 | 3.992 | 1.989 | 0.483 | 2.036 |
| 2018 | 4.658 | 2.444 | 0.367 | 2.305 |
| 2019 | 3.773 | 2.301 | 0.501 | 2.358 |
| 2020 | 4.308 | 2.012 | 0.675 | 2.415 |
| 2021 | 4.548 | 2.329 | 0.485 | 1.878 |
| X-axis label | Consumption |
|---|---|
| Dublin County | 10.974 |
| Cavan | 10.654 |
| Kildare | 10.606 |
| Meath | 10.462 |
| Dublin Postal Districts | 10.441 |
| Offaly | 10.058 |
| Carlow | 9.948 |
| Wicklow | 9.939 |
| Laois | 9.939 |
| Tipperary | 9.651 |
| Louth | 9.365 |
| Monaghan | 9.319 |
| Kilkenny | 9.29 |
| Westmeath | 9.242 |
| Limerick | 8.858 |
| Clare | 8.784 |
| Cork | 8.778 |
| Galway | 8.481 |
| Waterford | 8.377 |
| Mayo | 7.77 |
Learn about our data and confidentiality safeguards, and the steps we take to produce statistics that can be trusted by all.
Statistician's Comment
Commenting on the release Dympna Corry, Statistician in the Environment and Climate Division, said: "The amount of natural gas used by power plants to generate electricity was 7.4% lower in 2021. The decrease was due to a fault at the gas-fired Whitegate power station resulting in it being offline for most of 2021.
Gas consumption by the non-residential sector (excluding power plants) increased by 2.2% in 2021 (see Table 1). This was the second highest figure, after 2019, for the Industry & Commercial sector in the 2012-2021 time series.
Power plants accounted for 61% of total networked gas consumption in 2021 compared with 25% by the non-residential sector and 14% by the residential sector (see Table 1 and Figure 1). This pattern was broadly similar to previous years. Total consumption in 2021 was 55,413 gigawatt hours, a decrease of 4.4% from 2020 consumption levels.
Residential Consumption
There is a strong seasonal variation in networked gas consumption by households due to the use of natural gas for central heating. The January to March quarter has by far the highest consumption, at 47% of the annual total in 2021. In contrast, July to September accounted for only 7% of total residential consumption in 2021 (see Table 2D and Figure 2). Seasonal variation was less evident in other sectors, with the third quarter of 2021 accounting for 27% of total usage by power plants and for 20% of consumption in the non-residential sector (see Tables 2B and 2C).
Dublin postal districts accounted for 44% of total residential consumption in 2021, followed by Dublin county, at 17%, and Cork at 11%. Three counties (Donegal, Leitrim and Sligo) are not connected to the gas network (see Table 3B).
Dublin 15, with 382 GWh, had the highest residential consumption in 2021, followed by Dublin 24 with 239 GWh. The postal districts with the lowest residential consumption were Dublin 2 (29 GWh) and Dublin 1 (33 GWh) (see Table 4B).
Dublin 2 at 6,393 kWh, Dublin 1 at 6,789 kWh, and Dublin 8 at 8,017 kWh had the lowest residential median consumption figures in 2021. These areas were all well below the median consumption of 10,441 kWh for all households in the Dublin postal district areas. In contrast, Dublin 6W had the highest median consumption (12,630 kWh), followed by Dublin 6 (12,247 kWh) and Dublin 5 (12,196 kWh) (see Table 5C).
Figure 3 shows the annual median residential consumption at county level. Figures for Kerry, Longford, Roscommon and Wexford are based on low meter numbers (see Table 6B) and have been omitted from the graph. Of the other counties, Mayo had the lowest median consumption in 2021 at 7,770 kWh, while Dublin county had the highest median consumption at 10,974 kWh compared with the median consumption of 10,056 kWh for all households in the State (see Table 5B).
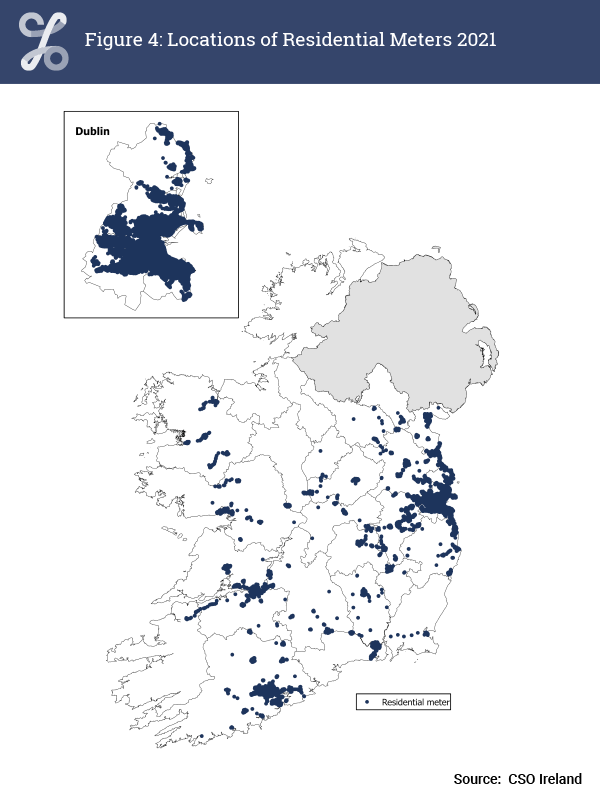
Dublin postal district areas accounted for 43% of both non-residential and residential meters in 2021. The number of non-residential meters increased by 7.6% from 27,065 in 2012 to 29,127 in 2021 (see Table 6A). The number of residential meters has increased by 8.5% from 636,928 in 2012 to 691,332 in 2021 (see Table 6B). Figure 4 shows the locations of residential meters in 2021. The residential meters are concentrated in large urban areas (Dublin postal districts, Dublin county, Cork, Kildare, Meath and Limerick)."