
| Table 1.1 Output, Intermediate Consumption and Gross Value Added, 2022-20241 | |||||
| € million | % change | ||||
| 2022 | 2023 | 2024 | 2023-2024 | ||
| Output | 1,007,801 | 1,020,302 | 1,127,871 | 10.5 | |
| Intermediate Consumption | 510,823 | 521,028 | 591,994 | 13.6 | |
| Gross Value Added | 496,978 | 499,274 | 535,877 | 7.3 | |
| 1Preliminary figures. Output and Gross Value Added at basic prices. Excludes statistical discrepancy. Excludes NACE 99. | |||||
This publication presents Gross Value Added (GVA), a measure of economic activity, for the years 1995 to 2024 as estimated using the Output method (also known as the Production approach). The Output method is one of three ways in which GVA and Gross Domestic Product (GDP) can be calculated. Data in this publication are consistent with the Output method estimates contained in the latest Annual National Accounts 2024 (ANA24) July 2025 publication. In addition to the Output method data, the ANA was produced using the Income method and the Expenditure method, the other two methods of estimating GVA and GDP.
This publication is part of an ongoing incremental process incorporating the Output method into the Irish National Accounts alongside the Income and Expenditure methods. The NACE Rev. 2 industry sectoral classification is used in this publication for 64 industry groups (A64), 21 industry groups (A21) or 10 industry groups (A10) as appropriate for both presentational and confidentiality purposes. The composition of the A64 group is displayed in Table 1.2 below. The composition of the A21 and A10 groups are described in the relevant tables and charts and in more detail in the Background Notes chapter of this publication.
In 2024, Output (the value of all goods and services produced) at basic prices for the total economy was €1.128 trillion. The Intermediate Consumption required to produce this Output totalled €592 billion. Output (€1.128 trillion) minus Intermediate Consumption (€592 billion) resulted in Gross Value Added at basic prices of €536 billion. The constituents of Output at basic prices in 2024 were:
The following treemaps illustrate the proportional composition of total Output, Intermediate Consumption and GVA by each A21 sector in 2024. Clicking on a treemap enlarges the image and offers options to look at the treemaps as a slideshow. They illustrate the large contribution to the total made by the Manufacturing (C) and Information & Communication (J) sectors in 2024 across all three items.
Figure 1.1 Proportional composition of Output, Intermediate Consumption and Gross Value Added by A21 sector, 2024
(click on the thumbnail images below to expand these treemaps and view as a slideshow)
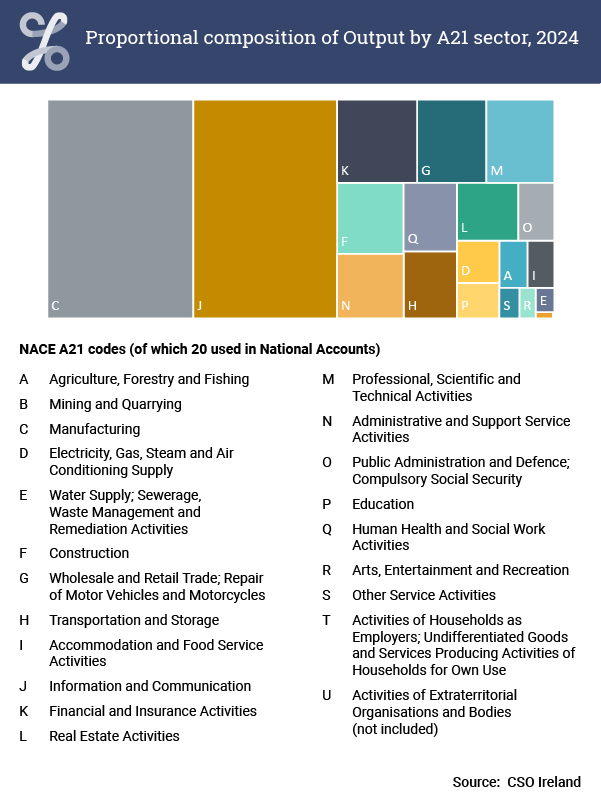
Proportional composition of Output by A21 sector, 2024
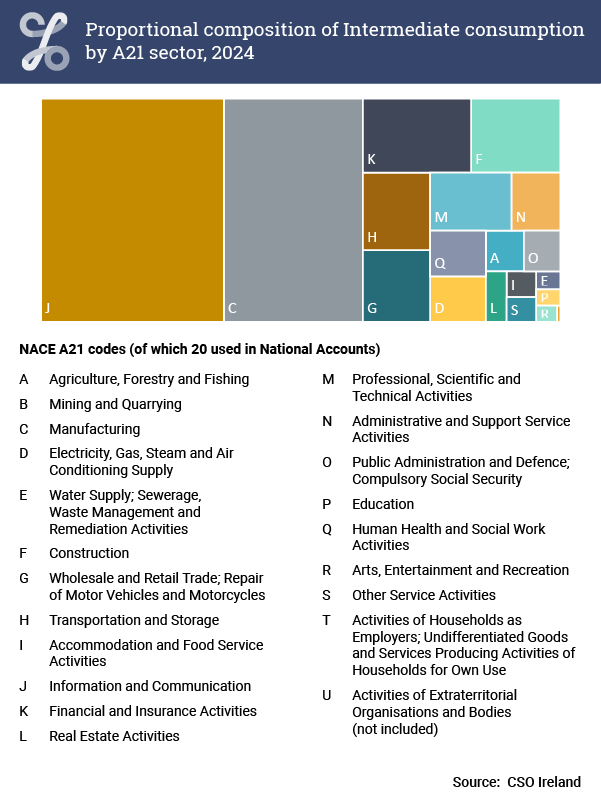
Proportional composition of Intermediate Consumption by A21 sector, 2024
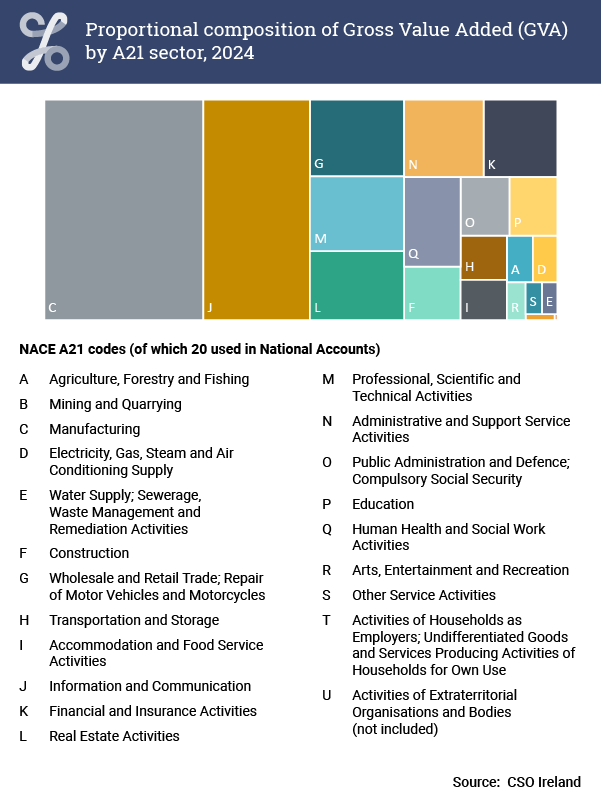
Proportional composition of Gross Value Added (GVA), by A21 sector, 2024
| Intermediate Consumption | Gross Value Added | |
| Construction | 33.7552010014037 | 14.311988058595 |
| Information and Communication | 208.360452966137 | 111.214921421495 |
| Agriculture, Forestry and Fishing | 7.93080281900931 | 5.74694189563441 |
| Financial and Insurance Activities | 40.849972684589 | 27.0817001482435 |
| Distribution, Transport, Hotels and Restaurants | 55.0486147530255 | 52.78012592856 |
| Arts, Entertainment and Other Services | 5.40567229377887 | 5.88751948188485 |
| Industry (excluding Construction) | 174.052755810563 | 174.970221774084 |
| Industry of which: Manufacturing | 158.680096355839 | 166.390093022985 |
| Professional, Admin and Support Services | 38.6083124755303 | 62.3957280444416 |
| Public Administration, Education and Health | 22.6109257471985 | 50.7204065401198 |
| Real Estate Activities | 5.37109037900386 | 30.7678313086389 |
| Total | 591.993800930239 | 535.877384601696 |
In the Output method of estimating GVA and GDP, Output minus Intermediate Consumption equals Gross Value Added. Rearranging this equation gives Output equals Intermediate Consumption plus Gross Value Added.
In 2024, total Output in the economy was almost equally split between Intermediate Consumption (52%) and Gross Value Added (48%). This was the tenth highest proportion of GVA among reporting EU Member States. However, there was variation across different sectors of the economy. For example, Construction (NACE 41-43), Information and Communication (NACE 58-63) and Agriculture, Forestry and Fishing (NACE 01-03) had the highest relative levels of Intermediate Consumption compared to Output. Service sectors such as Professional, Administration and Support Services (NACE 69-82), Public Administration, Education and Health (NACE 84-88) and Real Estate (NACE 68) had the highest relative levels of Value Added compared to Output. See Figures 1.2 and 1.3.
| X-axis label | Intermediate consumption | Gross Value Added |
|---|---|---|
| Malta | 63.299307815912 | 36.7005205114471 |
| Czechia | 58.523275265115 | 41.4767389015507 |
| Slovakia | 57.6842331355111 | 42.3157668644889 |
| Cyprus | 56.8223213911 | 43.1776786089 |
| Belgium | 56.5219495698153 | 43.4780504301847 |
| Estonia | 55.4504353329854 | 44.5496922745144 |
| Poland | 55.24333531273 | 44.7566646872699 |
| Hungary | 55.0854180360536 | 44.9145819639464 |
| Bulgaria | 54.2505185268233 | 45.7494314223251 |
| Italy | 54.2407484148499 | 45.7592515851501 |
| Finland | 53.9829791128091 | 46.0170208871909 |
| Sweden | 53.5628589862241 | 46.4371410137759 |
| Netherlands | 53.3533132114474 | 46.6466867885526 |
| Slovenia | 53.1594178334793 | 46.8405821665207 |
| Austria | 52.7548464654818 | 47.2451428828287 |
| Ireland | 52.4877131360389 | 47.5122868639611 |
| Germany | 52.124713958391 | 47.875286041609 |
| Latvia | 52.067684800905 | 47.9321789026775 |
| France | 51.5255762621419 | 48.4744237378581 |
| Denmark | 51.3034058051383 | 48.6965941948617 |
| Spain | 50.7044533478672 | 49.2955466521328 |
| Croatia | 50.6963645637885 | 49.3035662254016 |
| Greece | 50.3024169892521 | 49.697583010748 |
| Romania | 50.279285315085 | 49.720714684915 |
| Lithuania | 49.8261766232735 | 50.1738233767265 |
The Output method approach will continue to be integrated into the existing National Accounts compilation process. Pending the full incorporation and integration of the Income, Expenditure and Output approaches, detailed sectoral estimates using the Output method should be considered as exploratory and transitional, particularly for the latest two years (2023 and 2024). Data in this publication are expressed in both current prices and constant prices. The ANA statistical discrepancy is excluded and the data are consistent with the unadjusted Output method and Income method data by industry, as described in ANA24 Table 6.1 & Table 6.2.
Further details, including definitions and methodology, are provided in the Background Notes.
The entire Output method 1995-2024 time-series is provided in the CSO's PxStat database.
The primary data sources for these estimates are the CSO's Structure of Business Statistics (SBS) surveys. These SBS surveys cover both manufacturing and services sectors. Detailed questionnaires are sent to thousands of enterprises each year. The Census of Industrial Production (CIP) covers NACE 5-39, the Building and Construction Inquiry (BCI) covers NACE 41-43 and the Annual Services Inquiry (ASI) covers many codes between NACE 45-96. National Accounts are grateful to our colleagues in SBS for their assistance with these data.
Users should note that these Output method data are presented from a National Accounts compilation perspective.
In addition to the main 2024 table (Table 1.2) presented at A64 in this overview Introduction chapter, this publication is structured into data chapters each describing a distinct theme, covering the period 2014-2024. The three themes describing the Output method are:
In the Output method, GVA equals Output minus Intermediate Consumption.
A fourth theme, splitting the total Output, Intermediate Consumption and GVA into NACE sectors dominated by Foreign-owned Multinational Enterprise (MNE) dominated and Other sectors is also included.
Foreign-owned Multinational Enterprise (MNE) dominated sectors occur where MNE turnover on average exceeds 85% of the sector total. In this Output publication, these 'Foreign' owned MNE dominated sectors contain NACE 19, 20, 21, 26, 31-32, 58, 61 and 62-63.
A fifth theme, describing these Irish estimates in the context of other EU Member States is included. These reflect the data availability at the start of November 2025.
A sixth theme combines CSO National Accounts estimates of Output, Gross Value Added (GVA) and Modified GNI (GNI*) with CSO Environmental Accounts estimates of Greenhouse Gas (GHG) Air Emissions.
The effects on greenhouse gas emission intensities due to changes in the size and structure of the Irish economy are described. The latest 2023 estimates are used in this chapter.
In summary, if we know the value of activity (output) or the value added associated with this activity (GVA) and we then combine this with the GHG associated with this same activity, we can calculate the economic emissions intensity of this activity. For example in grams CO2 equivalent per euro of activity or value added.
The three themes describing the Output method have a general, repeated, structure.
The A10 table at constant market prices for 2014-2024 is chain linked annually and referenced to 2023. Users should note that these chain linked series are not additive except for 2023 and 2024. As with the current price data in this publication, these chain linked data are consistent with the relevant data in ANA24 published in July 2025.
Learn about our data and confidentiality safeguards, and the steps we take to produce statistics that can be trusted by all.