
Intermediate Consumption at market prices includes all goods and services used up in the production process in the accounting period, regardless of the date of purchase. For more information see the Background Notes.
When examined by A21 sector and similar to Output, the three largest sectors by Intermediate Consumption in 2020 were Manufacturing (C), Information & Communication (J) and Financial & Insurance activities (K). Construction (F), the third largest sector by Intermediate Consumption in 1995 increased to the second largest in 2005. Construction Intermediate Consumption then declined following 2005, but not as precipitously as Output, declining to fifth biggest by rank in 2010 where it remained in 2020. Agriculture, Forestry and Fishing (A) declined from the fifth biggest sector by Intermediate Consumption in 1995 to the twelfth biggest in 2005 where it remained in 2020.
Figure 3.1 Proportional composition of Intermediate Consumption by A21 sector, 1995-2020
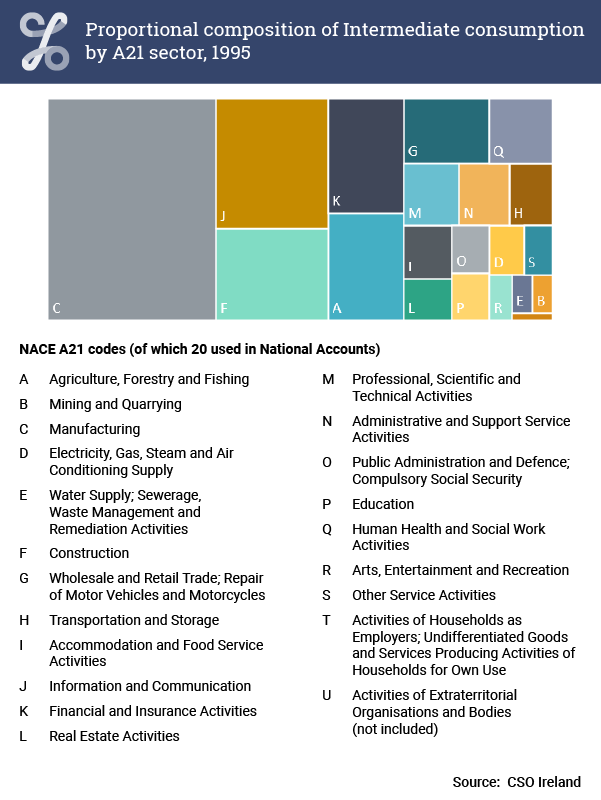
Proportional composition of Intermediate Consumption by A21 sector, 1995
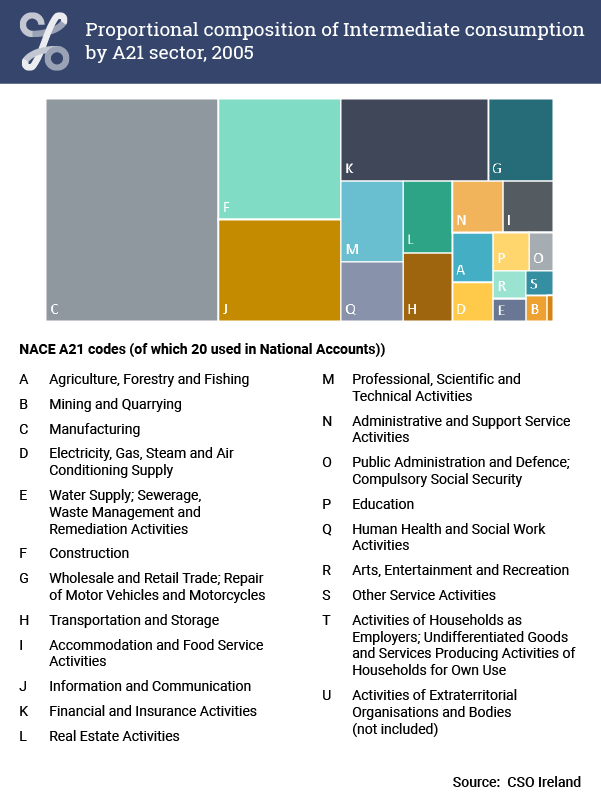
Proportional composition of Intermediate Consumption by A21 sector, 2005
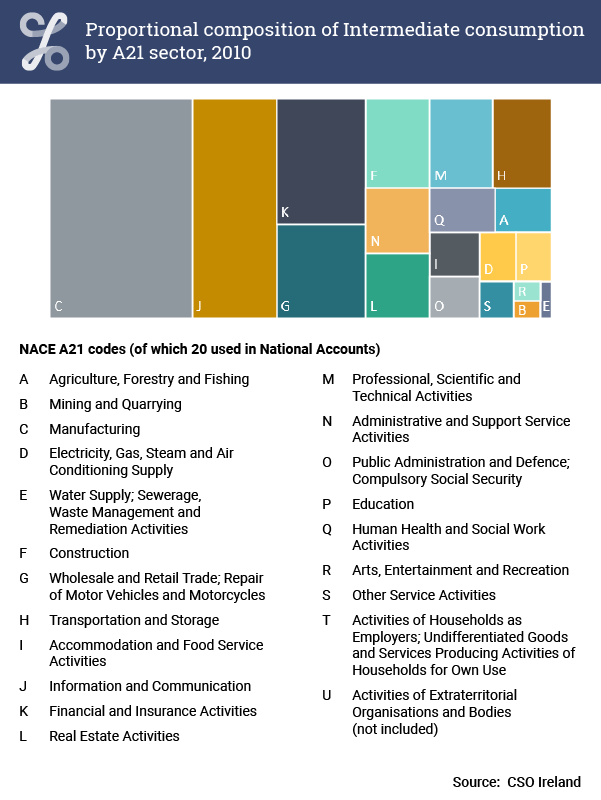
Proportional composition of Intermediate Consumption by A21 sector, 2010
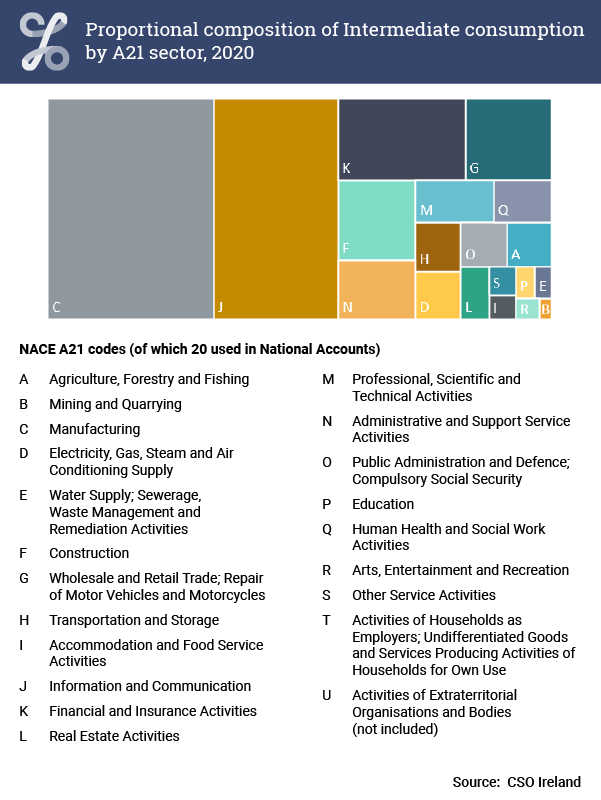
Proportional composition of Intermediate Consumption by A21 sector, 2020
| Manufacturing | Construction | Information and Communication | Other | |
| 1995 | 33.3659894898127 | 9.17191837239783 | 13.0334610887857 | 44.4286310490037 |
| 1996 | 33.6546802625222 | 9.2946184139694 | 13.4571071458816 | 43.5935941776268 |
| 1997 | 35.0330426807913 | 9.3645588417811 | 14.5206861216264 | 41.0817123558012 |
| 1998 | 36.3380514269365 | 9.63175159128712 | 13.8281859054639 | 40.2020110763125 |
| 1999 | 36.2955257078201 | 10.3723854898815 | 14.712797294751 | 38.6192915075474 |
| 2000 | 35.9499103699868 | 11.0945589897663 | 13.2985176696392 | 39.6570129706078 |
| 2001 | 38.581539117694 | 11.3153151376209 | 12.2229779787833 | 37.8801677659018 |
| 2002 | 37.0155040095178 | 11.5517040155478 | 11.6899660885415 | 39.7428258863929 |
| 2003 | 35.9078020498832 | 11.551984346058 | 11.5618566332761 | 40.9783569707827 |
| 2004 | 35.0772807647361 | 12.7202770164564 | 9.68116274449985 | 42.5212794743077 |
| 2005 | 34.0259187349593 | 13.0892756567077 | 11.0567328573486 | 41.8280727509844 |
| 2006 | 32.5788419757006 | 13.6452429626541 | 11.4569897675769 | 42.3189252940684 |
| 2007 | 30.5427058552496 | 13.8327273441718 | 10.5274312290688 | 45.0971355715099 |
| 2008 | 28.8203439923925 | 11.8797023338137 | 11.9719318022725 | 47.3280218715212 |
| 2009 | 31.6739339121226 | 5.70618647209884 | 13.6849704477556 | 48.9349091680229 |
| 2010 | 28.4137373766362 | 5.15751803746069 | 16.7996157300886 | 49.6291288558145 |
| 2011 | 32.8438672075978 | 4.66078474545615 | 16.944168812662 | 45.551179234284 |
| 2012 | 31.535938818868 | 2.2268610906994 | 21.1242357524873 | 45.1129643379452 |
| 2013 | 30.5075411278196 | 2.56350092875234 | 23.845836488023 | 43.0831214554051 |
| 2014 | 32.9121410169966 | 3.76222919555338 | 24.3174729811306 | 39.0081568063194 |
| 2015 | 36.721706472352 | 3.6702150144352 | 22.8350138581842 | 36.7730646550286 |
| 2016 | 35.9612867947492 | 4.6980076447654 | 19.2438922613249 | 40.0968132991605 |
| 2017 | 33.337770821925 | 5.60951574643857 | 20.507461636724 | 40.5452517949124 |
| 2018 | 32.4179673816818 | 5.94096504185268 | 22.8981592208114 | 38.7429083556542 |
| 2019 | 32.3348005011122 | 6.06751926043711 | 21.3991278110455 | 40.1985524274052 |
| 2020 | 32.9262023828612 | 5.57124949244015 | 24.7169896978849 | 36.7855584268138 |
In the above figure, a version of which is repeated across the Output method chapters, the 1995-2020 time-series of notable sectors of the economy are displayed. To allow for greater comparability over time the percentage contribution made by each to the total is displayed.
Similarly to Output, Manufacturing (C) was the biggest single A21 sector of the economy when measured by Intermediate Consumption over the entire 1995-2020 period. Information and Communication (J) was the second biggest sector in 2020. These two sectors dominated and combined they comprised 58% of total Intermediate Consumption across the economy in 2020, which was an increase from 46% in 1995.
Construction (F) which had less Intermediate Consumption than Information and Communication in 1995, increased more than Information and Communication up to 2007, but had Intermediate Consumption which was less than a quarter of Information and Communication in 2020.
The Other category in the figure above is total Output less Manufacturing, Information and Communication and Construction. Sector figures can be found in the tables above and in the full 1995-2020 time series available in the CSO's PxStat database.
Go to next chapter >> Gross Value Added (GVA)
Learn about our data and confidentiality safeguards, and the steps we take to produce statistics that can be trusted by all.