
Net Operating Surplus is obtained after deduction of Compensation of Employees, Non-product taxes less subsidies as well as Consumption of Fixed Capital from Gross Value Added. For more information see the Background Notes.
When examined by A21 sector, Manufacturing activities (C) was the largest sector by NOS in both 1995 and 2019. Agriculture, Forestry and Fishing (A) declined from the second biggest NOS sector in 1995 to the ninth biggest in 2019. Construction (F), the seventh largest sector by NOS in 1995 increased to the fifth largest in 2005, then declined to the twentieth (and lowest) in 2015 before recovering to the seventh largest NOS by A21 sector in 2019. Information and Communication activities (J) increased from the fifth largest NOS sector in 1995 to the second biggest in 2019.
Figure 6.1 Proportional composition of Net Operating Surplus (NOS) by A21 sector, 1995-2019
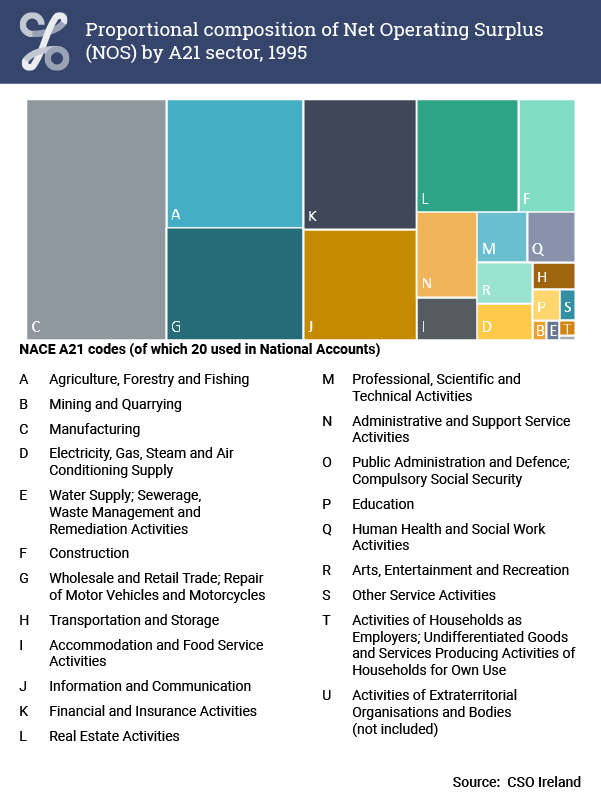
Proportional composition of Net Operating Surplus (NOS) by A21 sector, 1995
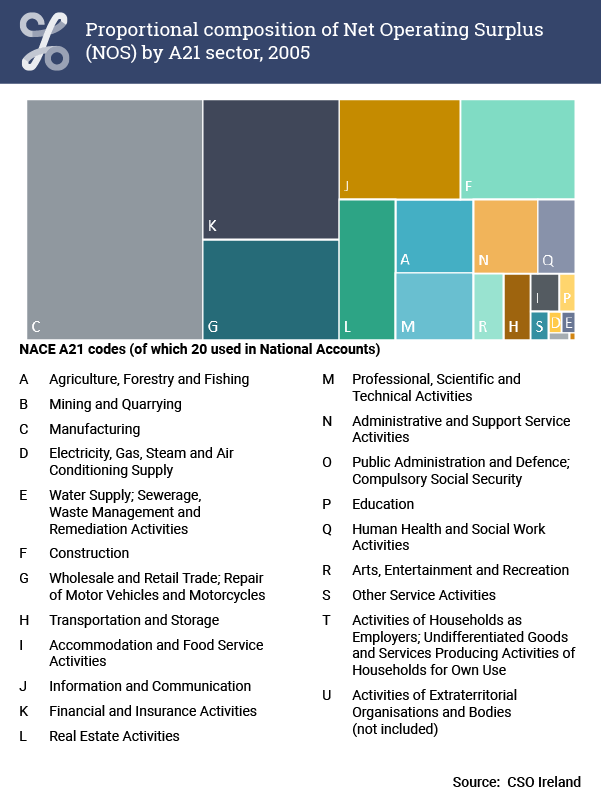
Proportional composition of Net Operating Surplus (NOS) by A21 sector, 2005
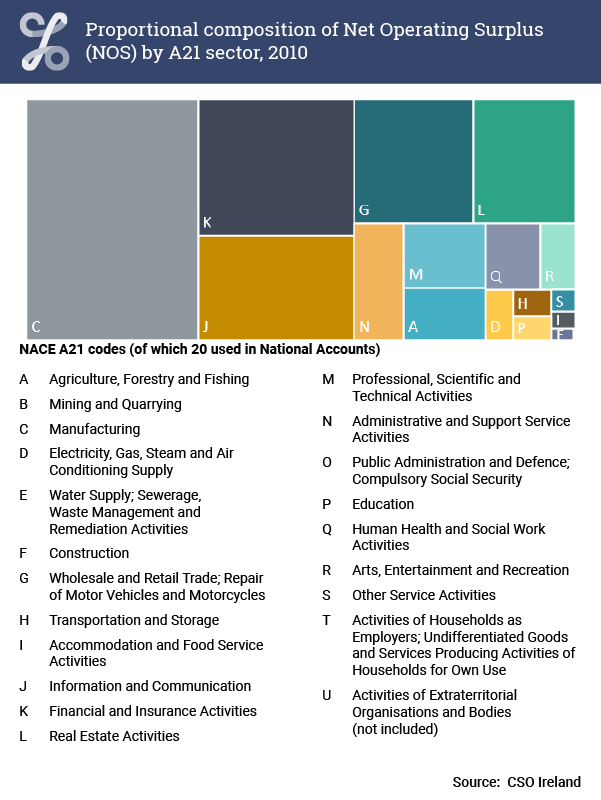
Proportional composition of Net Operating Surplus (NOS) by A21 sector, 2010
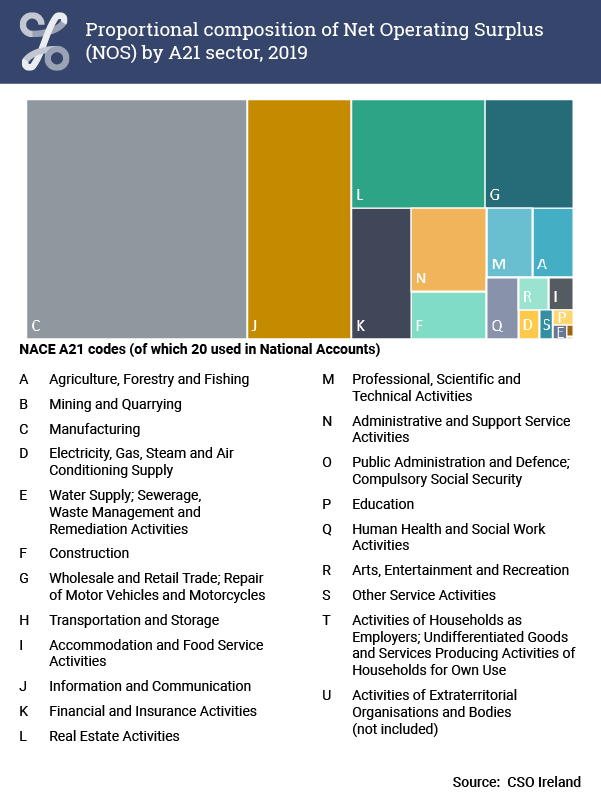
Proportional composition of Net Operating Surplus (NOS) by A21 sector, 2019
| SECTOR/TIME | Manufacturing | Construction | Information and Communication | Other |
|---|---|---|---|---|
| 1995 | 4857.099 | 921.008429 | 1792.012437 | 11451.249077 |
| 1996 | 5341.40869 | 1016.59992 | 1958.557604 | 12289.097004 |
| 1997 | 7546.990366 | 1290.942956 | 2693.399089 | 13623.182313 |
| 1998 | 10051.19211 | 1582.26501 | 3383.12339 | 16003.086829 |
| 1999 | 12559.86836 | 1867.191938 | 4021.404455 | 17003.511432 |
| 2000 | 14914.728752 | 2216.281198 | 4556.867547 | 20869.337628 |
| 2001 | 19635.925406 | 2653.9797 | 3959.902407 | 22005.413238 |
| 2002 | 24899.012963 | 2733.708517 | 3859.440336 | 23424.292513 |
| 2003 | 21926.725681 | 3457.642605 | 4470.920221 | 26990.265748 |
| 2004 | 20605.11689 | 4451.709319 | 5381.985207 | 27896.673409 |
| 2005 | 19799.089823 | 5368.043196 | 5636.321413 | 30596.850466 |
| 2006 | 19981.243428 | 6812.606123 | 5266.809772 | 31722.183591 |
| 2007 | 20169.627019 | 4728.519073 | 6046.625889 | 37615.192847 |
| 2008 | 17534.607448 | 1601.246952 | 6827.727639 | 34435.661971 |
| 2009 | 20606.21564 | -1944.607913 | 6689.980652 | 29055.901824 |
| 2010 | 19199.273246 | -1921.650818 | 7525.516729 | 34429.10772 |
| 2011 | 22894.523565 | -1057.743583 | 7667.469494 | 34125.392149 |
| 2012 | 22079.800117 | 262.866665 | 8185.50758 | 34258.071013 |
| 2013 | 21423.691081 | 1087.435258 | 8658.827762 | 36463.821145 |
| 2014 | 24459.979723 | 1873.094603 | 10214.957869 | 40089.050541 |
| 2015 | 52197.967597 | 2144.64551 | 12694.632688 | 43130.074222 |
| 2016 | 45600.004904 | 2492.27291 | 12594.502723 | 44482.198801 |
| 2017 | 47419.060921 | 3447.429796 | 16196.676583 | 49692.937261 |
| 2018 | 54537.150738 | 3704.541924 | 20694.021234 | 52430.582143 |
| 2019 | 58608.39209 | 4019.376603 | 27795.455493 | 54800.693618 |
In the above figure, a version of which is repeated across Chapters, the 1995-2019 time-series of notable sectors of the economy are displayed.
Similarly to Output, Intermediate Consumption and GVA, Manufacturing (C) was the biggest single A21 sector of the economy when measured by NOS over the entire 1995-2019 period. Information and Communication (J) was the second biggest sector in 2019. These two sectors dominated, even more than for Output, Intermediate Consumption and GVA, and combined these two A21 sectors comprised 59.5% of total NOS across the economy in 2019, which was an increase from 35.0% in 1995.
Construction (F) which had less NOS than Information and Communication in 1995, increased to have more NOS in 2006, but then dramatically decreased and had NOS which was less than a seventh of Information and Communication in 2019.
The Other category in the figure above is total Output less Manufacturing, Information and Communication and Construction. Sector figures can be found in the tables above and in the full 1995-2019 time series available in the CSO's StatBank database.
Go to next chapter Consumption of Fixed Capital (CFC)
Learn about our data and confidentiality safeguards, and the steps we take to produce statistics that can be trusted by all.