
Compensation of Employees (COE) is the total remuneration paid by employers to their employees in return for work done. Compensation of Employees includes both wages and salaries and employers' social contributions. For more information see the Background Notes.
When examined by A21 sector, Manufacturing (C) activities was the largest sector by COE in 1995 and in 2019. Human Health and Social Work activities (Q) was the fourth largest sector by COE in 1995, increasing to become the largest in 2010 and 2015, and the second largest in 2019. Construction (F), the sixth largest sector by COE in 1995 increased to the second largest in 2005, then declined to the twelfth largest sector in 2015 before slightly recovering to the tenth largest in 2019. Education (P) which was the third biggest sector by COE in 1995 was the eighth largest in 2019. Public Administration (O) went from the fifth to the fourth largest from 1995 to 2019. Agriculture, Forestry and Fishing (A) declined from the eleventh biggest sector by COE in 1995 to the seventeenth biggest in 2019.
Users should note that these Output method data are presented from a National Accounts compilation perspective. Output and Value Added along with the Income method components of GVA/GDP are shown by sector. However, these figures do not take account of changes in employment numbers and consequently should not be used as proxies for comparisons of productivity or wage rates by sector. Output and Value Added data are a starting point for such analysis when used in combination with additional, relevant data.
Figure 5.1 Proportional composition of Compensation of Employees (COE) by A21 sector, 1995-2019
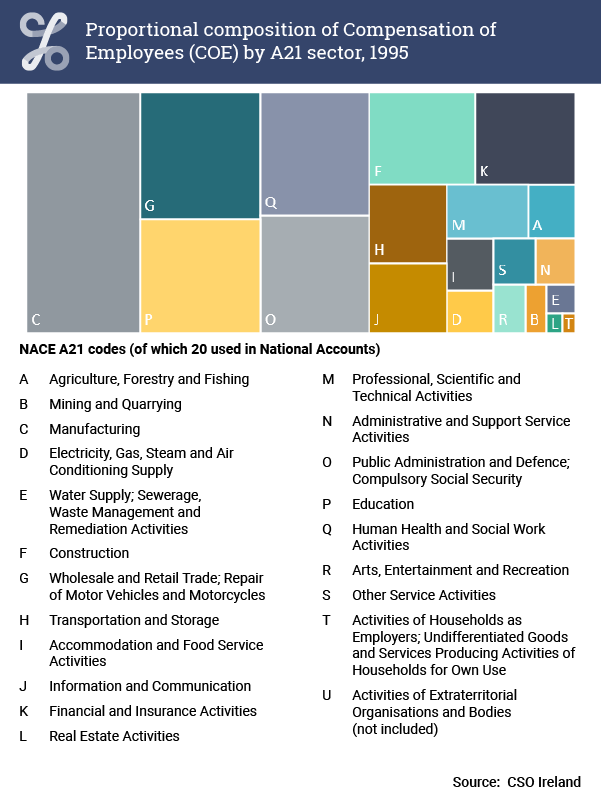
Proportional composition of Compensation of Employees (COE) by A21 sector, 1995

Proportional composition of Compensation of Employees (COE) by A21 sector, 2005

Proportional composition of Compensation of Employees (COE) by A21 sector, 2010

Proportional composition of Compensation of Employees (COE) by A21 sector, 2019
| SECTOR/TIME | Manufacturing | Construction | Information and Communication | Other |
|---|---|---|---|---|
| 1995 | 4954.723638 | 1783.598604 | 974.358207 | 16252.949014 |
| 1996 | 5322.91938 | 1938.319553 | 1130.334377 | 17700.493971 |
| 1997 | 5792.339918 | 2222.29347 | 1415.395643 | 19649.248676 |
| 1998 | 6654.35289 | 2741.402257 | 1751.718586 | 21596.565605 |
| 1999 | 7066.546664 | 3407.738933 | 2215.094863 | 24177.118923 |
| 2000 | 7644.950253 | 4361.170795 | 2388.4969 | 27528.696033 |
| 2001 | 8315.527503 | 5035.10675 | 2902.2233 | 30641.923829 |
| 2002 | 8270.991638 | 5532.240161 | 2798.793985 | 33601.724882 |
| 2003 | 8760.097687 | 6068.460482 | 2697.670078 | 37145.854101 |
| 2004 | 8772.567118 | 7067.961413 | 2696.308971 | 40856.864856 |
| 2005 | 9423.886984 | 8788.023228 | 3016.834946 | 44931.140733 |
| 2006 | 9726.504046 | 10022.056134 | 3304.449223 | 49792.034275 |
| 2007 | 10330.534635 | 10749.26899 | 3414.671824 | 55287.092039 |
| 2008 | 10234.64423 | 8855.985374 | 3802.807114 | 58927.178166 |
| 2009 | 8892.006197 | 5567.024485 | 3824.703531 | 56113.089498 |
| 2010 | 8397.079215 | 3791.319733 | 4071.148849 | 53385.06449 |
| 2011 | 8356.455746 | 2404.780752 | 3793.226415 | 53345.0813 |
| 2012 | 8245.310221 | 2081.548195 | 4046.54284 | 54039.089717 |
| 2013 | 8720.782521 | 2093.52369 | 4543.273911 | 54558.844676 |
| 2014 | 9239.419408 | 2285.131418 | 4831.936085 | 56356.259527 |
| 2015 | 9845.616447 | 2488.182319 | 5393.171482 | 59362.820551 |
| 2016 | 10617.873458 | 2979.069619 | 6002.827731 | 62563.955507 |
| 2017 | 11095.557402 | 3584.441484 | 6675.358393 | 66577.191756 |
| 2018 | 11831.774828 | 3937.848617 | 7459.645884 | 70287.921904 |
| 2019 | 12745.068358 | 4236.83547 | 8369.031773 | 75016.232025 |
In the above figure, a version of which is repeated across Chapters, the 1995-2019 time-series of some notable A21 sectors of the economy are displayed.
The Manufacturing (C) sector, while it was the biggest single A21 sector of the economy when measured by COE in 2019, was not as dominant over the entire 1995-2019 period as for Output, Intermediate Consumption and GVA. Human Health and Social Work (Q) was the single biggest A21 sector in both 2010 and 2015 and was second biggest in 2019.
Information and Communication (J) was the fifth biggest sector in 2019. There was far less concentration of COE in sectors than found for Output, Intermediate Consumption and GVA. For example Manufacturing combined with Information and Communication comprised 21.0% of total COE across the economy in 2019, from 24.7% in 1995.
The Other category in the figure above is total Output less Manufacturing, Information and Communication and Construction. Sector figures can be found in the tables above and in the full 1995-2019 time series available in the CSO's StatBank database.
Go to next chapter Net Operating Surplus (NOS)
Learn about our data and confidentiality safeguards, and the steps we take to produce statistics that can be trusted by all.