
Output at basic prices covers the value of all goods produced for sale, including unsold goods, and all receipts for services rendered. Output furthermore covers the market equivalent of goods and services produced for own use, such as own account capital formation, services of owner-occupied dwellings and agricultural products produced by farmers for own consumption. For more information see the Background Notes.
The following set of four treemap charts illustrate the proportional composition of the total by each A21 sector in a particular year (1995, 2005, 2010, 2017). The value and rank of each A21 sector are also provided along with comparisons with EU Member States in the tables and graphs below. This structure is repeated across each thematic Chapter. Further details on the composition of the A21 and A10 sectors are provided in the charts and tables and in the Background Notes Chapter.
When examined by A21 sector, Manufacturing (C), Information & Communication (J) and Financial & Insurance activities (K) were the largest sectors by Output in both 1995 and 2017. Construction (F), the fourth largest sector by Output in 1995, increased to the second largest in 2005. Construction (F) then declined to the eleventh largest sector by Output in 2010 before recovering to the sixth largest in 2017. Agriculture, Forestry and Fishing (A) declined from the sixth biggest sector by Output in 1995 to the fourteenth biggest in 2010 before recovering to the twelfth largest in 2017.
Figure 2.1 Proportional composition of Output by A21 sector, 1995-2017
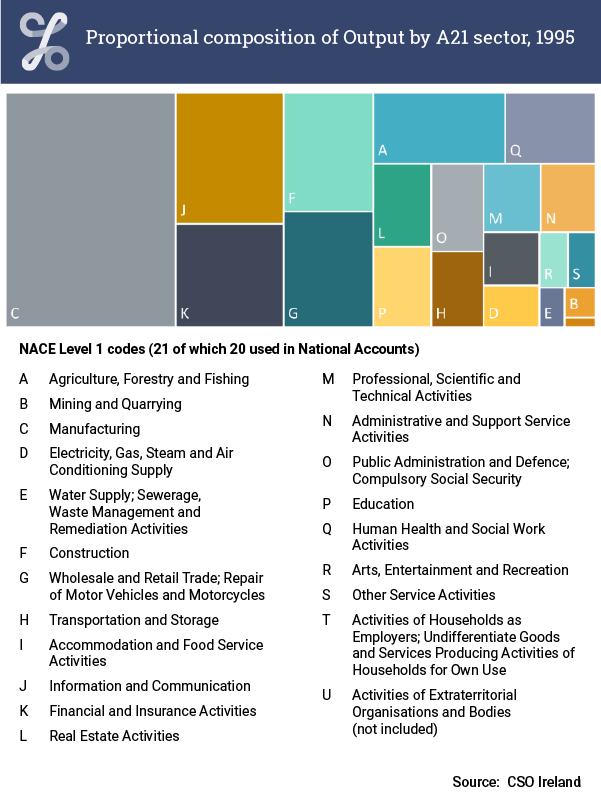
Proportional composition of Output by A21 sector, 1995
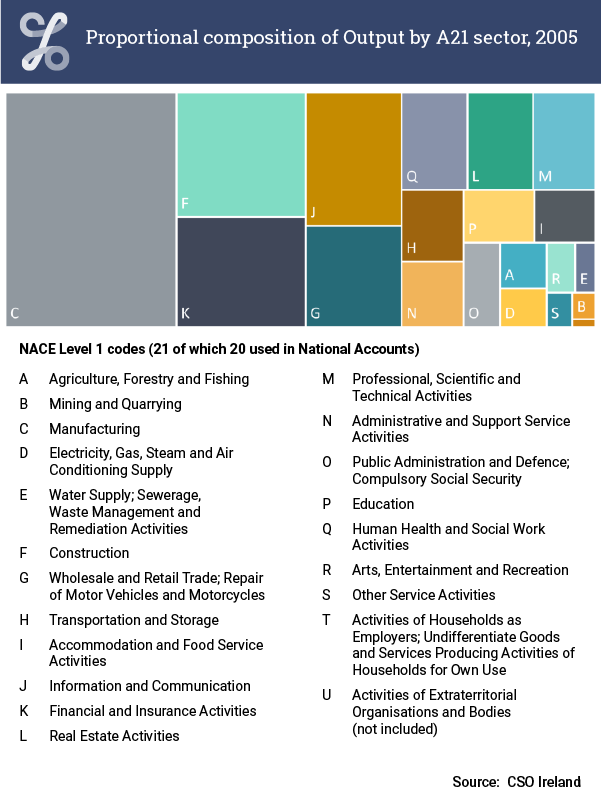
Proportional composition of Output by A21 sector, 2005
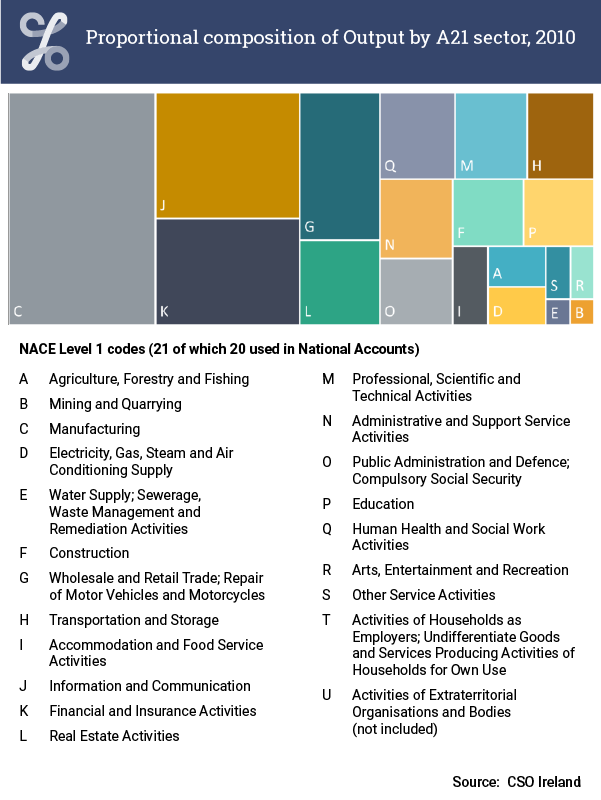
Proportional composition of Output by A21 sector, 2010
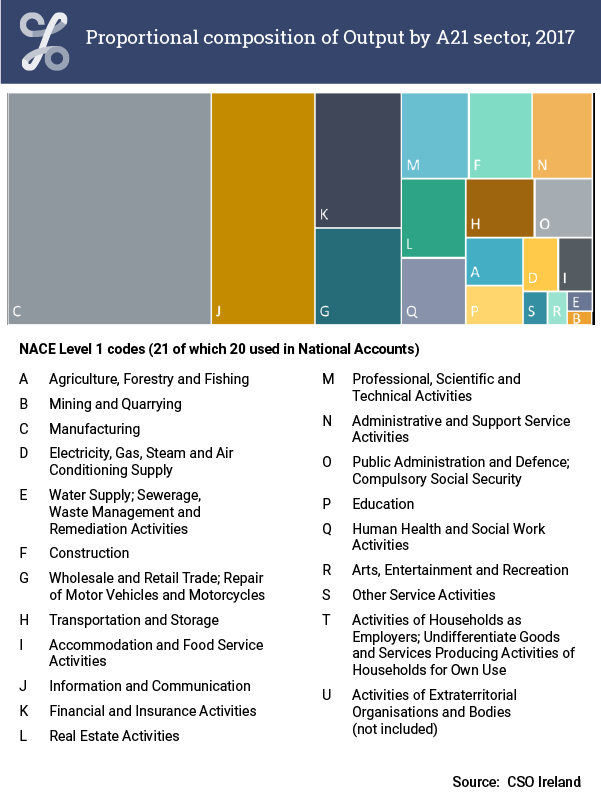
Proportional composition of Output by A21 sector, 2017
| Greece | United Kingdom | France | Germany | Ireland | Luxembourg | |
| 1995 | 54.0865893850735 | 53.666386728155 | 52.9252017874882 | 54.0205296268879 | 43.3460076045627 | 49.9009133350934 |
| 1996 | 54.3977714374166 | 53.7182135867018 | 53.0419558739112 | 53.9423882473525 | 43.4939063970726 | 49.3460207941606 |
| 1997 | 55.5189764610603 | 53.3869462626564 | 52.7639215600239 | 53.5330691272673 | 43.143576879715 | 46.5760256486374 |
| 1998 | 55.9606368969233 | 53.0344025719732 | 52.7957529439136 | 53.0914871969739 | 42.8896867692755 | 42.9547950365258 |
| 1999 | 56.0445298019161 | 52.6358089158706 | 52.1403761089138 | 52.1790777265058 | 43.0668581541886 | 41.5519474316738 |
| 2000 | 54.5174892512887 | 52.5661154438892 | 50.8316658880358 | 50.9372056100274 | 43.2698162927676 | 37.4250388418592 |
| 2001 | 54.4461511997659 | 52.3621662107285 | 50.6509152924471 | 50.985478198663 | 42.8793175110445 | 37.3621006564551 |
| 2002 | 54.4006143125419 | 52.61316724468 | 51.2005578928376 | 51.964737671356 | 44.1938503842867 | 38.5799922628442 |
| 2003 | 55.9160514092107 | 53.2014085063063 | 51.684037934078 | 51.2886731110128 | 43.9339687840881 | 38.739896345673 |
| 2004 | 56.0530084236825 | 53.0439501091806 | 51.5307180827368 | 50.9299373210291 | 43.4540947620131 | 36.3489239161609 |
| 2005 | 55.6209784001968 | 53.8990969941036 | 50.9900410791821 | 49.9569193353845 | 43.3051558366135 | 34.1916219102701 |
| 2006 | 54.5384096863705 | 52.6716239268196 | 50.3859044306756 | 49.1962724877025 | 42.0604434673119 | 32.168380113834 |
| 2007 | 54.3379682009573 | 52.0907616363752 | 50.3249658196723 | 48.6090899359305 | 41.7311054728069 | 30.8254043833946 |
| 2008 | 55.3322878577325 | 52.1180559667949 | 50.2424257540476 | 47.9011268481507 | 39.723276579425 | 30.6569002853906 |
| 2009 | 56.5148682513859 | 52.0257541073147 | 51.7173188732353 | 49.3441528624373 | 40.9313765044977 | 33.184644674499 |
| 2010 | 56.2958131681373 | 51.8109264089511 | 50.7641203142886 | 48.610452452753 | 42.4551739458537 | 31.2891090051907 |
| 2011 | 56.2731836730022 | 51.4654987142373 | 50.1609229086873 | 47.4980594496975 | 45.7269163896641 | 31.1852721858671 |
| 2012 | 55.0612999666007 | 51.5562743022334 | 50.1013608644473 | 48.1770124178559 | 42.1071251567707 | 29.9967784216703 |
| 2013 | 54.7863105255204 | 51.3757135576247 | 50.4866523378871 | 48.8489360806941 | 42.0545725115879 | 28.8077639460714 |
| 2014 | 54.7653554929222 | 52.0105996662068 | 50.6653536082729 | 49.1976788391593 | 42.6966784309291 | 26.2885325150802 |
| 2015 | 55.9063423995476 | 52.2446946997592 | 51.0701026169889 | 49.8735510968564 | 47.0301767069611 | 24.8722251460912 |
| 2016 | 56.0208919519363 | 52.7491968209932 | 51.128667447056 | 50.3435180426746 | 45.4861401967267 | 25.2692111234854 |
| 2017 | 55.0790873572816 | 52.223163412739 | 50.6905503402485 | 50.0429939798266 | 45.4788579701107 | 25.2650959886758 |
In the above figure, repeated in each theme, the 1995-2017 time-series for Ireland is displayed. Additionally, for comparison purposes, the EU Member States with the highest and lowest percentages are shown along with France, Germany and the United Kingdom.
Ireland's GVA as a percentage of Output remained relatively stable between 1995 and 2017, staying within the range 40% to 47%. This was less than the percentages for France, Germany and the UK throughout the entire period. Luxembourg showed the lowest GVA as a percentage of Output (25%) among EU Member States in 2017, while Greece (55%) reported the highest percentage.
| Output | |
| Luxembourg | 6.45907320931123 |
| Cyprus | 7.86053633829361 |
| Malta | 8.6873516504158 |
| United Kingdom | 14.9525120481467 |
| Latvia | 17.8751581309125 |
| France | 19.1596876872583 |
| Denmark | 19.266523715666 |
| Greece | 19.7275736170814 |
| Croatia | 21.4988926015542 |
| Sweden | 22.8579564812664 |
| Netherlands | 23.024008075259 |
| Estonia | 26.0429771390085 |
| Belgium | 26.1511645918104 |
| Portugal | 26.367437381738 |
| Spain | 27.1560493507811 |
| Finland | 27.2432568228923 |
| Austria | 27.8606261666106 |
| Romania | 28.7954023415963 |
| Italy | 29.1330331761632 |
| Lithuania | 29.7333825670037 |
| Bulgaria | 29.8782365396824 |
| Poland | 32.5446149528384 |
| Germany | 32.9859941415727 |
| Slovenia | 33.4074355000189 |
| Ireland | 34.7943876160223 |
| Slovakia | 38.0790332593447 |
| Czechia | 39.1427901112137 |
| Hungary | 39.3148995680706 |
In the above figure, repeated in each theme, the 2017 data for each reporting EU Member State are displayed in ascending order.
In 2017, Ireland had the fourth highest manufacturing Output as a percentage of total Output (35%) among EU Member States. The highest reported percentage in the EU was in Hungary (39%), while the lowest reported was in Luxembourg (6%).
Go to next chapter Intermediate Consumption
Learn about our data and confidentiality safeguards, and the steps we take to produce statistics that can be trusted by all.