
GUI data was revised on 23 July 2025 due to a syntax error when calculating the weights. These weights have been corrected and the updated figures reflect this correction. The impact of these changes on the results presented in the original release is minor and do not affect the high-level results and trends presented in the original release. For more details, see Information Note.
Growing Up in Ireland (GUI) is the national longitudinal study of children and young people in Ireland. The study is a joint project by the Central Statistics Office (CSO) and the Department of Children, Equality, Disability, Integration and Youth (DCEDIY). The CSO is responsible for the GUI survey itself: identifying needs; designing and building the survey; collecting, processing, and analysing the data, and facilitating data access to researchers and policy makers. DCEDIY has responsibility for the wider elements of the GUI study: engaging with policy and scientific stakeholders; consulting with children/young people; identifying research needs, data priorities and policy objectives, and promoting the use of GUI data for research and policy development. Working closely together ensures seamless integration of the complimenting responsibilities.
Established in 2006, the study originally followed two groups of Irish children: Cohort '98 who joined the study when they were nine years old, and Cohort '08 who joined the study when they were nine months old. The two cohorts have been surveyed at regular intervals since. Cohort '08 will be aged 17/18 in the next wave of data collection planned for 2025. Cohort '98 were aged 25 at their last wave of data collection (Wave 5) and the results of that exercise are the subject of this report.
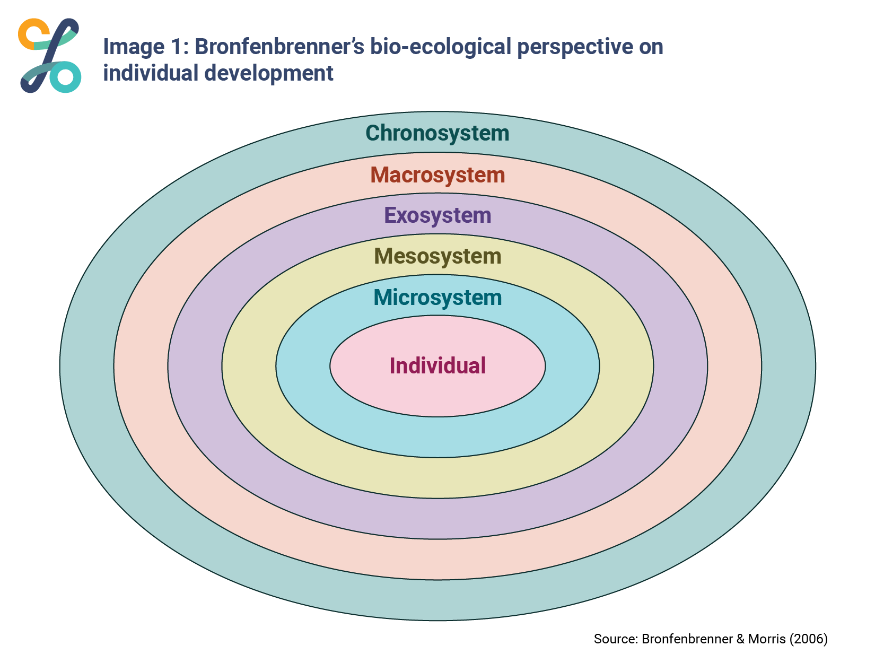
The conceptual framework for GUI draws heavily on the bio-ecological model developed by Urie Bronfenbrenner (Bronfenbrenner & Morris, 2006). Under this model, a person’s development is the result of interactions between them (‘bio’) and their environment (‘ecological’). The environment is made up of multiple ‘systems’ – both close to the person, such as their family and friends, and wider such as the society or culture in which they grow up. These different systems impact a person in different ways. In Bronfenbrenner’s model, there are five systems:
GUI is a critical instrument by which policy makers and researchers can examine the factors which shape the development of children in contemporary Ireland and, through this, to contribute to the setting of responsive policies and the design of services for children and their families. In September 2024, the CSO and DCEDIY launched a third cohort, Cohort '24. Around 15,000 – 16,000 households with nine-month-old infants will be invited to take part over the next year.
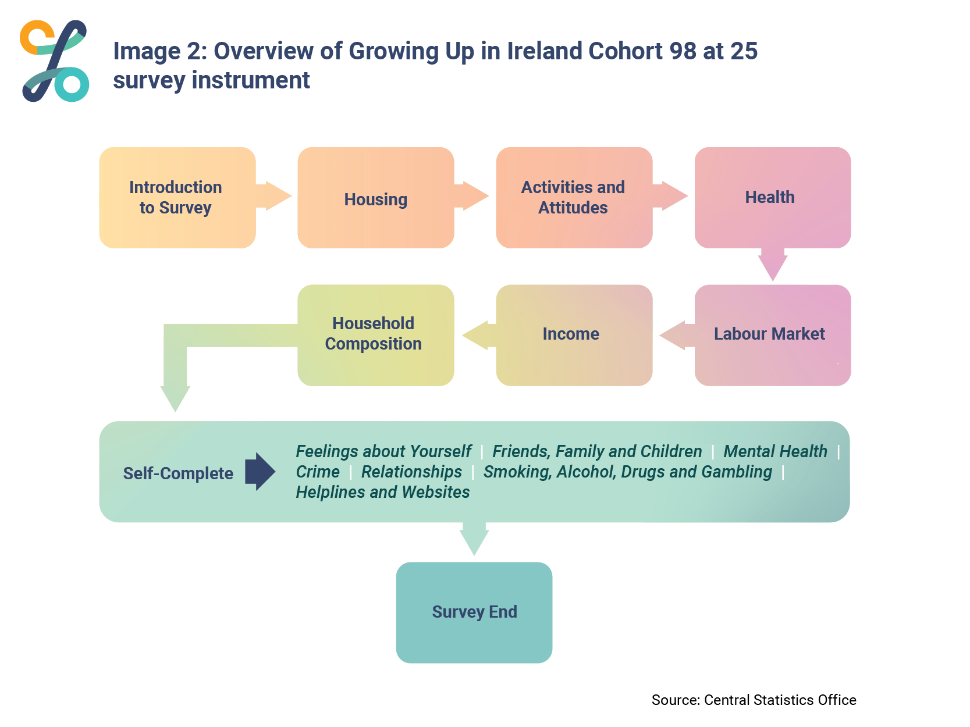
The main policy and research domains of interest for Cohort '98 at 25 were defined via a stakeholder engagement exercise and published by DCEDIY in a research needs report. The themes that the final survey instrument addressed were:
By providing evidence on these domains, GUI facilitates policymakers in their creation of a robust support system for 25-year-olds, fostering a generation that is healthy, emotionally resilient, well-educated, and civically engaged.
Data collection for Cohort '98 Wave 5 took place between April 2023 and April 2024.
GUI is a longitudinal study based on a fixed panel design. Cohort '98 follows the children and their families who were recruited into the study at 9 years of age for re-interview on several subsequent occasions. In the original design, the sampling frame was the register of primary schools in Ireland with a two-stage sampling design: a random sample of schools was selected from the frame, with a sample of nine-year old children then drawn from the selected schools. The design ensured that the sample was regionally representative and free from spatial bias. The 2006 Census of Population recorded 56,497 nine-year-olds in the country. The selected sample size of 8,568 accounted for approximately 15% of this population, equating to about 1 in every 7 nine-year-olds nationwide.
After the initial sample selection at 9 years of age, no additions were made to the sample. The children and their families were re-interviewed at 13, 17, and 20 years of age. There was a special Covid survey run in December 2020 when Cohort '98 were aged 22. By 25 years of age the sample represents the respondents and their families who were resident in Ireland at nine years of age and who continued to live in the country when they were 25 years old.
At Wave 1 of Cohort '98, 8,568 nine-year-olds and their families were interviewed. All these families were approached for re-interview when the study child was 13 years old with 7,525 families participating in Wave 2. At the third round of interviewing, when the study children were aged 17/18 years, 8,277 families were approached for re-interview. This included families who had been interviewed at Wave 1 but had not participated in Wave 2. There were 6,216 responding households at Wave 3. In Wave 4, questionnaires were completed by 5,190 20-year-olds representing a 65% response rate. A parent of the respondent was also interviewed if available but if they weren’t available, data from the 20-year-old was still collected. Wave 5 represents the first time that data from only the 25-year-old respondent and no other household members was included.
For the current Wave 5, all previous respondents were invited to be re-interviewed unless the family had previously definitively refused to be contacted in future waves of the study or was not eligible (i.e. the whole family had moved abroad, or the respondent was sadly deceased). 7,870 respondents were approached for re-interview in Wave 5.
Respondents received a letter inviting them to complete the survey online. The letter contained a personal secure code to access their questionnaire. Reminder letters were sent out in six-week intervals.
Respondents who did not self-complete the online survey were visited by an interviewer and offered an in-person interview. The online survey remained open during this time; some respondents opted to compete the interview online, others in-person with the interviewer. The final mode breakdown for the data collection was 87.1% of respondents completed the interview online and 12.9% of respondents completed the survey in-person.
In addition, CSO uses primary micro data sources in its statistical programmes to complement or replace survey data, to make its statistical operations more efficient or to create new insights or products. These data enable CSO to fill information needs about the Irish society, economy, and environment, reduce response burden and costs imposed by surveys, and improve data quality and timeliness. All data obtained by CSO are used solely for statistical purposes.
The primary micro data sources which will complement the GUI Cohort '98 at 25 years old survey data are Revenue Commissioner’s Income Tax Form 11, PAYE income data, Department of Social Protection (DSP) social welfare data, Higher Education Authority (HEA) data, Quality and Qualifications Ireland (QQI) data, the State Exams Commission (SEC) and SOLAS data on apprenticeships. The education administrative data for the 2021-’22 academic year includes nearly all higher and further education courses in Ireland in both state and private bodies. It does not include many courses carried out under the Springboard program, many profession-specific qualifications which are administered by internal bodies, attendance at any secondary education institutions in Ireland that do not follow the standard national curriculum and do not carry out the Leaving Certificate as part of their standard program, or any non-higher education related education or training which may have been undertaken outside of Ireland. Information on training undertaken abroad was collected via GUI survey questions.
Median weekly income in the “Income and Cost of Living” section was calculated broadly in line with the methodology outlined in the CSO publication Earnings Analysis using Administrative Data Sources (EAADS).
For the purposes of this analysis, one primary employment for each respondent was utilised, defined as the highest earning employment in that calendar year. Certain types of employment were excluded:
Weekly median income was calculated by dividing the gross annual wages for the primary occupation by the number of weeks worked in that employment. Weeks worked were defined as PRSI-insurable weeks. Employment that met the above criteria and occurred at any time of the year was considered eligible. This contrasts with the EAADS methodology, which primarily includes only employment active in October of the relevant year.
The collection of information from administrative sources reduced the length of the questionnaire for the respondent. The CSO continues to work with these sources to ensure good quality data is available on a timely basis.
The achieved response rate for eligible respondents was 49.5% (achieved sample of 3,380). A breakdown of the sample is provided in the below table.
| Approached for interview in Wave 5 | 7870 |
| Ineligible for interview at Wave 5 (includes emigrated, deceased and other) | 1035 |
| Eligible Sample | 6835 |
|
Interview Completed Complete -2836 Partial - 544 |
3380 |
|
Non-responders Refusal - 667 Other non-response - 2789 |
3346 |
The linkage and analysis were undertaken by the CSO for statistical purposes in line with the Statistics Act, 1993 and the CSO Data Protocol.
Before using personal administrative data for statistical purposes, the CSO removes all identifying personal information including the Personal Public Service Number (PPSN). The PPSN is a unique number that enables individuals to access social welfare benefits, personal taxation, and other public services in Ireland. The CSO converts the PPSN to a Protected Identifier Key (PIK). The PIK is a unique and non-identifiable number which is internal to the CSO. Using the PIK enables the CSO to link and analyse data for statistical purposes, while protecting the security and confidentiality of the individual data. The Revenue, DSP, Census and HEA records were linked using the PIK for this project. All records in the datasets are anonymised and the results are in the form of statistical aggregates which do not identify any individuals.
If education administrative records could not be linked for a survey respondent, an assumption was applied that they had achieved a qualification up to NFQ Level 3 (Junior Certificate or equivalent). This reflected 3.4% of the weighted dataset.
Unit non-response occurs when individuals who are part of the population, and are eligible for the survey, do not provide the requested information. This can lead to biased survey estimates if specific groups within the population are over- or under-represented and if these groups behave differently with respect to the survey variables. To correct for this, a non-response adjustment is used.
A threshold was applied to separate partial responses into those that were usable and suitable for imputation to address item missingness, and those where the item level missingness was deemed too high and the case was essentially one of unit non-response. If a respondent had fully completed the first section of the survey (questions relating to housing), they were included as a usable partial response. Seventy five cases were excluded from the final dataset based on this threshold. The final dataset included 3,380 respondents (2,836 completed surveys and 544 partially completed surveys) and 3,456 non-respondents.
A non-response adjustment was then created using population figures for the entire eligible population based on the CSO administrative data and data collected from Cohort '98 Wave 1. Logistic regression models identified the variables most predictive of non-response, with adjustments made to avoid excessively large sampling variances. These variables were:
The R package Icarus was then used to create the resultant non-response weights using these variables.
As in previous waves of Cohort '98, the base weight was the most recent weight that applied to a participant in a Cohort ’98 data collection, which in 82.7% of respondents was the weight used in Wave 4. If a respondent did not participate in Wave 4 their weight was taken from the most recent wave in which they participated – which is broken down as follows:
| Last Participating Wave | Number of Respondents | % of Respondents |
| Wave 1 (at age 9) | 51 | 1.5% |
| Wave 2 (at age 13) | 168 | 5.0% |
| Wave 3 (at age 17) | 367 | 10.9% |
| Wave 4 (at age 20) | 2794 | 82.7% |
As in Wave 3 and Wave 4 of Cohort '98 two separate weights, both deriving from the same population estimates, have been calculated. First is the cross-sectional weight which applies to all participants in Wave 5. The weighted dataset for this release was produced using the cross-sectional weight. The second weight, referred to as the longitudinal weight, is the weight to be applied for cross-wave analysis across the cohort. For this reason, only respondents who have participated in every wave to date are given a longitudinal weight, which is a population now of 2,594.
As in previous waves, all weights have been truncated to avoid excessively large sampling variances – here they have been bounded to one quarter of the mean at the lower end and four times the mean at the higher end.
Item non-response occurs when a respondent does not provide an answer to a specific question in the survey. This leads to gaps in the dataset, which can be filled by the method of imputation.
Rates of item level missingness per variable ranged between less than 1% to 20%.
For the main questionnaire, single imputation using a K-nearest neighbour model was employed using the R package VIM. All variables in the main questionnaire which were categorical, ordinal, or numeric and with no or very little dependencies had their missingness imputed. The accuracy of the models used was tested using a set of core variables against the pre-existing survey data until an accuracy rate of 90% or higher was achieved. Overall, 57 variables in the main questionnaire have imputed values.
Further imputation resulted from a detailed analysis of multiple related questions within the survey and/or carrying variable level data forward from previous survey waves. For example, sex, height, urban/rural status, and household relationships if at same address and with same household structure, were carried forward from the previous wave if missing. Similarly, previous wave data was used to replace erroneous values entered by the respondent.
In the case of missing administrative data, hot deck imputation was applied based on age, sex, primary and secondary school location at age nine and age 13 respectively.
Where imputation or other methods as above to resolve item missingness were not possible or effective, the missing values have been re-coded for the purposes of this release as “Not Stated” or similar, to maximise the statistical power of the dataset.
Estimates were calculated in R.
The full series of data from the tables in this Growing Up in Ireland release are available from PxStat, the CSO’s main data dissemination service and can be accessed through the CSO website.
Growing Up in Ireland datasets are made available to researchers on a confidential and anonymised basis through the Irish Social Sciences Data Archive. These files are known as Anonymised Microdata Files (AMFs). For details on how to apply for data relating to Cohort '98, click here.
More detailed files, also on an anonymous and strictly confidential basis, may be made available to researchers at the discretion of the CSO. These files are known as Researcher Microdata Files (RMFs). Applications are made through the CSO here.
The AMF and RMF associated with Cohort '98 at age 25 will be available in the first half of 2025.
The binary categorisation, male or female, is used in this release in line with the current CSO Data Standard for Sex. Within the full Cohort '98 at age 25 dataset there were a small number of individuals who indicated that their gender identity was not the same as at birth (1.5%), and 1.1% of respondents opted for prefer not to say in response to this question. To avoid the risk of statistical disclosure, a breakdown of other gender categories is not included in this release. To ensure the inclusion of all respondents in the data, those recorded in the other gender categories were assigned to the binary categorisation, male or female, recorded at age nine, for the purposes of analysis. Please note that the CSO is currently developing a standard reference classification for gender in line with user requirements. This approach will be kept under review. See also CSO Data Standards.
The Principal Economic Status (PES) classification, which is also used in the Labour Force Survey (LFS) and the Census of Population, is based on a single question in which respondents are asked what their usual situation is regarding employment. The answer is given in response to the following categories:
Respondents to the GUI are asked the industrial sector of their main employment. This is converted to a two or three digit-NACE code through first an automated process and then secondarily, manual matching of the data where the automated process was not successful or was ambiguous.
The NFQ was launched in 2003 and it is now the single structure mechanism for recognising all education and training in Ireland. All framework awards now have an NFQ Level, numbered from 1 to 10, which tells you about the standard of learning and an NFQ Award-Type which tells you about the purpose, volume and progression opportunities associated with a particular award. Quality and Qualifications Ireland (QQI) has responsibility to develop, promote and maintain the Irish NFQ.
In this release educational attainment results are presented using a descriptive name and the corresponding NFQ levels.
For information on the NFQ see: National Framework of Qualifications (NFQ)
Occupation has been recoded to the new classification SOC2010 which is also the standard used in the LFS and Census. Previous occupation classifications for GUI were ISCO-88 and SOC1990.
The regional classifications in this release are based on the NUTS (Nomenclature of Territorial Units) classification used by Eurostat. Until Q4 2017, the NUTS3 regions corresponded to the eight Regional Authorities established under the Local Government Act, 1991 (Regional Authorities) (Establishment) Order, 1993, which came into operation on 1 January 1994 while the NUTS2 regions, which were proposed by Government and agreed by Eurostat in 1999, were groupings of those historic NUTS3 regions.
However, the NUTS3 boundaries were amended on 21st of November 2016 under Regulation (EC) No. 2066/2016 and have come into force from Q1 2018. These new groupings are reflected in the GUI from this wave. As a result of these changes, Louth moved from the Border to the Mid-East and what was formerly South Tipperary was amalgamated with North Tipperary and moved from the South-East to the Mid-West.
The new NUTS2 and NUTS3 regions are:
| Northern & Western NUTS2 Region | Southern NUTS2 Region | Eastern & Midland NUTS2 Region | |||
| NUTS3 | Constituing Counties | NUTS3 | Constituing Counties | NUTS3 | Constituing Counties |
|---|---|---|---|---|---|
| Border | Cavan Donegal Leitrim Monaghan Sligo |
Mid-West | Clare Limerick Tipperary |
Dublin | Dublin City Dun Laoghaire-Rathdown Fingal South Dublin |
| South-East | Carlow Kilkenny Waterford Wexford |
Mid-East | Kildare Louth Meath Wicklow |
||
| West | Galway Mayo Roscommon |
South-West | Cork Kerry |
Midland | Laois Longford Offaly Westmeath |
Scales in GUI were chosen in alignment with study objectives and established reliability and validity.
The Alcohol Use Disorders Identification Test (AUDIT) scale is a 10-item screening tool developed by the World Health Organization (WHO) to determine if a person’s alcohol consumption may be harmful.
The Fast Alcohol Screening Test (FAST) is a short screening tool for alcohol misuse. It consists of a subset of questions from the full Alcohol Use Disorders Identification Test (AUDIT). It consists of four items – females are asked how often they have six or more drinks on one occasion and males are asked how often they have eight or more drinks. It produces a total score and a categorisation of alcohol misuse by way of hazardous or not hazardous.
Self-esteem was measured using the Rosenberg Self-Esteem scale. The original ten item Rosenberg Self-Esteem scale was reduced to six items rated on a four-point scale ranging from 1 (strongly disagree) to 4 (strongly agree).
In the Growing Up in Ireland survey stress at age 25 years is measured using the Depression, Anxiety and Stress Scale (DASS) stress subscale. The DASS stress subscale contains seven items assessing difficulty relaxing, nervous arousal and being easily upset/agitated, irritable/over-reactive and impatient. The seven items are rated on a four point scale with responses of: did not apply to me at all; applied to me to some degree; applied to me a considerable degree, and applied to me very much. More information on this scale can be found here.
The Centre for Epidemiological Studies Depression Scale (CES-D; Radloff, 1977) is a widely used self-report measure that was developed specifically as a screening instrument for depression in the general population, as opposed to being a diagnostic tool that measures the presence of clinical depression. The 8-item short version of the CES-D was used, producing an overall score per respondent.
The Everyday Discrimination Scale (EDS) (Williams, Yu, Jackson, & Anderson, 1997) is a 5-item measure asking participants to indicate how frequently they feel they have experienced various forms of interpersonal mistreatment in their day-to-day lives, assessed on a six-point scale (0=never, 1= less than once a year, 2= a few times a year, 3= a few times a month, 4= at least once a week, 5= almost every day).
Some of the variables included in the Growing Up in Ireland dataset were derived for the purposes of analysis. Information on these variables and how they were derived will be included in a separate document which will accompany the release of the AMF and RMF.
Learn about our data and confidentiality safeguards, and the steps we take to produce statistics that can be trusted by all.