
This chapter provides Ireland’s ecosystem extent accounts for 2018, 2021 and 2024 (Table 2.1). It includes additions, reductions and net changes for each of 32 EU ecosystem types described in the Background Notes of this release. At the country level, conversions between these ecosystems at their level one (Table 2.2, Table 2.3) and level two (Table 2.4, Table 2.5) classifications in the EU ecosystem typology are given.
Opening extent, closing extent and net change figures are also given for each local authority for the periods 2018 to 2021 and 2021 to 2024 (Table 2.6 and Table 2.7). The extent of each ecosystem type for 2024 can also be visualised in Map 2.3. Finally, a county-level breakdown of these accounts can also be accessed in the Data chapter.
The accounts in Table 2.1 are based on ecosystem extent maps, as depicted below for 2024 (Map2.1 and 2.4). These are now available for viewing and download as ecosystem asset maps for 2018, 2021 and 2024. These can be accessed through the ArcGIS Experience Builder.
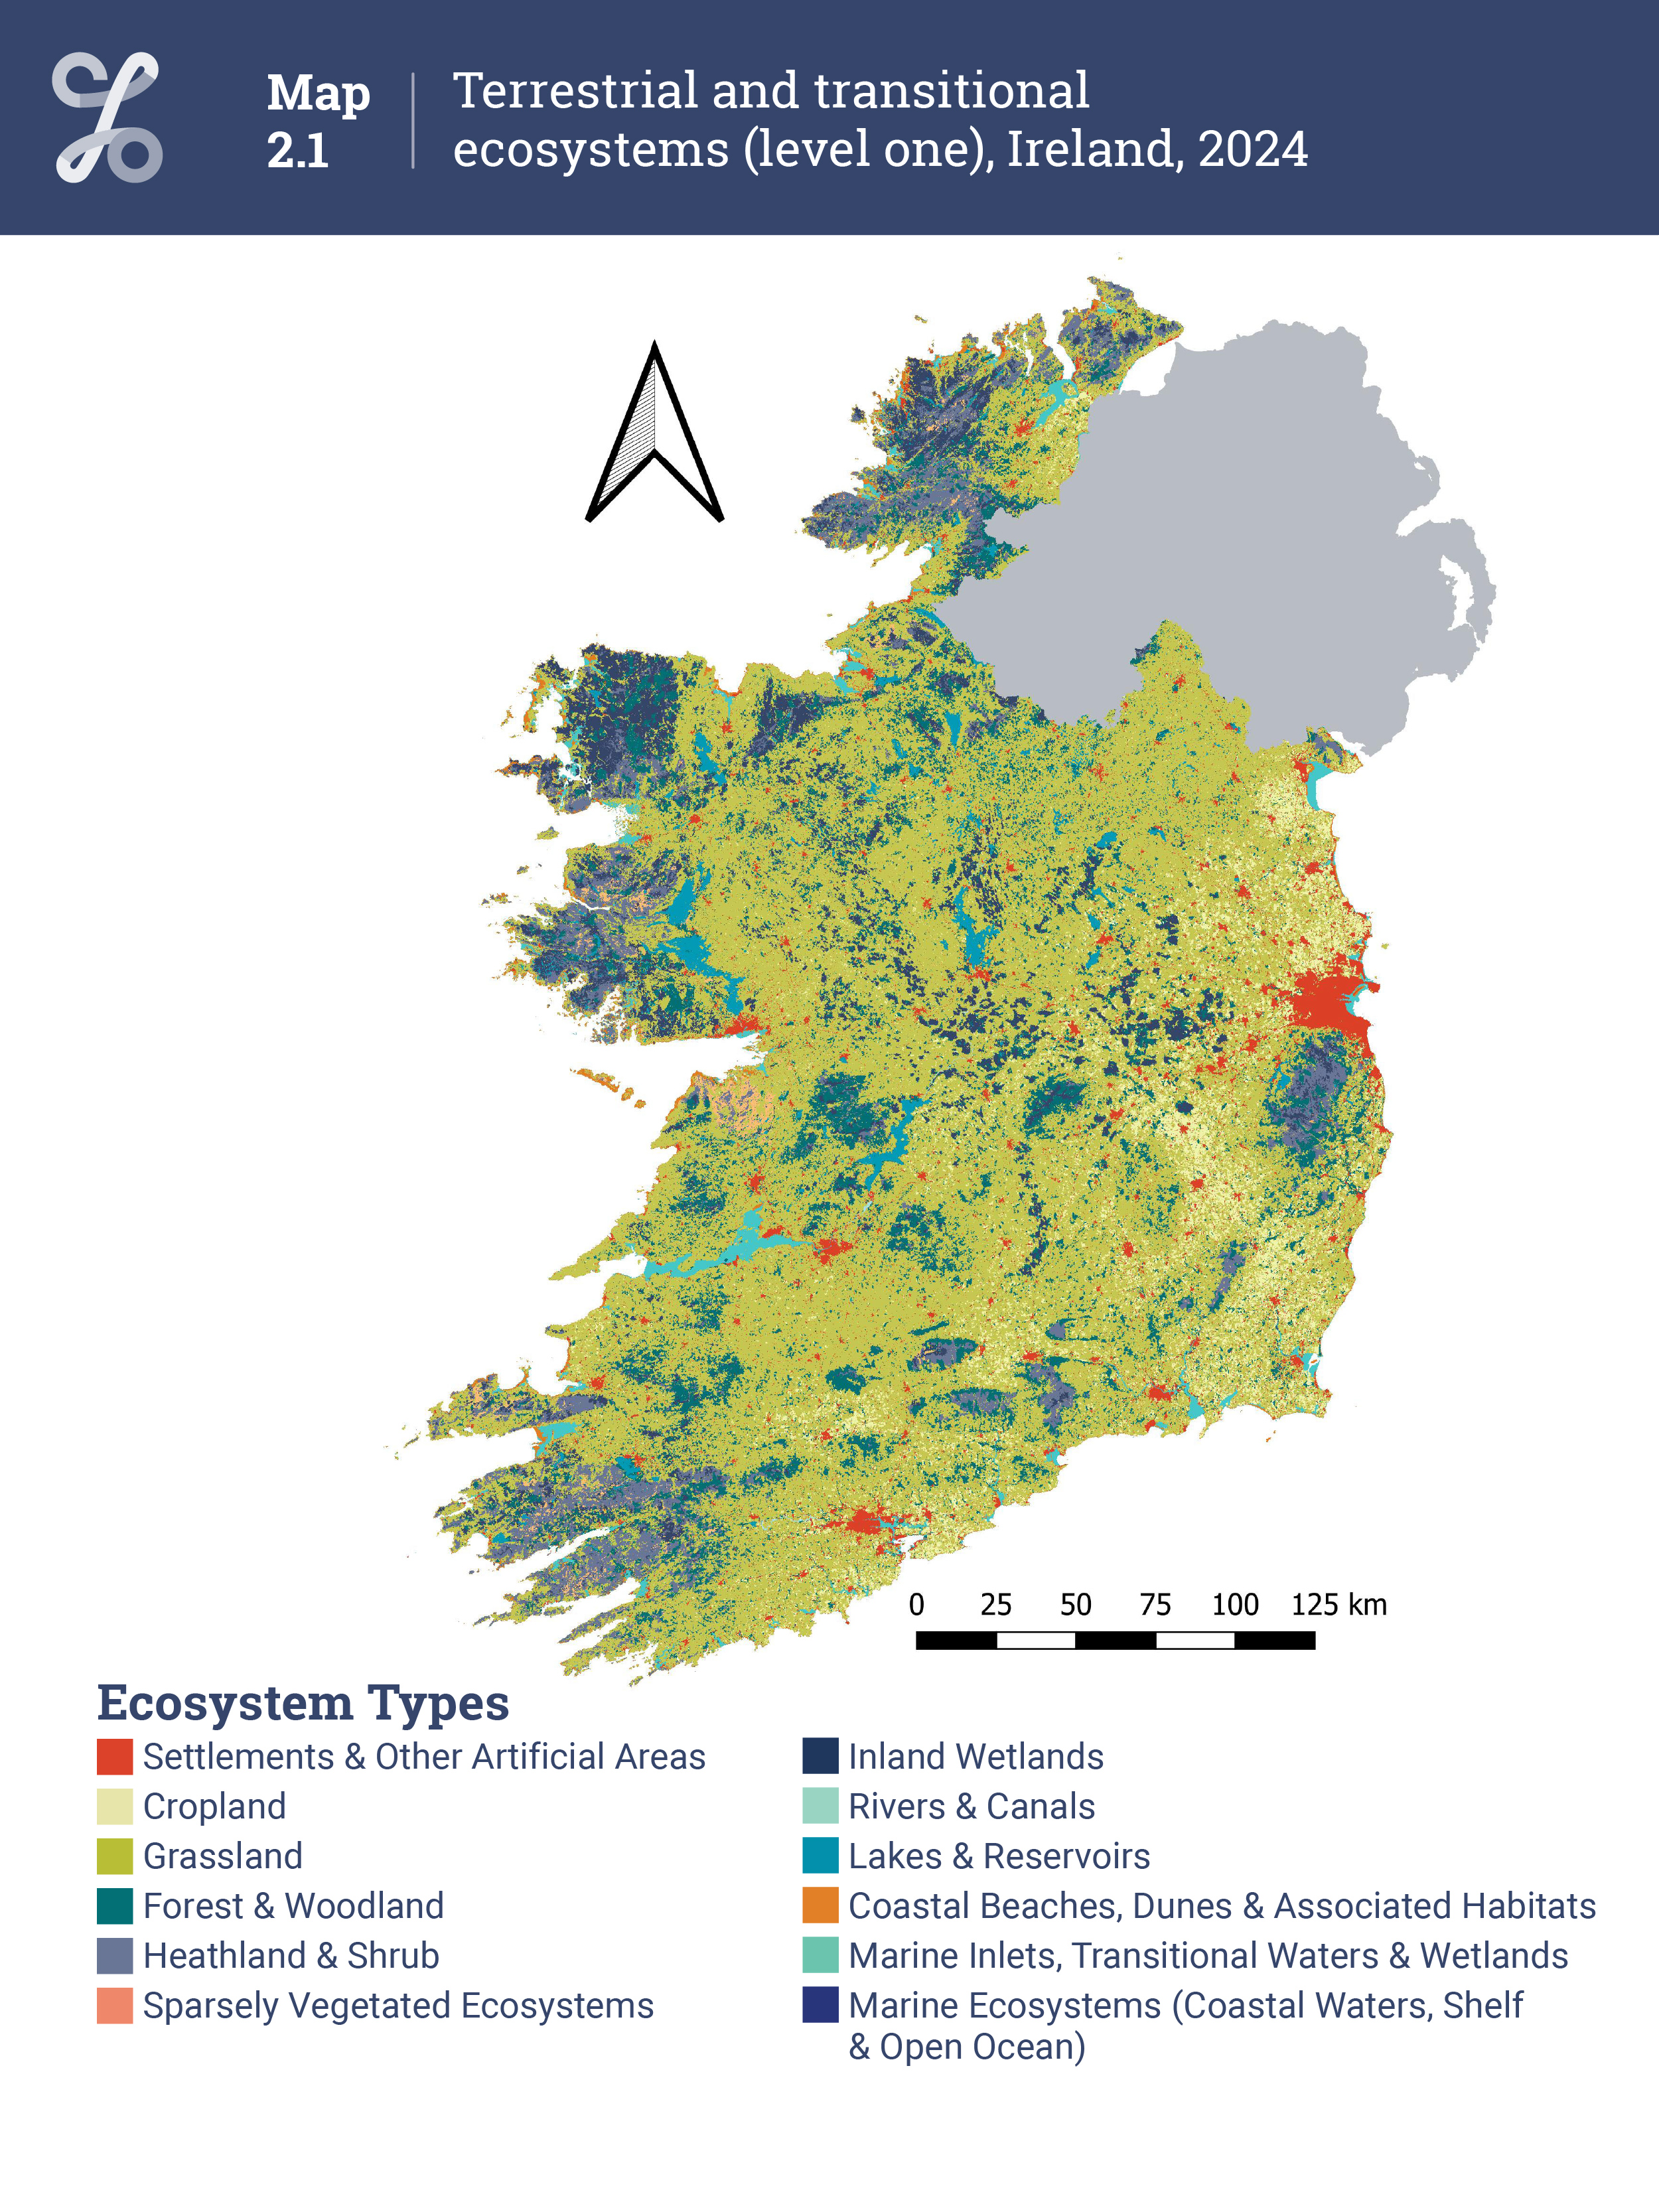
Map 2.1 Terrestrial and transitional ecosystems (level one), Ireland, 2024
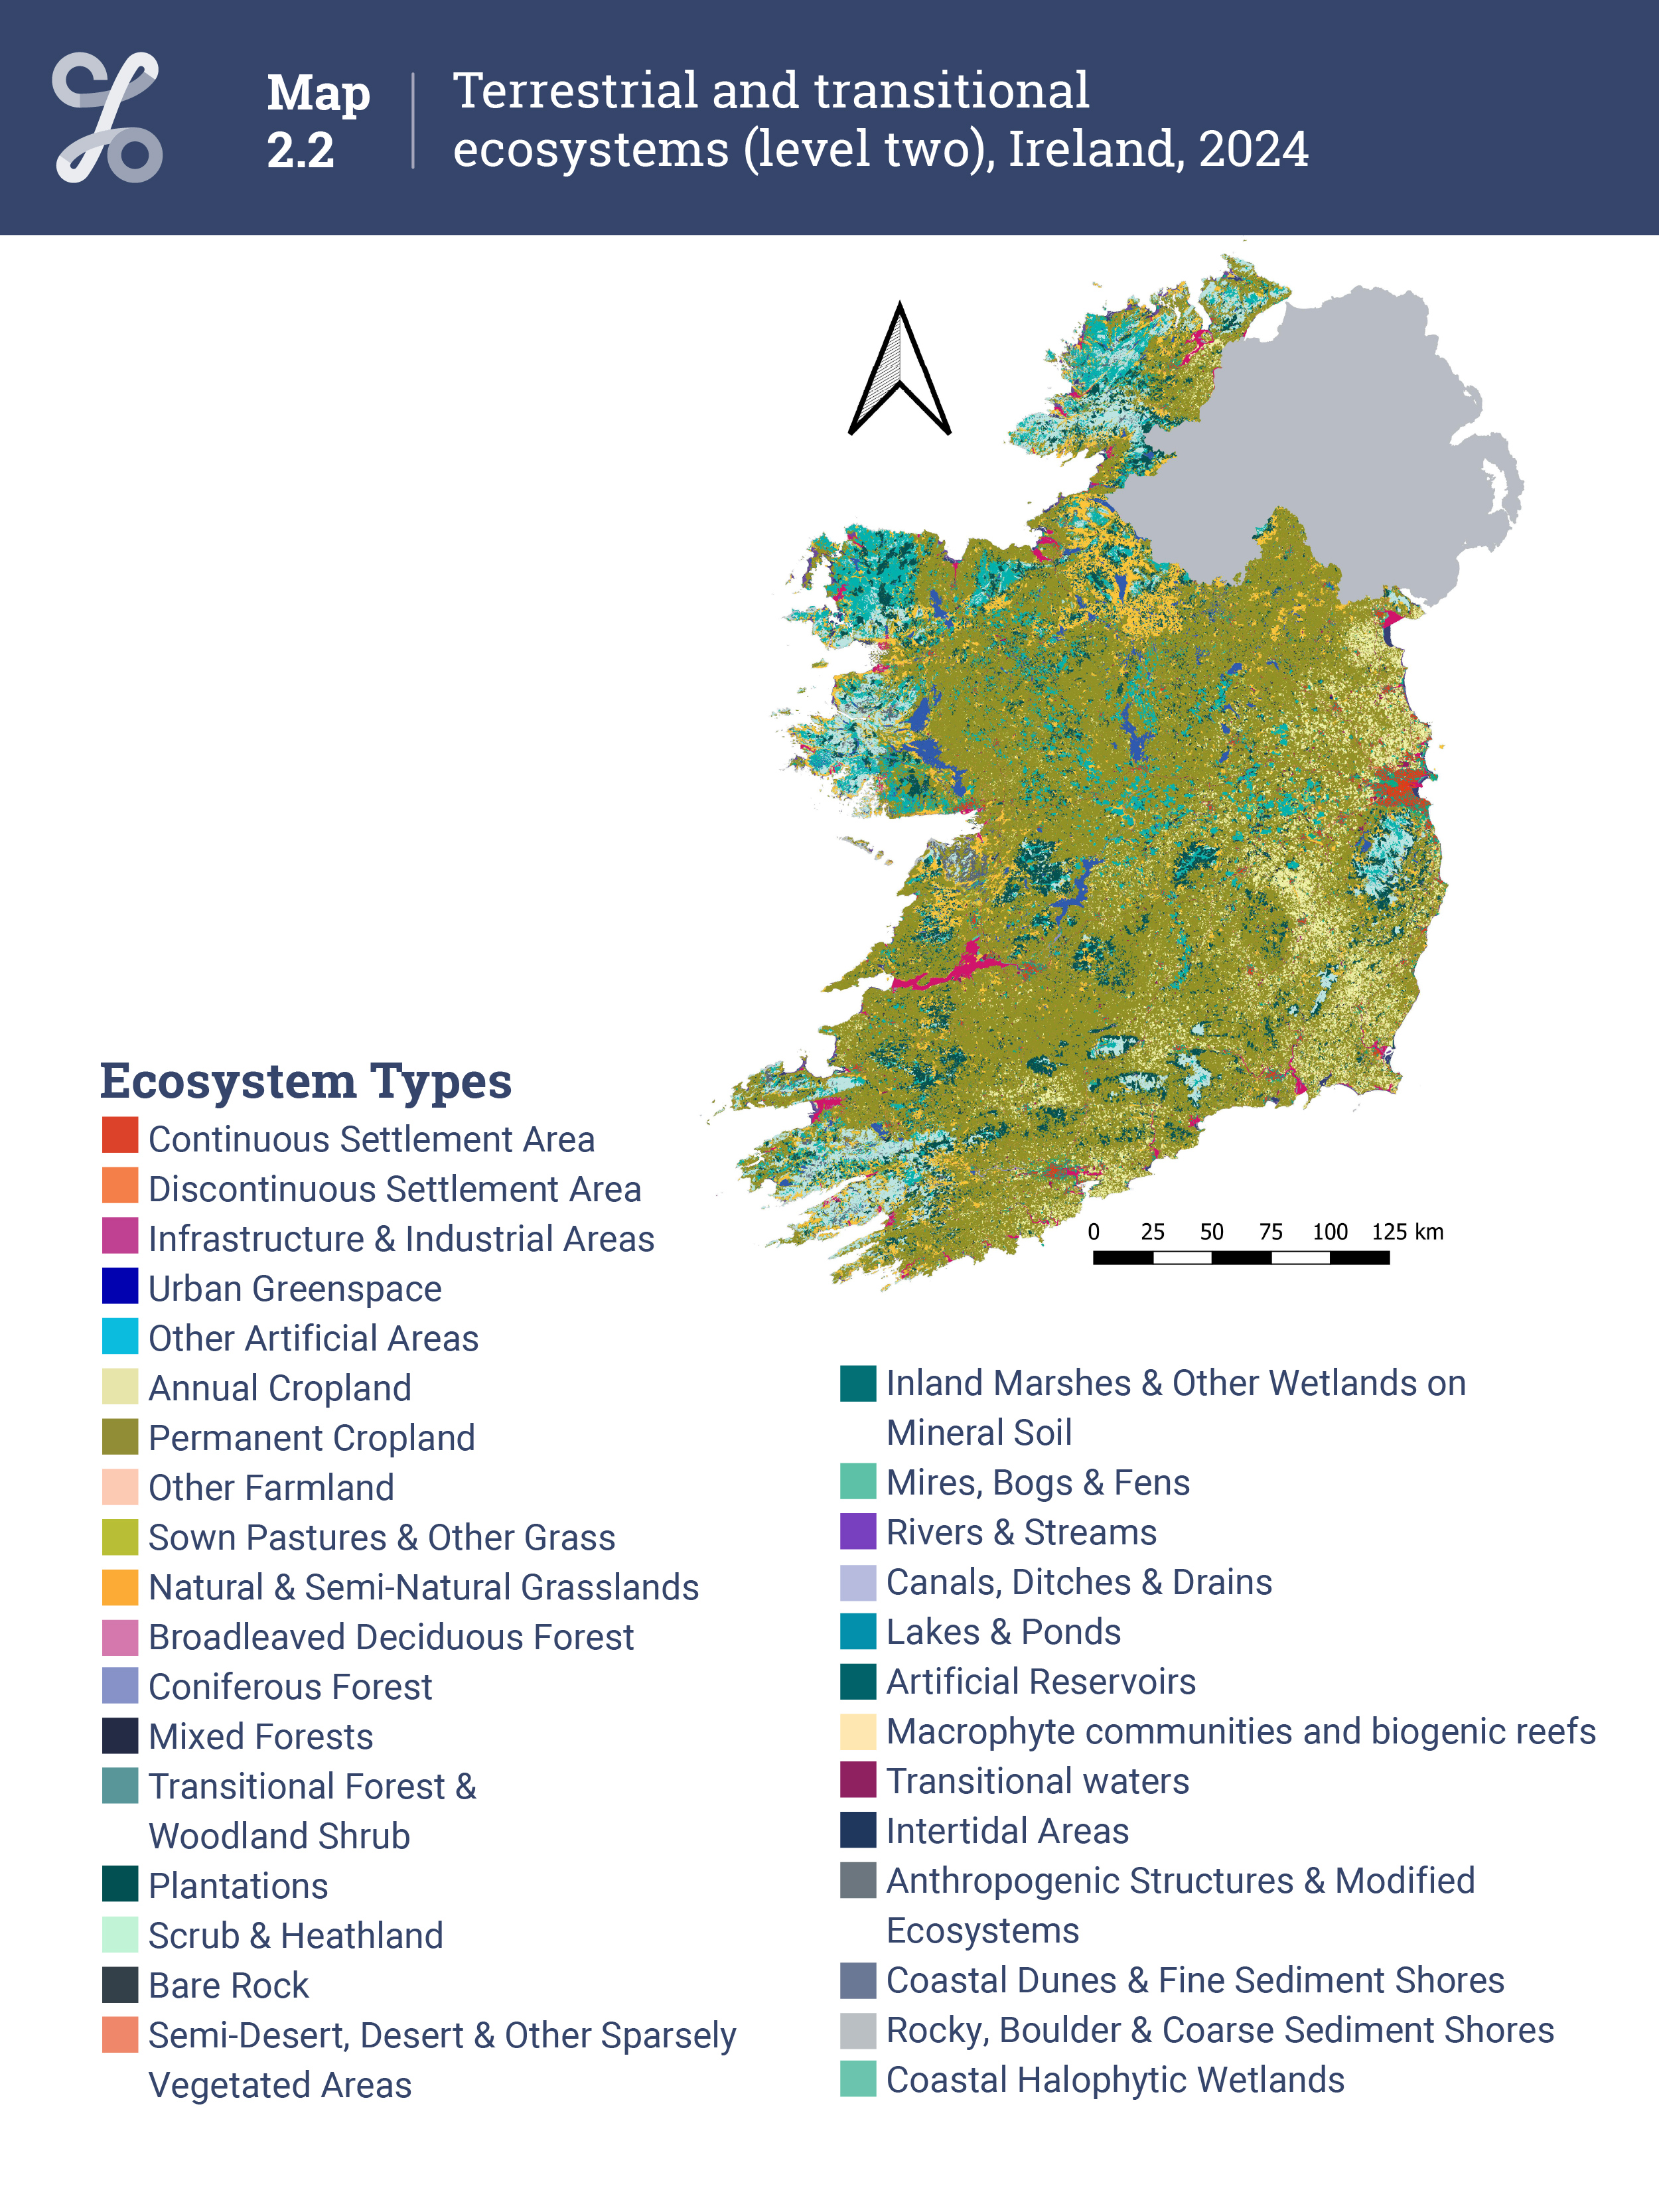
Map 2.1 Terrestrial and transitional ecosystems (level two), Ireland, 2024
Settlements & Other Artificial Areas had the largest increase of any ecosystem in Ireland between 2018 and 2024 (Table 2.1, Figure 2.3), rising by 30,300 hectares (+10.1%). As a percentage of Ireland’s total land area, it increased from 4.3% to 4.7% during this period. Expansions in this ecosystem were mostly due to conversions from Grassland (Figure 2.5, Figure 2.6) and corresponded mainly to a large increase of 25,900 hectares (+26.3%) in Discontinuous Settlement Area (Table 2.1, Figure 2.4).
Grassland conversions to Discontinuous Settlement Area mostly corresponded to changes from Sown Pastures & Other Grass, which included 13,000 hectares between 2018 and 2021, and 12,900 hectares between 2021 and 2024 (Table 2.4, Table 2.5). It also included conversions from Annual Cropland, although these were much lower at 1,300 hectares between 2018 and 2021 (Table 2.4), and 1,000 hectares between 2021 and 2024 (Table 2.5).
Continuous Settlement Area also increased (2,700 hectares, +3.9%; Figure 2.4). This was almost entirely due to conversions from Urban Greenspace, which included 2,000 hectares between 2018 and 2021 (Table 2.4), and 1,600 hectares between 2021 and 2024 (Table 2.5)
Infrastructure had a net increase, expanding by 1,900 hectares (+6.5%; Figure 2.4). Increases in this ecosystem correspond to new transport infrastructure such as roads and associated vegetation. It also includes airports, for example Dublin Airport’s North Runway, which was completed in 2022.
Between 2018 and 2024, Forest & Woodland expanded by 6,600 hectares (+0.8%), increasing from 11.8% to 11.9% of Ireland’s total land area (Table 2.1, Figure 2.1, Figure 2.3). At level two of the EU ecosystem typology, this included an increase of 7,400 hectares (+5.1%) in Broadleaved Deciduous Forest and 5,600 hectares (+0.9%) in Plantations (Figure 2.4). During the same period, there was a reduction of 8,000 hectares (-21.8%) in Transitional Forest & Woodland Shrub (Figure 2.4).
The net increase in Broadleaved Deciduous Forest was almost entirely due to conversions from Sown Pastures & Other Grass (Table 2.4, Table 2.5). This corresponds to both afforestation and natural woodland regeneration. By contrast, Plantations increased mainly due to conversions from Transitional Forest & Woodland Shrub, which generally corresponds to replanting on commercial forest sites. For Broadleaved Deciduous Forests, there were also large conversions in the other direction (i.e. into Sown Pastures & Other Grass), with 5,500 hectares and 6,500 hectares converting between 2018 and 2021, and 2021 and 2024, respectively (Table 2.4, Table 2.5). This can include clearing of woodland scrub to make way for grass pasture.
Mixed Forests – where neither broadleaved deciduous nor conifer trees are the dominant species – increased by 1,500 hectares (+3%) between 2018 and 2024 (Figure 2.4). This was mainly due to conversions from Plantations, including 1,600 hectares between 2018 and 2021, and 1,100 hectares between 2021 and 2024 (Table 2.4, Table 2.5).
Except for Permanent Cropland – which did not change – all Grassland and Cropland ecosystems declined in extent between 2018 and 2024 (Table 2.1, Figure 2.3, Figure 2.4). The largest of these was Sown Pastures & Other Grass (-30,200 hectares, -0.8%) and Annual Cropland (-6,700 hectares, -1.4%).
These ecosystems also saw the largest conversions, primarily between each other. Between 2018 and 2021, 74,200 hectares of Annual Cropland were converted into Sown Pastures & Other Grass, whereas 60,200 hectares were converted in the other direction (Table 2.4). These figures were 55,100 and 63,200 between 2021 and 2024, respectively (Table 2.5). Conversions here include changes into temporary grassland (i.e. Annual Cropland), where fields used to grow crops and fields harbouring low-productivity grassland are resown with grass seed as part of crop rotations and grass improvement efforts.
The net decrease in both Grassland and Cropland ecosystem types was mainly due to conversions into Settlements & Other Artificial Areas – this included 20,300 hectares between 2018 and 2021 (Table 2.2), and 17,300 hectares between 2021 and 2024 (Table 2.3).
In 2024, Inland Wetlands and Heathland & Shrub occupied 6.7% (467,400 hectares) and 6.5% (455,100 hectares) of Ireland’s land area, respectively (Table 2.1). Their extents remained stable between 2018 and 2024, although there were relatively small conversions between Mires, Bogs & Fens and ecosystems Sown Pastures & Other Grass and Broadleaved Deciduous Forest (Table 2.4, Table 2.5).
Both types of conversions correspond to highly transitional bare and cutover peat areas which are under varying degrees of management and where naturally regenerating, low growing vegetation and woodland scrub may be observed. Changes in these areas are captured from satellite imagery which can be partly influenced by year-to-year weather variation, meaning such changes should be considered with caution.
These ecosystems occupied 0.6% (43,700 hectares) of Ireland’s land area in 2024 (Table 2.1). This included 42,700 hectares of Bare Rock ecosystems (i.e. karst limestone pavements) and 1,000 hectares of Semi-Desert, Desert & Other Sparsely Vegetated Ecosystems (i.e. exposed soil). They reduced by 500 hectares each between 2018 and 2024 (Figure 2.4), most of which (700 hectares) was due to conversions into Infrastructure between 2018 and 2021 (Table 2.4). These conversions should be treated with caution, as they tend to correspond to extraction sites (i.e. mines and quarries) for which available geospatial data has improved in subsequent years.
These include the ecosystems Rivers & Canals and Lakes & Reservoirs, which remained stable in their extent between 2018 and 2024 (Table 2.1). Rivers & Canals made up 0.1% (4,700 hectares) of Ireland’s land area in 2024. These ecosystems tend to be inland rivers with larges widths of at least 50 m (e.g. River Shannon and River Lee), whereas more narrow rivers were accounted for as part of their surrounding ecosystems (e.g. Grassland or Forest & Woodland).
Lakes & Reservoirs occupied 1.8% (124,500 hectares) of Ireland’s land area in 2024. Similarly to Rivers & Canals, Lakes & Reservoirs (e.g. small ponds) smaller than 1 hectare were accounted for as part of their surrounding ecosystems.
The extents of these ecosystems remained stable between 2018 and 2024 (Table 2.1, Figure 2.3, Figure 2.4). They include Coastal Beaches, Dunes & Wetlands, Marine Inlets & Transitional Waters and Marine Ecosystems (open ocean below the low water mark). It should be noted that these ecosystems were redefined by Eurostat at their level two ecosystem classifications as part of a final revision to the EU ecosystem typology.
In 2024, Coastal Beaches, Dunes & Wetlands (61,900 hectares) made up 0.9% of Ireland’s total land area (Table 2.1, Figure 2.1). This included 20,700 hectares of Coastal Dunes & Fine Sediment Shores, 35,200 hectares of Rocky, Boulder & Coarse Sediment Shores, and 6,000 hectares of Coastal Halophytic Wetlands (Figure 2.2).
Marine Inlets & Transitional Waters had a total area of 110,300 hectares in 2024 (Table 2.1, Figure 2.1). This included 4,400 hectares of Macrophyte Communities & Biogenic Reefs, 73,100 hectares of Transitional Waters (i.e. estuaries, deltas and lagoons), 29,800 hectares of Intertidal Areas and 3,000 hectares of Anthropogenic Structures & Modified Ecosystems (i.e. aquaculture sites; Figure 2.2).
Marine Ecosystems made up the vast majority of Ireland’s ecosystem accounting area (90.9%), at 71,281,300 hectares in 2018, 2021 and 2024 (Table 2.1). Note, no breakdown of this ecosystem at level two of the EU ecosystem typology is provided in this release.
Ecosystem extent accounts for each local authority are given below for the periods 2018 to 2021 (Table 2.6) and 2021 to 2024 (Table2.7). The closing extent of each ecosystem for each local authority can also be visualised in Map 2.3. Accounts for each county are provided only in PxStat tables accessed in the Data chapter. Note, additions and reductions in each ecosystem are not currently calculated at local authority or county level.
Learn about our data and confidentiality safeguards, and the steps we take to produce statistics that can be trusted by all.