Back to Top

 Skip navigation

Multinationals: An Irish Perspective

Open in Excel:

Multinationals play an important role in the economies of many countries. Increasingly, multinationals create a physical presence in several countries around the world in order to maximise their global earnings.

This chapter presents statistics on the activities of the affiliates of Irish multinationals abroad and the contribution made by the affiliates of Foreign multinationals in Ireland. See Tables 7.1, 7.2 and 7.3 at the end of this section for more detail on the data in the graphs.


Open in Excel:

Figure 7.1 Employment in Irish affiliates abroad, 2015

Figure 7.1 Employment in Irish affiliates abroad, 2015

  • In terms of employment in Irish multinationals abroad by continent, Europe, Asia and America each had just under a third of the total
  • Employment in the remaining regions amounted to a little over 2%

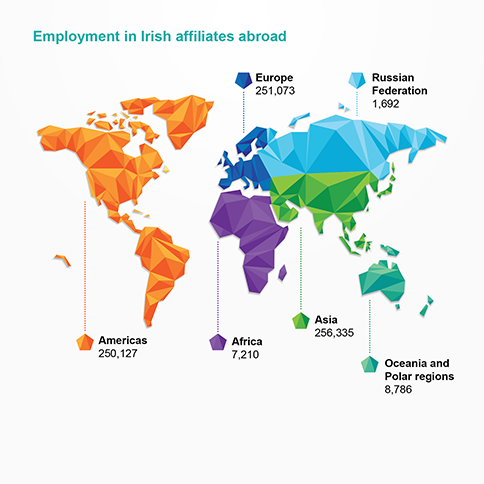
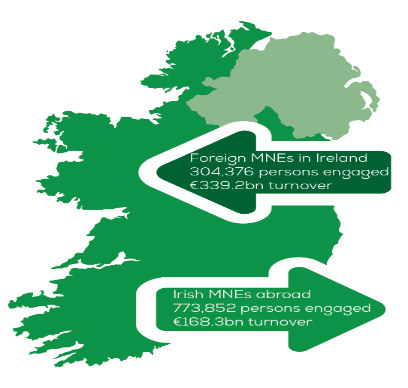
Figure 7.2 Irish MNEs abroad and foreign MNEs in Ireland, 2015

Figure 7.2 Irish MNEs abroad and foreign MNEs in IRELAND, 2015

  • ‌In 2015, Irish multinationals employed almost 774,000 persons in Foreign affiliates and generated Turnover of €168.3 billion
  • By contrast, Foreign multinationals employed just under 304,400 persons in affiliates in Ireland and generated Turnover of €339.2 billion
Open in Excel:
  • In 2015, Irish multinationals abroad had turnover in excess of €168bn
  • The US and UK affiliates accounted for almost 61% of all turnover
For long labels below use
to display on multiple lines
Active enterprises
United
States
34.6
United
Kingdom
26.1
Other
countries
39.2
  • There were nearly 774,000 persons employed in Irish multinationals abroad
  • 35% of all employment in Irish multinationals abroad were based in the US and the UK
For long labels below use
to display on multiple lines
Active enterprises
United
States
21.7
United
Kingdom
13.3
Other
countries
65
2015
China27326
Germany22494
Mexico20838
France20610
Brazil18062
Spain17849
Italy16455
Netherlands16142
Canada12635
Argentina9633
  •  Aside from the US and UK, there were significant numbers of persons engaged in Irish owned foreign affiliates across the globe, such as China with over 27,000 employees and Mexico with nearly 21,000


2015
Germany6.2
Netherlands5.6
France4.4
Australia4
Spain2.8
Canada2.7
Italy2.7
Switzerland2.6
Belgium2.1
Sweden2
  • Irish owned enterprises in Germany generated turnover in excess of €6.2 billion
  • A number of other countries such as the Netherlands, France and Austrailia also generated a significant amount of turnover in 2015; each country reported turnover in excess of €4 billion
  • Services which includes Distribution, was the dominant sector for employment in Irish affiliates abroad in 2015 with 79.1% of total persons engaged
  • Manufacturing affiliates accounted for 20.2% of employment
  • Other Industrial and Construction sectors employed 0.6% and 0.1% respectively
For long labels below use
to display on multiple lines
Active enterprises
Manufacturing20.2
Other industrial0.6
Construction0.1
Services79.1
  • Most Turnover for Irish affiliates abroad came from the Services sector at 74%
  • The Manufacturing sector accounted for a significant share of total Turnover at 23.2%
For long labels below use
to display on multiple lines
Active enterprises
Manufacturing23.2
Other industrial2.3
Construction0.4
Services74
Turnover
Other6.3
Construction0.6
Information and Communication6.8
Financial and Insurance activities5.8
Professional, Scientific and Technical activities34.2
Manufacturing23.2
Distribution23.1
  • The Professional, Scientific and Technical sector had the largest share of turnover generated by Irish affiliates abroad at 34.2%
  • The Manufacturing and Distribution sectors accounted for just over 23% of turnover each
  • The rest of the sectoral activities combined were responsible for less than 20% of total turnover 
ServicesManufacturing
Irish6138.1
British45.330.6
French46.339.1
German57.540.7
Italian30.555.1
00
EU2849.439.5
  • Figures for Irish-owned multinationals outside the EU show that the Services sector generated 61.0% of all turnover compared to 38.1% for Manufacturing
  • Irish and German owned multinationals each had over the EU average of 49.4% of their turnover from Services
  • Italy generated significantly more turnover from Manufacturing than the EU average
Table 7.1 Turnover and number of persons engaged in Irish-owned foreign affiliates, 2015

Table 7.2 Turnover and number of persons engaged in Irish-owned foreign affiliates by sector, 2015

Open in Excel:

The Financial and Insurance sector is excluded from this section. Accordingly, all the measures below relate to the non-financial business economy only (which encompasses the broad sectors of Industry, Services, Distribution and Construction).

20142015
Number of enterprises1.51.3
Persons engaged24.322.2
Turnover52.756.4
GVA52.163.3
  • Foreign-owned enterprises in 2015, accounted for 63.3% of total GVA and 56.4% of total Turnover in the Irish non-financial business economy
  • Despite such large contributions to GVA and Turnover, foreign-owned enterprises accounted for just 1.3% of the total number of enterprises in the Irish business economy 
  • Out of a total of 260,267 enterprises, 3,504 Foreign-owned enterprises accounted for 22.2% of persons engaged in the Irish business economy
  • In 2015, the contribution of Foreign-owned enterprises to the Irish business economy had risen from 52.1% in 2014 to 63.3% of GVA 
20142015
Number of enterprises3.63.9
Persons engaged39.241.7
Turnover72.986
GVA72.689.2
  • The Industry sector in particular was dominated by foreign-owned enterprises in 2015, with 86.0% of Turnover and 89.2% of GVA, the bulk of which came from enterprises that were owned outside the EU
  • There were 672 foreign owned enterprises in the Industrial sector, which represented just 3.9% of all enterprises but accounted for 41.7% persons engaged
20142015
Number of enterprises2.21.8
Persons engaged25.624.5
Turnover38.632.8
GVA40.736.4
  • In the Distribution sector, which includes Retail & Wholesale Trade, 842 or 1.8% of all enterprises were foreign-owned
  • These foreign-owned enterprises employed nearly one quarter, 24.5%, of all persons engaged in this sector and contributed over 36% of total GVA
20142015
Number of enterprises1.51.3
Persons engaged21.618.1
Turnover52.343.2
GVA44.838.9
  • Just 1.3% of all Services enterprises in Ireland were foreign owned, and they employed 18.1% of persons engaged in the sector
  • These enterprises accounted for 43.2% of total Turnover and 38.9% of total GVA
  • EU owned services enterprises accounted for over half of all foreign owned enterprises and their employees, while over three quarters of the Turnover and GVA came from enterprises owned outside the EU 
Gross Value Added
Hungary52.7
Ireland52.1
Luxembourg47
Romania43.9
Slovakia43.4
Czech Republic42.3
Bulgaria33
Latvia31.1
United Kingdom29.9
Poland29.1
Belgium27.5
Sweden27.4
Netherlands27.3
Lithuania26.5
Estonia26.4
Austria26.3
Croatia24.9
EU2824.1
Slovenia24.1
Malta22.6
Portugal22.3
Germany21.8
Finland21.6
Denmark21.3
Spain21.1
France16
Italy14.7
Greece12
Cyprus11.2
  • Ireland ranked second in the EU28 for Gross Value Added contributions from Foreign-owned enterprises to the overall non-financial economy in 2014, at 52.1% of total GVA. Hungary had the highest rate at 52.7%
  • This is in comparison to the EU28 average of 24.1% for 2014
  • Other high ranking countries included Luxembourg at 47%, Romania with 43.9% and Slovakia with 43.4% respectively
7.3 Structural business statistics by sector and nationality of ownership, 2015

Go to next chapter >>> Financial Sector